S-REIT Retail Buys vs Big Money Exit - Daily Pulse: SGX 6 Apr
Beyond the bank-driven rally, Olam and GeoEnergy numbers reveal a different truth. We audit the liabilities the headlines missed today.

🦎 Daily Pulse: SGX Digest — 6 April 2026
The Straits Times Index is flashing green. The wallets most Singaporeans actually rely on are not.
The STI held a reference close of 4,947.50 on 2 April, the final trading day before the Easter long weekend. On the morning of 6 April, it opened near 4,950. On the surface, this looks like strength. Headlines talk about resilience. Screens look calm.
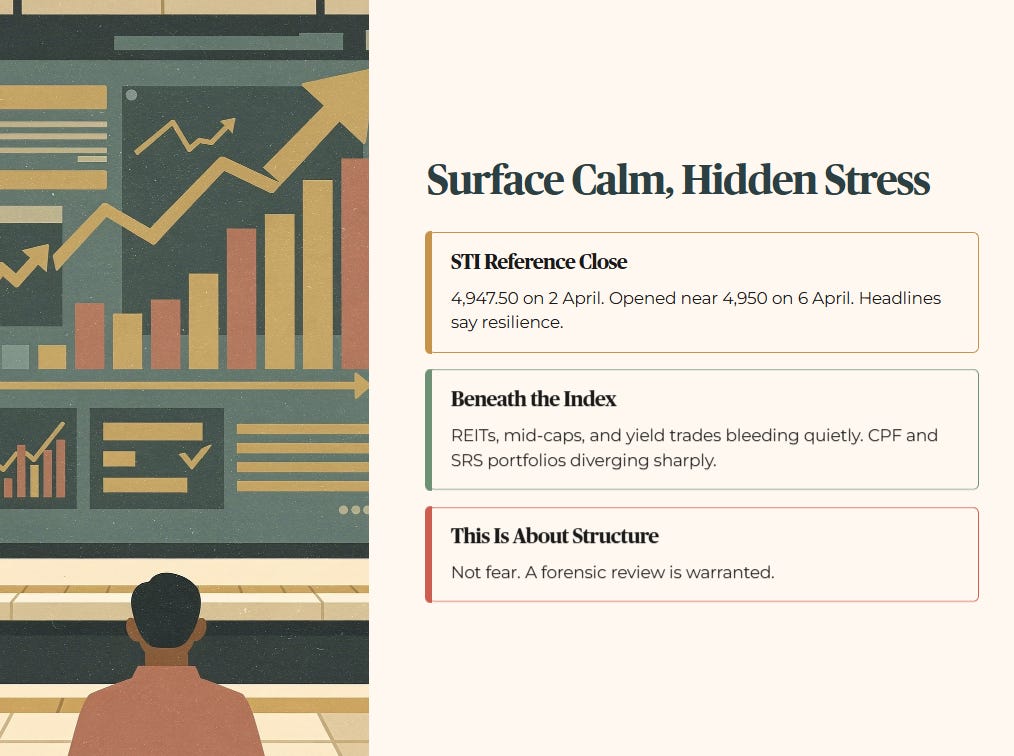
But beneath the index, the mechanics tell a different story. Retail portfolios heavy with REITs, mid-caps, and yield trades are bleeding quietly. The divergence between index heavyweights and the assets most CPF and SRS investors actually hold is now wide enough to trigger a forensic review.
This is not about fear. This is about structure.

In This Article:
Market Snapshot The Optics Versus the Math
The Three Layer Split in the Singapore Market
The Audit Begins Case Studies
Financial Health Checklist
Dividend Trajectory Forensic View
Peer Comparison Snapshot
Analyst Chatter Filtering the Noise
Watchlist and Yield Spread The Hard Floor Test
Iggy’s Forensic Compliance Standards Standard Disclaimer
About Iggy & the Elite Investors
The Window Closes Fast. In this market, the difference between a “Sanctuary” and a “Yield Trap” is decided in a single trading session. By the time this analysis reaches you as a free subscriber, the entry window Iggy identified has already opened — and often closed.

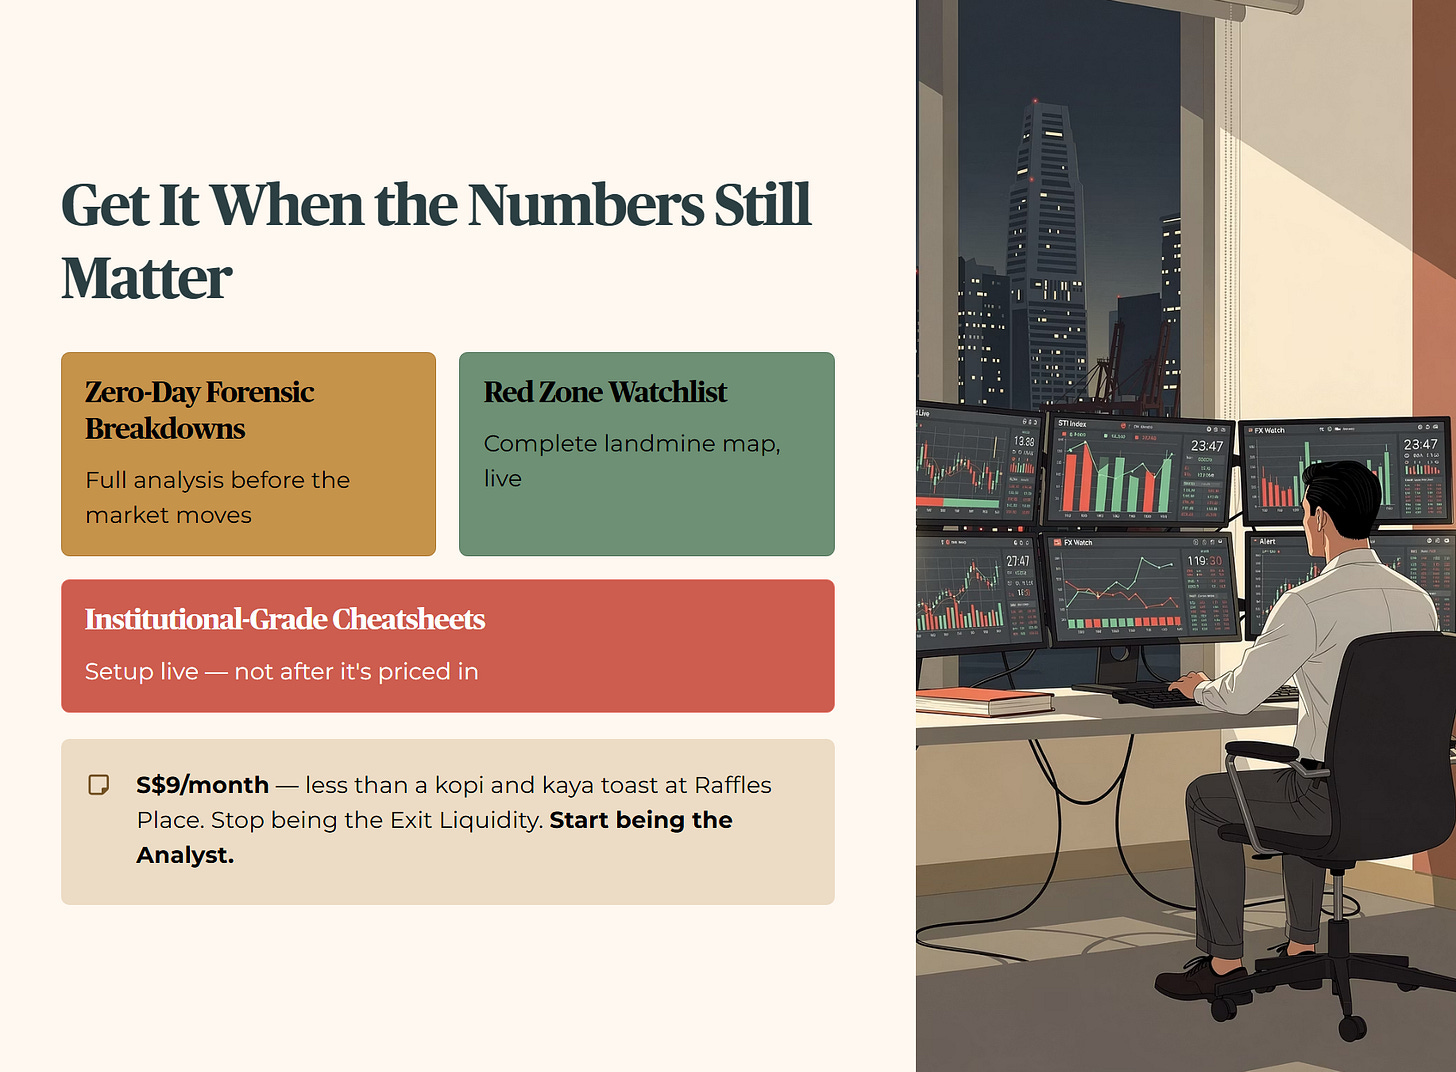
Iggy’s Elite Investors don’t just get the report earlier. They get it when the numbers still matter — zero-day forensic breakdowns, the full “Red Zone” watchlist, and institutional-grade cheatsheets at the moment the setup is live, not after the market has already priced it in.
For S$9/month — less than a kopi and kaya toast set at Raffles Place — you stop being the Exit Liquidity and start being the Analyst.
Market Snapshot — The Optics Versus the Math
The STI’s Q1 2026 total return came in at 5.6%, driven predominantly by financials and industrial heavyweights. ST Engineering delivered +28.4%, Wilmar +25%, and SGX +15.8% on a total return basis. Banks continue to harvest elevated net interest margins, and their balance sheets remain fortresses by regional standards.
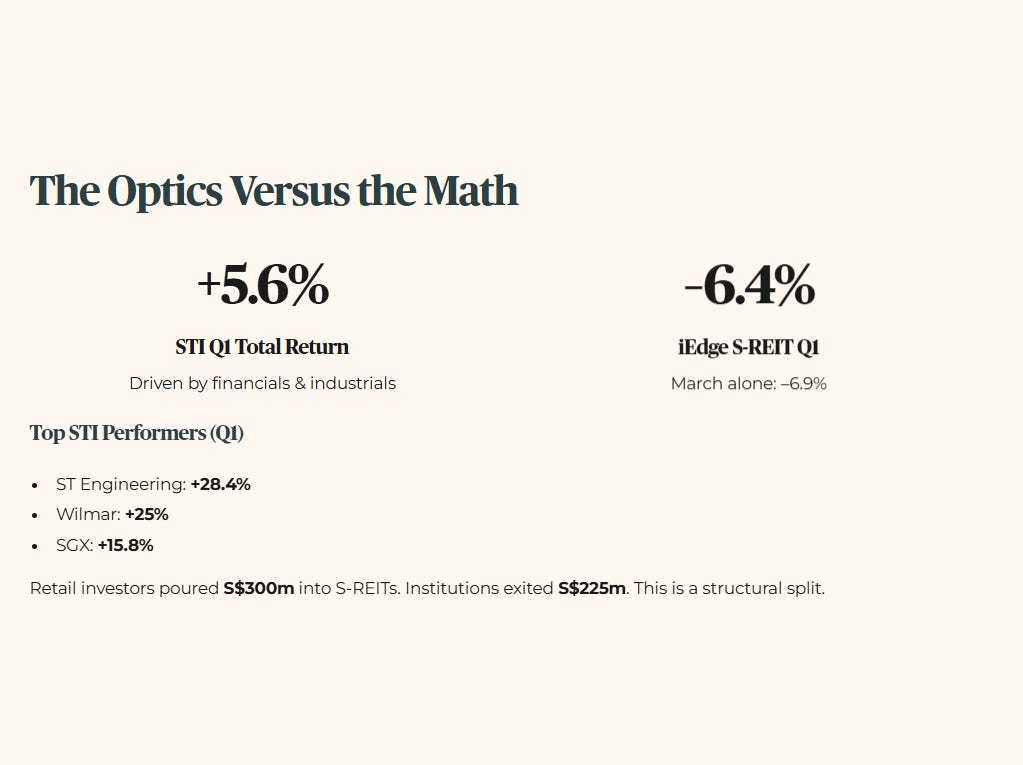
Contrast that with the iEdge S-REIT Index. Q1 closed with a –6.4% total return. March alone was –6.9%. Retail investors poured over S$300 million into S-REITs during the month, buying the dip. Institutional investors exited to the tune of S$225 million over the same period.
This is not a rounding error. It is a structural split.
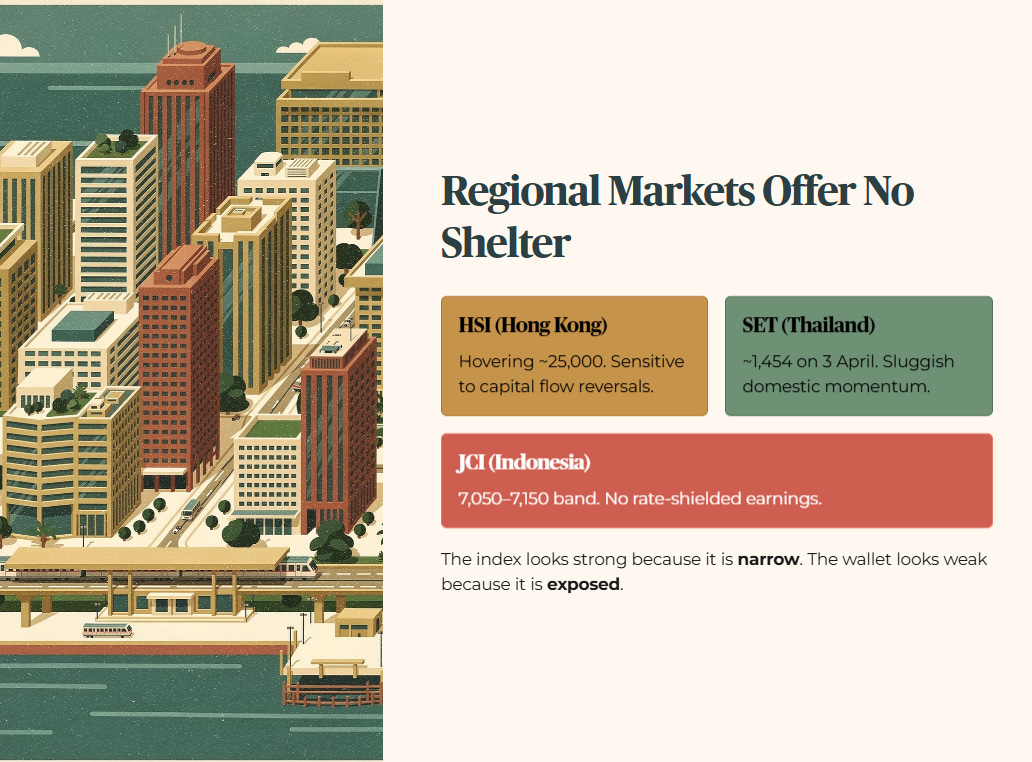
Regional markets offer little comfort. Hong Kong’s HSI continues to hover near the 25,000 region, sensitive to capital flow reversals. Thailand’s SET closed around 1,454 on 3 April, reflecting sluggish domestic momentum. Indonesia’s JCI traded in the 7,050–7,150 band. None of these markets offer the rate-shielded earnings that Singapore’s banking majors currently enjoy.
The index looks strong because it is narrow. The wallet looks weak because it is exposed.
The Three-Layer Split in the Singapore Market
At this stage of the cycle, Singapore equities have effectively split into three camps.
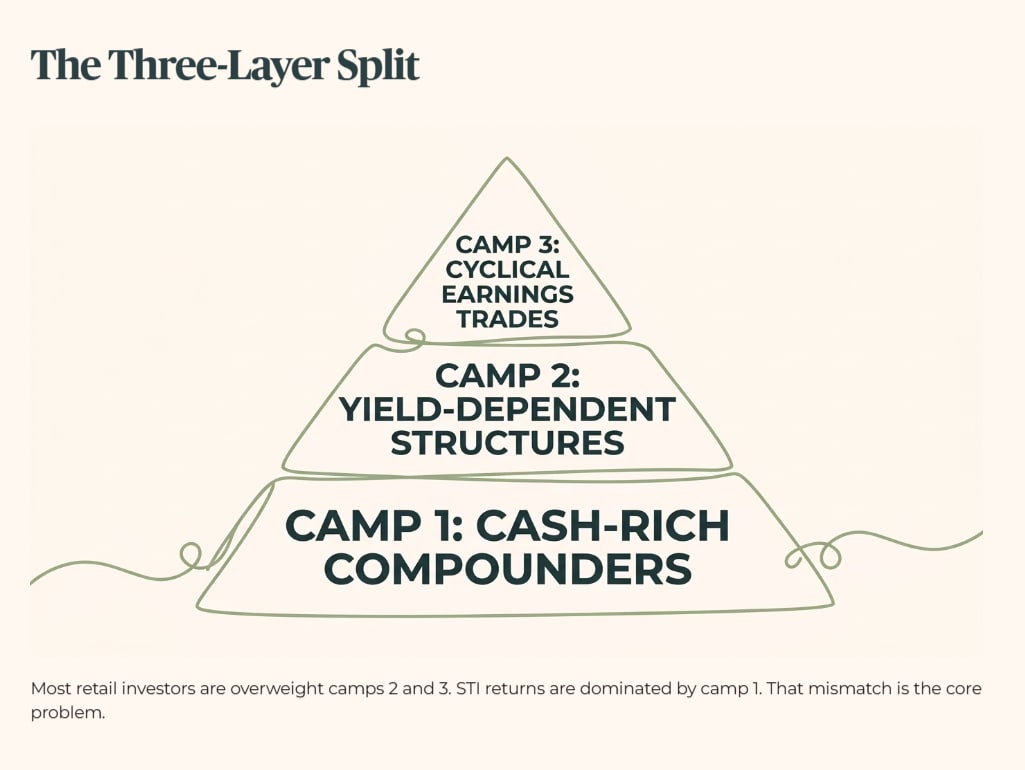
Cash-rich balance sheet compounders — large banks and selected industrials. Low refinancing risk. Earnings buoyed by higher-for-longer rates. These names are carrying the STI.
Yield-dependent leveraged structures — REITs, business trusts, and property-linked vehicles. Operating cash flows increasingly absorbed by interest expense. Distribution optics sustained only if refinancing remains benign. These names are carrying the retail wallet downward.
Cyclical earnings trades — commodities and export-driven names. Peak earnings now behind them. Capital allocation discipline becomes the decisive variable.
Most retail investors are overweight the second and third bucket, while the STI’s returns are dominated by the first. That mismatch is the core problem.
The Audit Begins — Case Studies
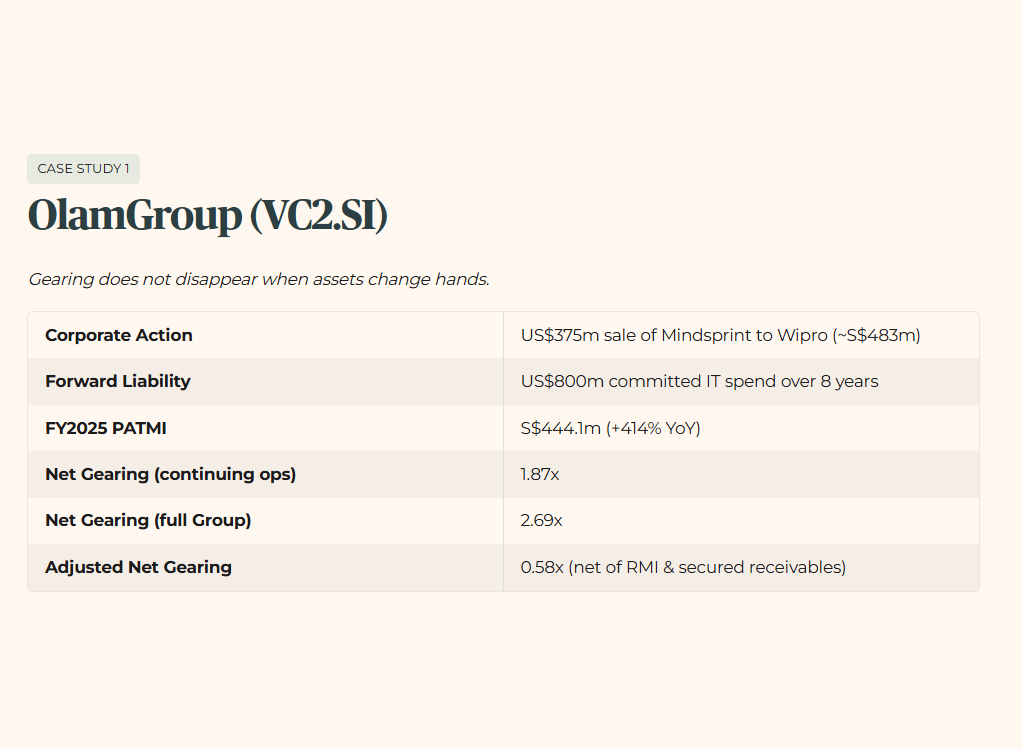
1. OlamGroup (VC2.SI) — Gearing Does Not Disappear When Assets Change Hands
OlamGroup’s corporate story has been marketed as a stepwise simplification. Asset monetisation. Sharper focus. Deleveraging optics. The raw numbers demand a colder look.
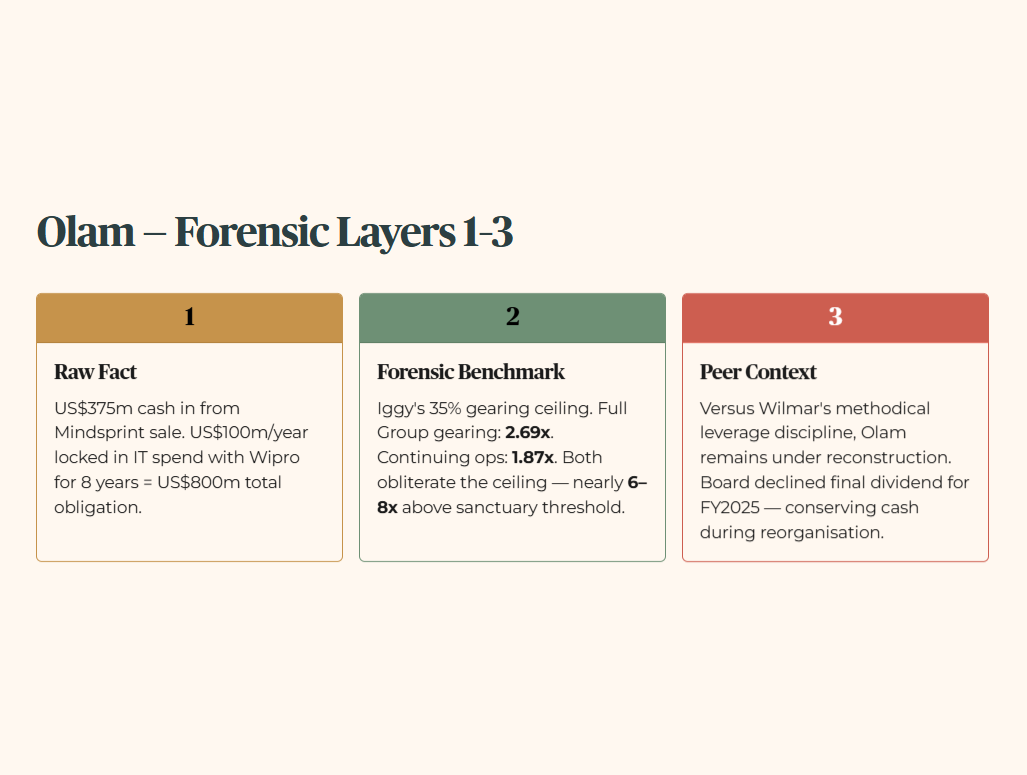
Layer 1 — Raw Fact
OlamGroup is receiving US$375 million (approximately S$483 million) in cash from the sale of its Mindsprint IT unit to Wipro, with completion targeted by end-June 2026. In parallel, it has committed to roughly US$100 million per year in IT spend with Wipro over eight years — a total contractual obligation of approximately US$800 million over the life of the agreement.
Layer 2 — Forensic Benchmark
Under Iggy’s Forensic Compliance Standards, a 35% gearing ceiling is the absolute maximum for assets expected to function as portfolio anchors. OlamGroup’s full consolidated net gearing stood at 2.69x as at 31 December 2025 — this is the legally reported balance sheet position, with Olam Agri still consolidated pending completion of the SALIC sale. Even on the most charitable pro-forma basis, stripping out Olam Agri entirely, continuing operations gearing stands at 1.87x. Both figures obliterate the forensic ceiling. The most favourable reading of the balance sheet is still nearly six times above the sanctuary threshold.
Layer 3 — Peer Context
Compared with WilmarInternational’s methodical working capital discipline and cautious leverage management, OlamGroup’s residual group remains under reconstruction. The promised deleveraging path leaves little margin for operational error or a funding cost surprise. Olam itself acknowledges this — the board declined to recommend a final dividend for FY2025, citing the need to conserve cash during the reorganisation.
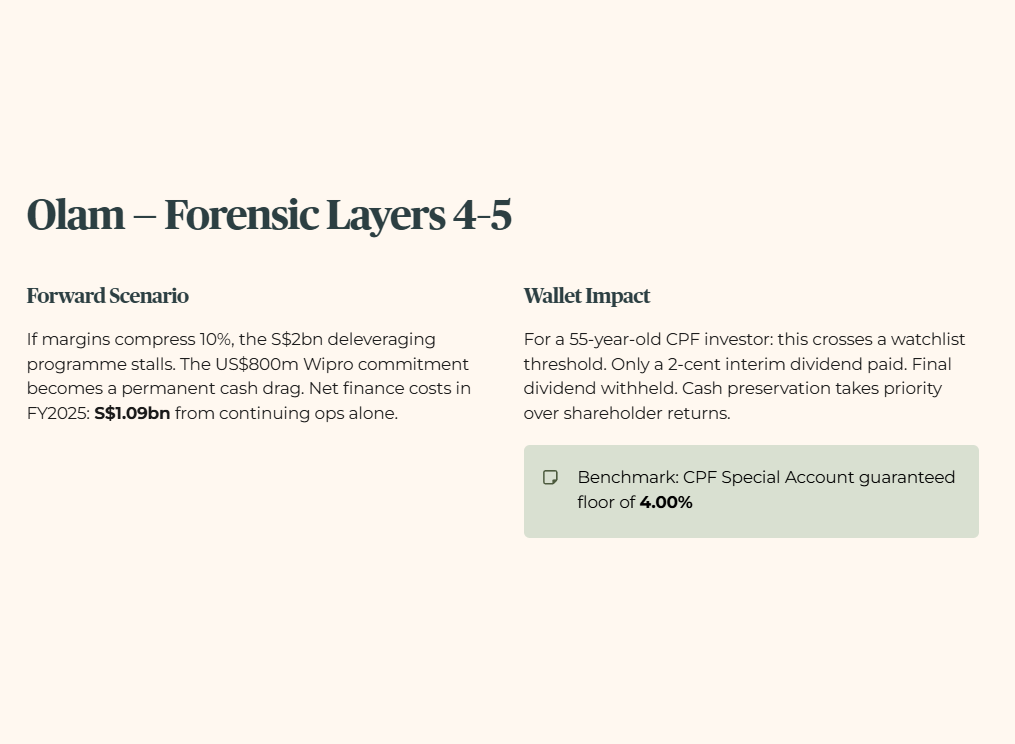
Layer 4 — Forward Scenario
If funding costs remain elevated or operating margins compress by even 10%, the targeted S$2 billion deleveraging programme stalls. At that point, the US$800 million Wipro vendor commitment converts from “operating efficiency” into a permanent cash flow drag — a liability that accounting labels differently but the cash flow statement treats identically. Note also that OlamGroup’s net finance costs in FY2025 were S$1.09 billion from continuing operations alone. The interest burden is not a rounding line. It is a structural constraint.
Layer 5 — Wallet Impact
For a 55-year-old investor in Toa Payoh relying on CPF payouts, this structure crosses a watchlist threshold. This is not a defensive income anchor. The board’s own decision to pay only a 2-cent interim dividend and withhold the final dividend for FY2025 is the clearest possible signal that cash preservation takes priority over shareholder returns at this stage of the reorganisation. Exposure, if any, must be sized with extreme conservatism against the guaranteed 4.00% CPF Special Account floor.
The direction of travel may be correct. The destination remains distant.
🦎 Iggy’s Insight — OlamGroup
Balance sheets do not heal just because assets change hands. The market fixates on the US$375 million cash inflow from the Mindsprint sale and relaxes. That reaction is misplaced. What matters is the net obligation profile. The eight-year, locked-in IT spend recreates a fixed drain on cash flows that behaves very much like debt, even if accounting labels it differently.
When gearing already sits at 2.69x on a fully consolidated basis — nearly eight times above Iggy’s 35% forensic ceiling — swapping explicit leverage for contractual rigidity does not improve resilience. It only shifts where the stress shows up. And the board’s own dividend decision confirms the diagnosis: when a company earning S$444 million in PATMI still withholds its final dividend to conserve cash, the balance sheet is telling you something the press release is not.
Deleveraging is not about optics. It is about removing structural claims on future cash. The invoice looks different. The cash drain does not.