

Still Holding That REIT? Follow the Capital Trail.
From the Strait of Hormuz to your SRS account — the hidden chain the market is not pricing in

I want to tell you what actually got me writing this piece.
A trader friend of mine — he has been in fixed income for over two decades — sent me an article at eleven at night. No message. Just the link. When someone like that sends you something without a word attached, you read it immediately.
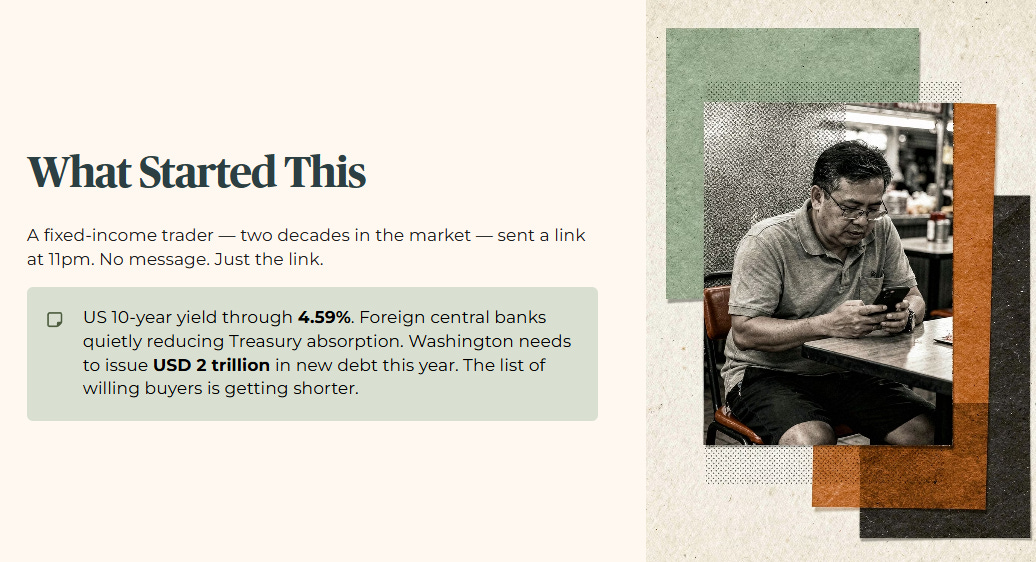
It was about the US ten-year yield moving through 4.59%. Not the number itself — that number had been in the news for weeks. It was the footnote buried in the piece. Foreign central banks were quietly reducing their Treasury absorption pace even as Washington needed to issue over USD 2 trillion in new debt this year alone. Someone was going to have to buy all of that. And the list of willing buyers was getting shorter.
I sat with that for a while. Then I opened my own portfolio tracker.
I want to be clear about who I am doing this analysis for. If you are forty-five and still building, this macro shift is uncomfortable but manageable — you have time to reposition. If you are fifty-eight and drawing down, or already retired and living off distributions in a four-room flat in Toa Payoh or Bedok, this is not an abstract market story. This is your monthly cashflow at risk. I will come back to both of you throughout this piece, because the playbook is different depending on where you are standing.
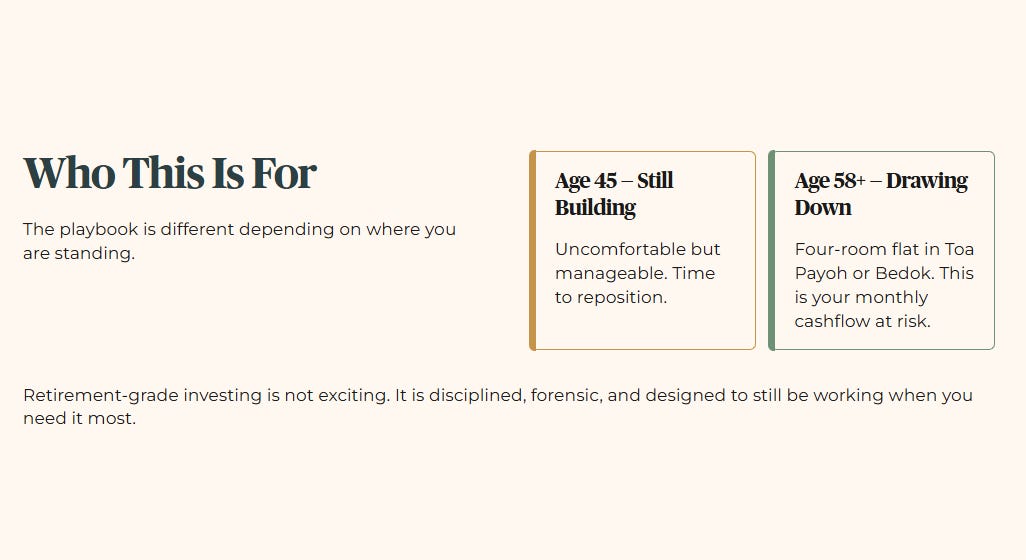
Most financial content is built around excitement — what is surging, what is breaking out, what you might be missing. I am deliberately building something different. Retirement-grade investing is not exciting. It is disciplined, forensic, and it is designed to still be working when you need it most.

In This Article:
The Global Headline
The Local Impact
The Data Proof
The Strategic Landscape
SGX Sector Watch
Macro Scenario Matrix
Forensic Portfolio Stress-Test Questions
The Singapore Investor Playbook
Shock Absorption
The Accumulator
The Drawdown Investor
Outro and Disclaimer
Section 1: The Global Headline (The Storm)
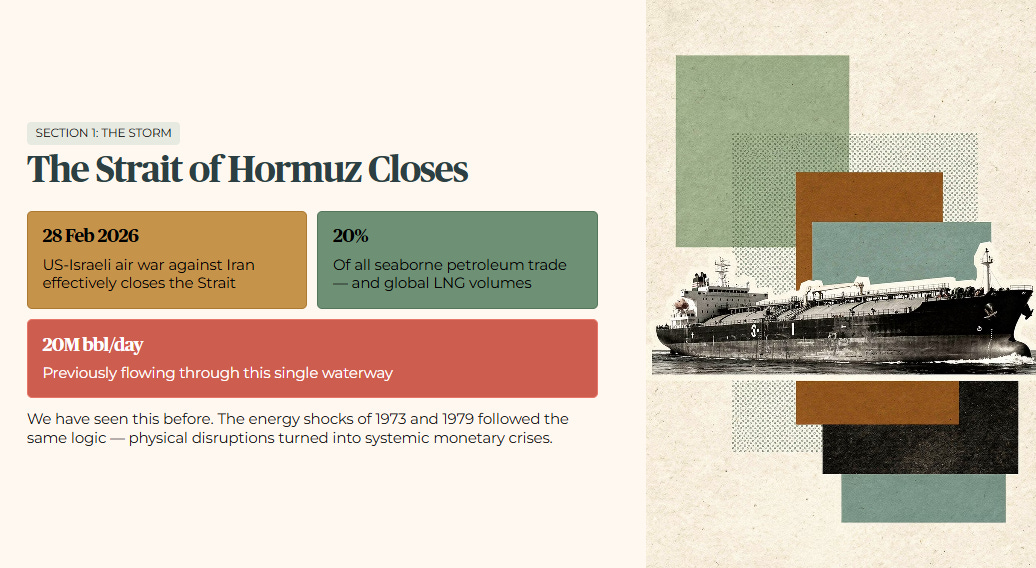
The supply destruction pattern that began at the geographic choke points of the Middle East has now reached Singapore. On 28 February 2026, the US-Israeli air war against Iran effectively closed the Strait of Hormuz. That single waterway previously carried about 20 million barrels of oil per day. It handles 20% of all seaborne petroleum trade in the world. It also handles 20% of global liquefied natural gas volumes.
We have seen this pattern before. The energy shocks of 1973 and 1979 followed the same logic. Physical supply disruptions quickly turned into systemic monetary crises. The current reality is no less severe.
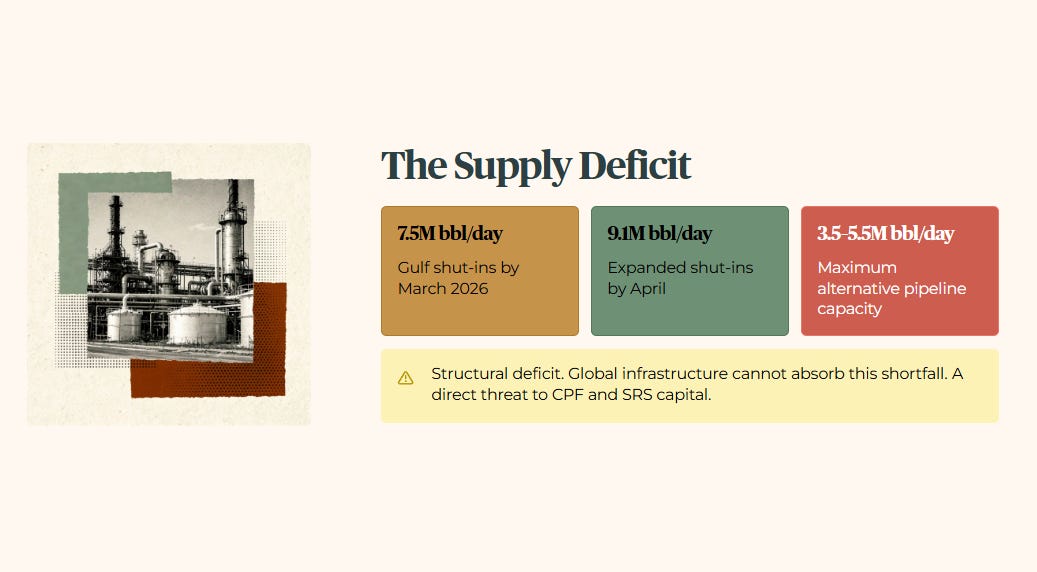
Combined Gulf production shut-ins across Saudi Arabia, Iraq, Kuwait, the UAE, Qatar, and Bahrain reached 7.5 million barrels per day in March 2026. By April, that number expanded to 9.1 million barrels per day. Alternative pipeline infrastructure across the region offers a maximum capacity of only 3.5 to 5.5 million barrels per day. That leaves a structural deficit. Global energy infrastructure cannot easily absorb this shortfall.
For a retail investor using CPF Special Account or SRS funds, this macro disruption is not a distant headline. It is a direct threat to your savings. It threatens capital preservation. It threatens long-term yield.
Brent crude oil averaged USD 103 per barrel throughout March 2026. The Energy Information Administration forecasts a cyclical peak of USD 115 per barrel in the second quarter of the year. This energy pressure has completely dismantled the consensus expectation for global interest rate cuts.
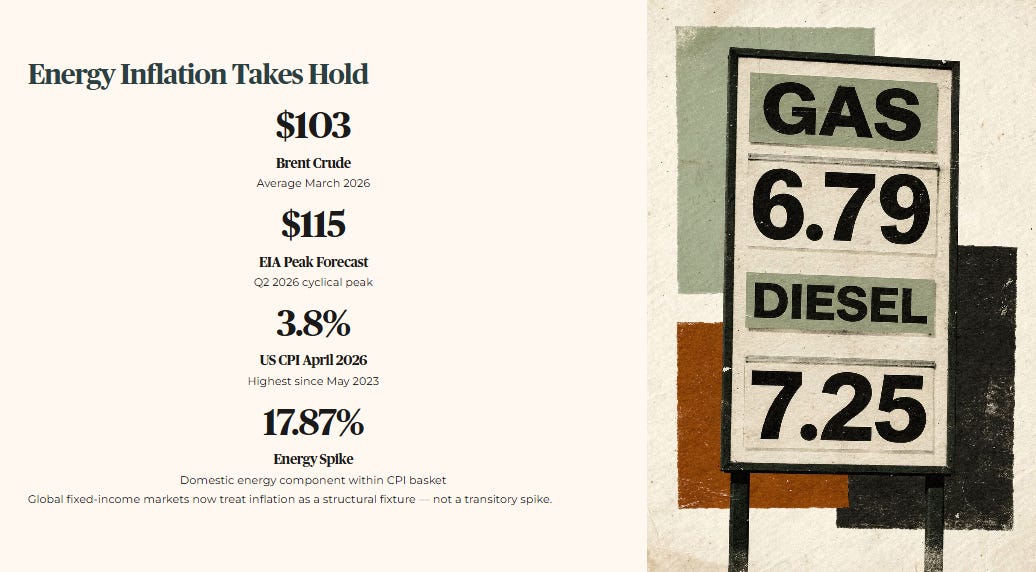
The United States Consumer Price Index for April 2026 accelerated to 3.8% year-on-year. That is the highest inflation reading since May 2023. Domestic energy components within that basket spiked 17.87%. Retail gasoline surpassed USD 4.00 per gallon. Diesel climbed past USD 5.80 per gallon. The global fixed-income market has responded by treating inflation as a structural fixture, not a transitory spike.
The forensic gap between public market narratives and true capital movement lies within the sovereign funding mechanisms of the Gulf nations. The consensus view assumes that asset-rich petrostates benefit uniformly from elevated crude prices. The underlying data reveals an entirely different friction point.
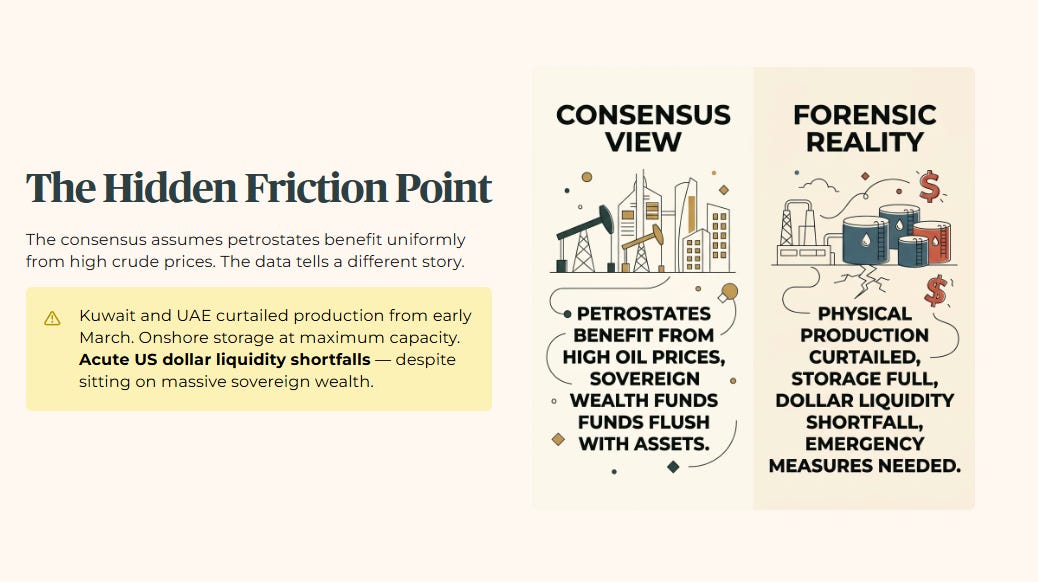
Kuwait and the United Arab Emirates were forced to curtail physical production from early March. Their onshore storage facilities reached maximum capacity. They began experiencing acute US dollar liquidity shortfalls. This happened despite sitting on massive sovereign wealth.
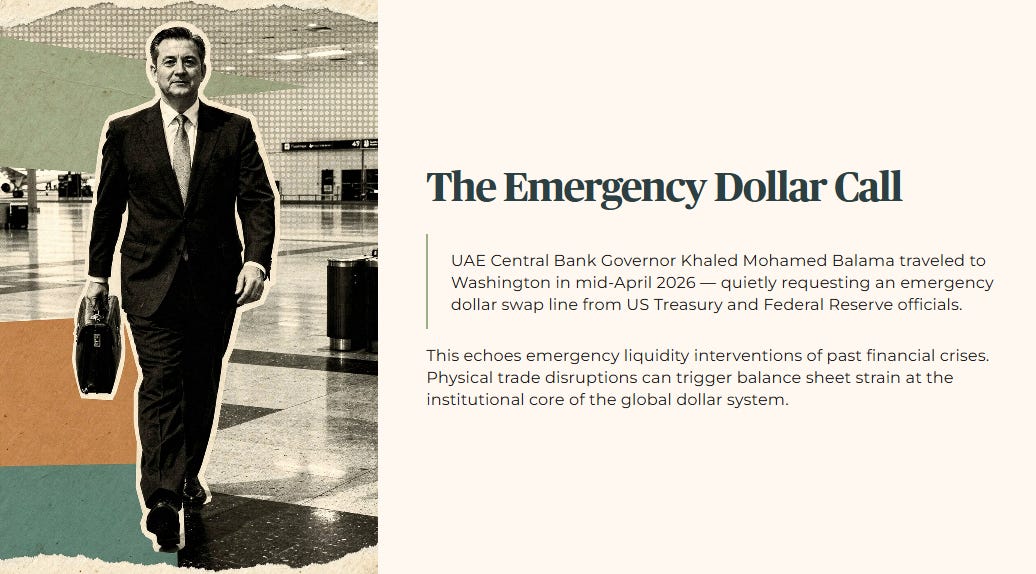
The investigation into this capital trail reveals that UAE Central Bank Governor Khaled Mohamed Balama traveled to Washington in mid-April 2026. He quietly requested an emergency dollar swap line from US Treasury Secretary Scott Bessent and Federal Reserve officials. This move echoes the emergency liquidity interventions of past financial crises. It exposes how quickly physical trade disruptions can trigger balance sheet strain at the institutional core of the global dollar system.
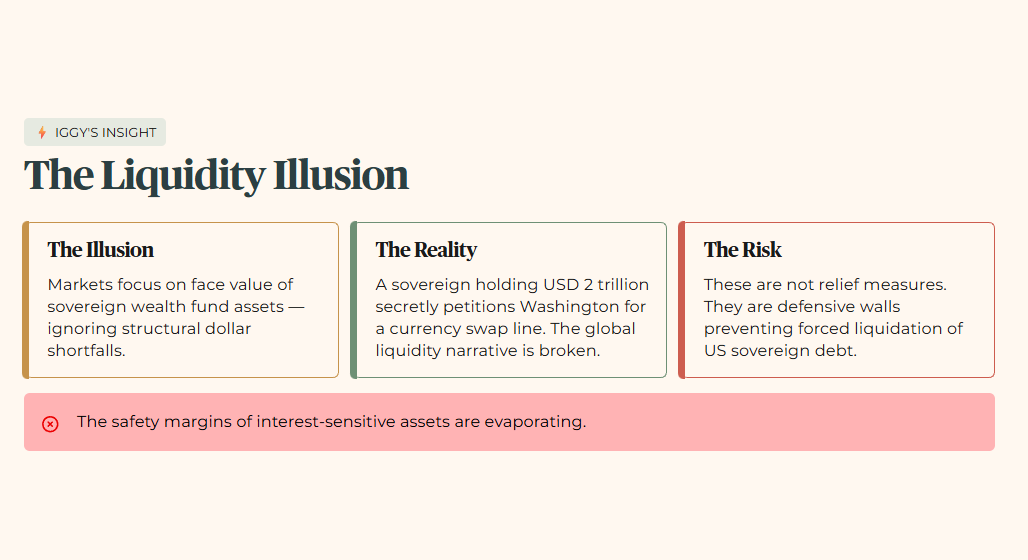
⚡ Iggy’s Insight: The Liquidity Illusion
Institutional market participants remain focused on the face value of sovereign wealth fund assets. They ignore the operational reality of structural dollar shortfalls. When a sovereign entity holding two trillion dollars across global funds must secretly petition Washington for an emergency currency swap line, the global liquidity narrative is broken. The wider market treats these interventions as regional relief measures. The raw data indicates they are defensive walls built to prevent a forced liquidation of US sovereign debt. This psychological disconnect creates a significant mispricing for retail yield seekers who assume global capital flows remain stable. The forensic reality is that the safety margins of interest-sensitive assets are evaporating.
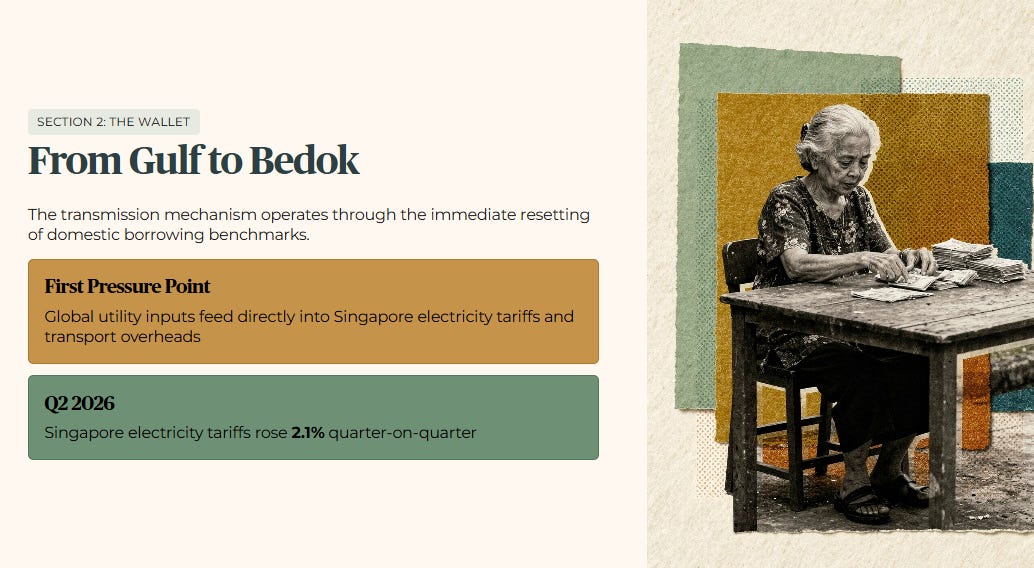
Section 2: The Local Impact (The Wallet)
The transmission mechanism from the Gulf dollar shortfall to a household balance sheet in Bedok or Toa Payoh operates through the immediate resetting of domestic borrowing benchmarks.
Retail energy costs provide the first visible pressure point. Global utility inputs feed directly into local electricity tariffs and transportation overheads. Singapore electricity tariffs rose 2.1% quarter-on-quarter in Q2 2026. A Singaporean household faces a direct increase in daily operational expenses as imported inflation filters through the supply chain.
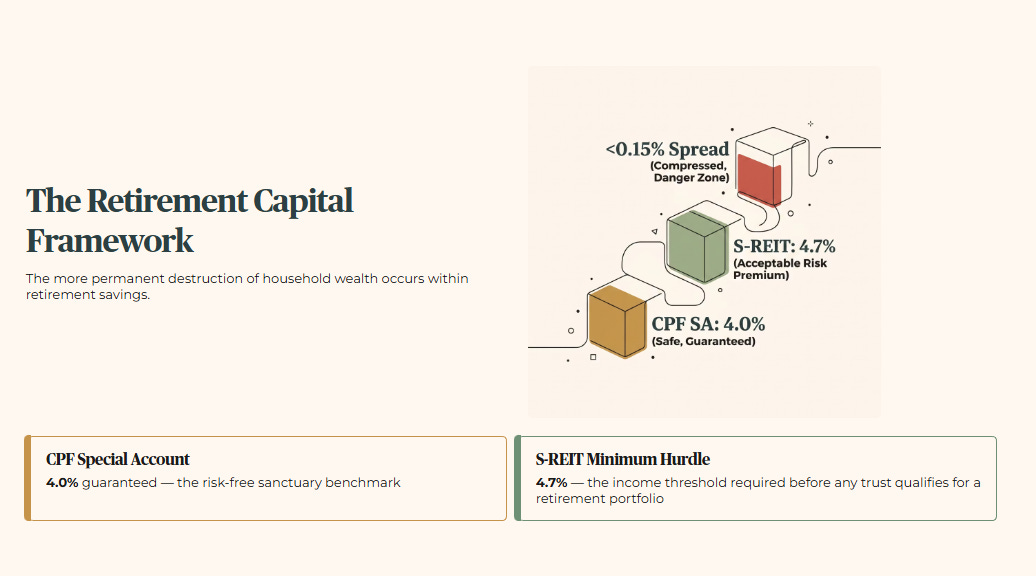
But the more permanent destruction of household wealth occurs within the retirement capital framework. The sudden upward repricing of global long-term yields fundamentally alters the opportunity cost of holding risk-exposed equities relative to guaranteed domestic benchmarks.
The baseline allocation architecture for local retirement savers relies heavily on the CPF Special Account interest rate. That rate serves as a 4.0% static sanctuary benchmark — the guaranteed return the government pays on your CPF Special Account savings, with no market risk attached. Under normal macro conditions, deploying surplus SRS funds or cash into Singapore Real Estate Investment Trusts (S-REITs) makes sense. The historical minimum yield hurdle for S-REITs is 4.7% — the income threshold I require before any trust qualifies for a retirement portfolio. That provides an acceptable risk premium for income-focused investors.
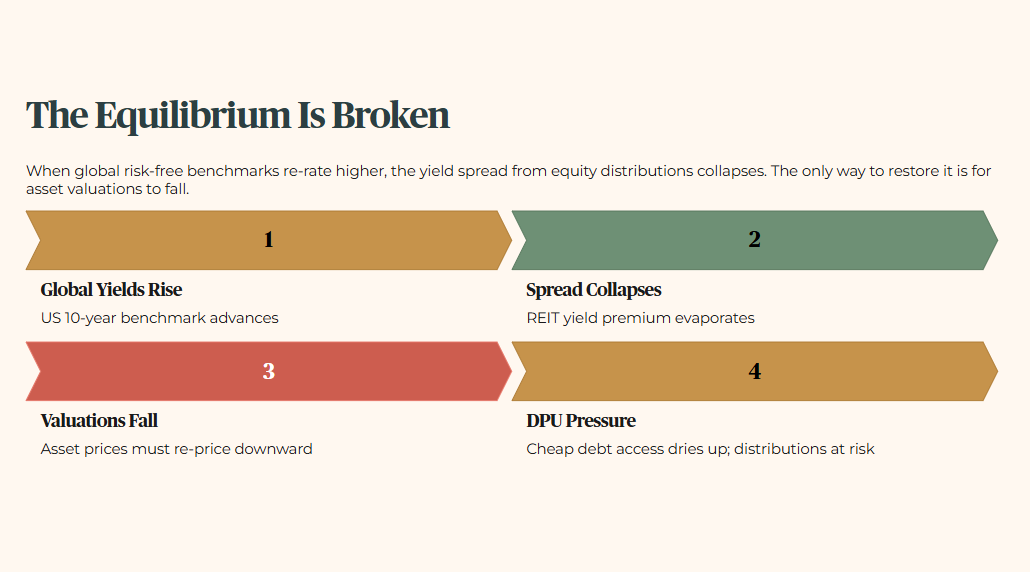
The current global yield surge has broken this equilibrium. When global risk-free benchmarks re-rate higher, the traditional yield spread provided by equity distributions collapses. The only way to restore it is for asset valuations to fall. This forces a strict reassessment of both the industrial property sector and the commercial office sector. Capital-intensive operations in these sectors face immediate refinancing friction.
The specific domestic equity sectors carrying the most direct wallet consequence for heartland portfolios are the highly geared S-REITs and the major industrial blue chips. These vehicles operate as asset-heavy structures. They rely on continuous access to cheap debt markets to maintain their distribution per unit (DPU) metrics — the income each unit of the trust pays out to investors each quarter.
As global commercial banks adjust their pricing models to reflect a higher-for-longer interest rate regime, the cost of servicing existing credit facilities rises upon maturity. This credit squeeze places immediate pressure on net property income (NPI) margins — the rental revenue left after deducting property operating expenses. The average retail investor often evaluates a trust based on historical distribution track records. They ignore the impending intersection with the corporate debt wall.
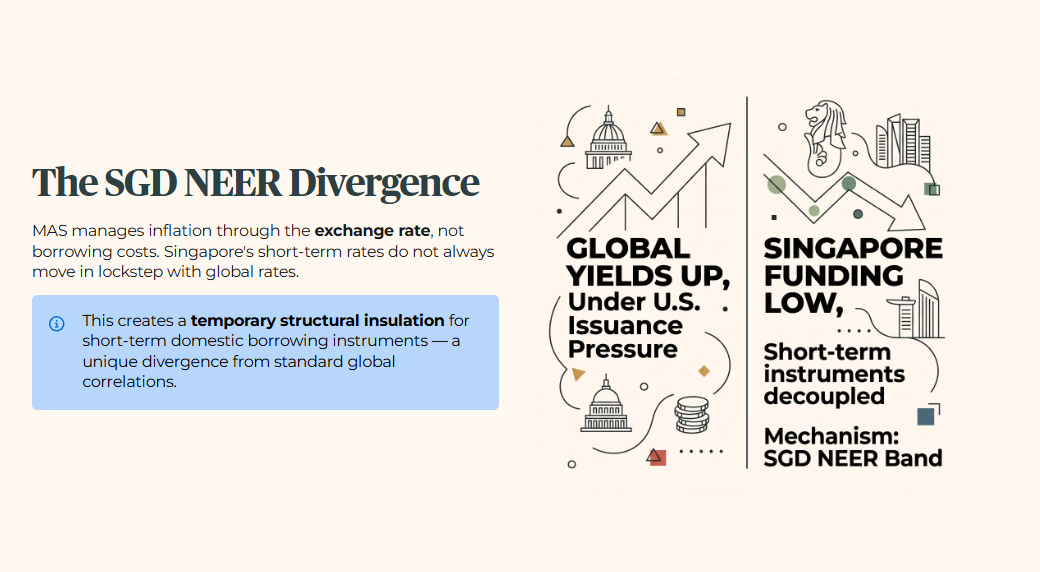
The hidden reality of this macro cycle is that the domestic monetary transmission mechanism provides a unique divergence from standard global correlations. Under the Singapore dollar Nominal Effective Exchange Rate framework (SGD NEER — the policy tool MAS uses to manage the Singapore dollar’s value against a basket of trading partner currencies, rather than setting interest rates directly), the Monetary Authority of Singapore manages liquidity through a currency band. This policy choice creates a temporary structural insulation for short-term domestic borrowing instruments. In plain terms: because MAS controls inflation through the exchange rate rather than through borrowing costs, Singapore’s short-term interest rates do not always move in lockstep with global rates.
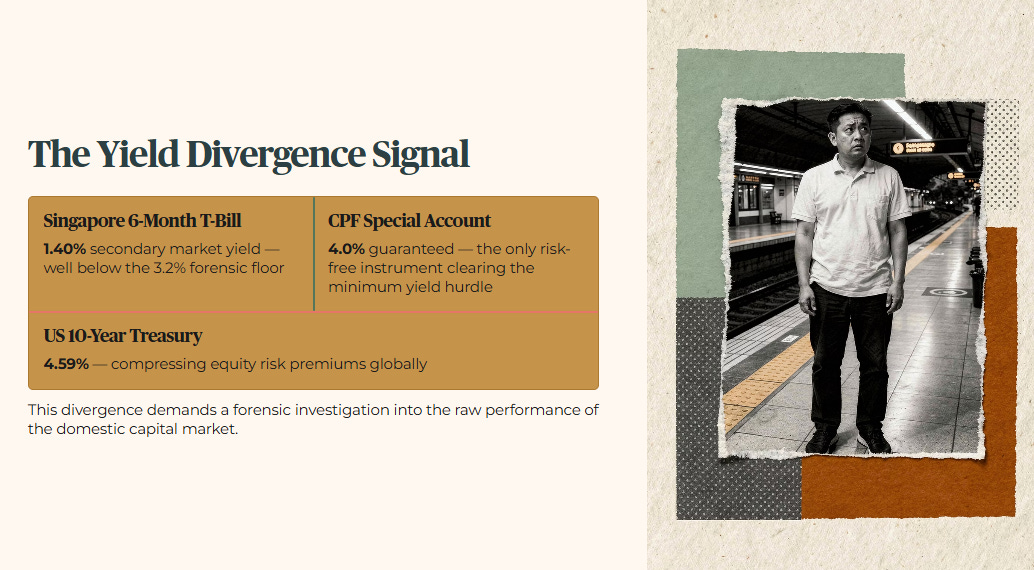
While long-term global yields climb under the weight of US sovereign issuance, local short-term funding instruments show a distinct decoupling. The six-month Singapore T-bill is currently yielding just 1.40% on the secondary market — well below the 3.2% forensic floor, and far below the 4.0% CPF Special Account sanctuary rate. This divergence demands an analytical investigation into the raw performance indicators of the domestic capital market.
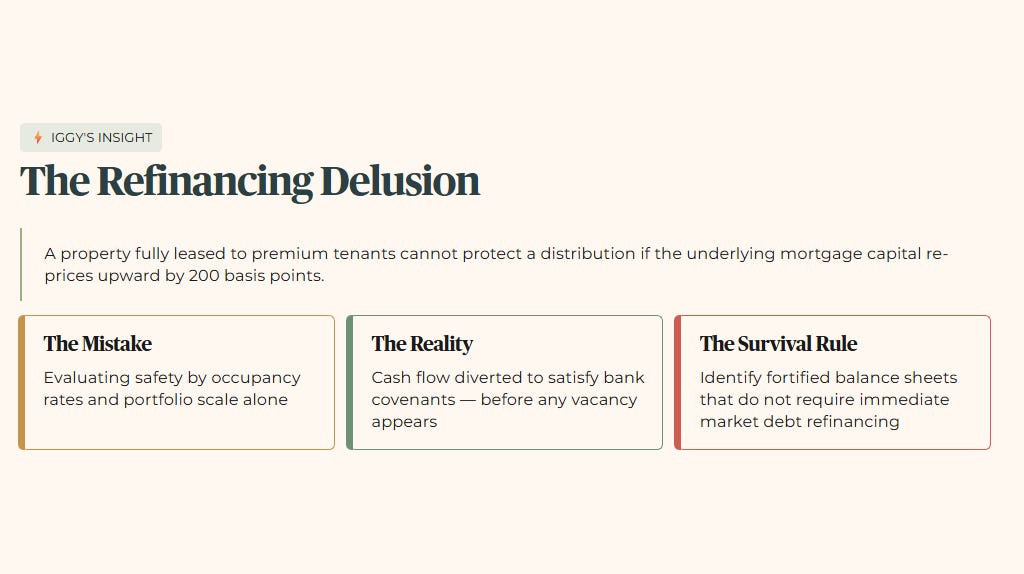
⚡ Iggy’s Insight: The Refinancing Delusion
Heartland retail investors frequently make the mistake of evaluating portfolio safety by looking exclusively at current occupancy rates and portfolio scale. They fail to understand that a property fully leased to premium tenants cannot protect a distribution if the underlying mortgage capital re-prices upward by two hundred basis points — meaning a 2% increase in the interest rate on the trust’s debt. The second-order effect of the current global treasury crunch is an inevitable contraction in equity distributions. Cash flow is diverted to satisfy bank covenants. Capital preservation under these conditions requires moving away from engineered yields — artificially inflated distributions propped up by one-off income rather than genuine rental growth. Survival depends on identifying fortified balance sheets that do not require immediate market debt refinancing.
Section 3: The Data Proof (The Evidence)
The international fixed-income market has completed a structural reassessment of sovereign risk premiums. It has established a higher operational floor for global capital costs.
Macro Evidence Dashboard
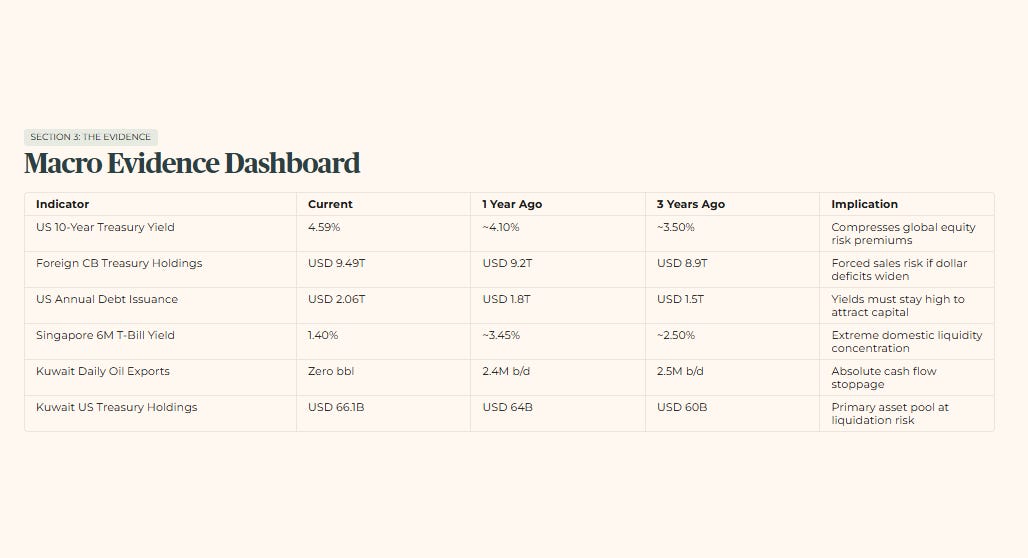
Represents the primary liquid asset pool vulnerable to liquidation during extended dollar shortfalls
The most critical data point within this entire macroeconomic matrix is the US 10-year Treasury yield, currently at 4.59%. This represents a significant move from the pre-crisis level of approximately 4.1%. The move is driven entirely by fixed-income markets adjusting for persistent global energy inflation.
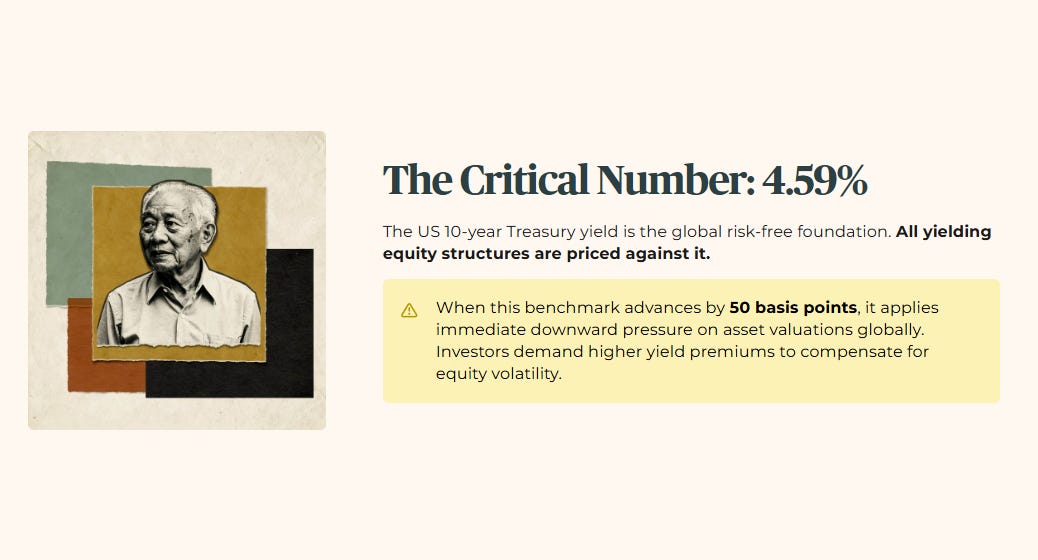
This international benchmark serves as the global risk-free foundation. All yielding equity structures are priced against it. When this benchmark advances by fifty basis points — half a percentage point — it applies immediate downward pressure on asset valuations globally. Investors demand a higher yield premium to compensate for equity volatility.
For a fifty-five-year-old retail investor living in a heartland community like Bedok, actively managing retirement assets through an SRS account, this specific indicator recalculates the entire math of portfolio survival.
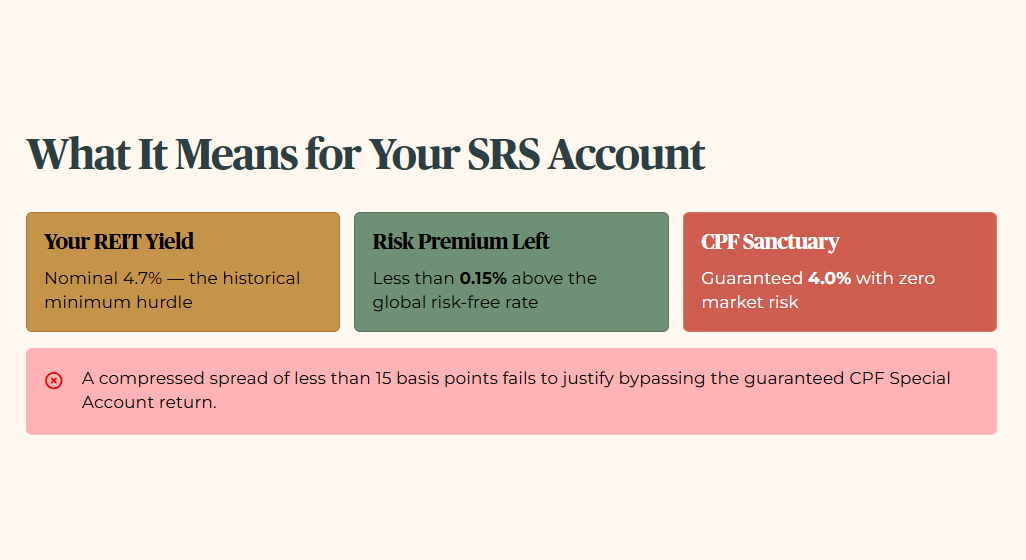
Here is what it means in plain terms. If you hold an interest-sensitive equity position that delivers a nominal dividend yield matching the historical 4.7% minimum hurdle, the true risk premium above the global risk-free rate has effectively compressed to less than fifteen basis points — less than 0.15%. That compressed spread fails to offer an adequate capital cushion to justify bypassing the guaranteed 4.0% sanctuary returns of the CPF Special Account.
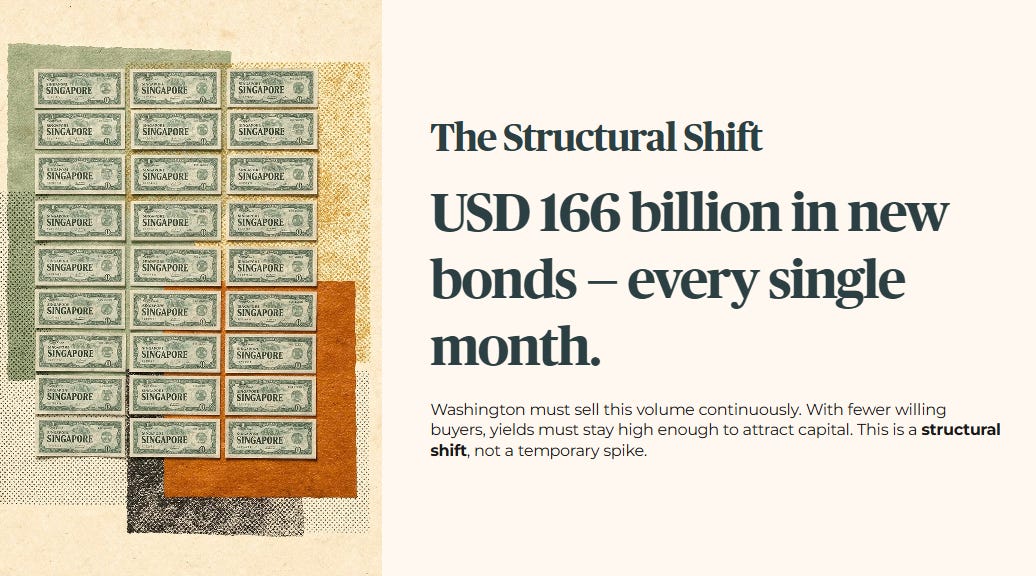
The structural expansion of global debt issuance means Washington needs to sell over USD 166 billion in new bonds every single month. Someone has to buy all of that. With the list of willing buyers getting shorter, yields have to stay high enough to attract the capital. This confirms that the yield elevation is a structural shift, not a temporary spike.
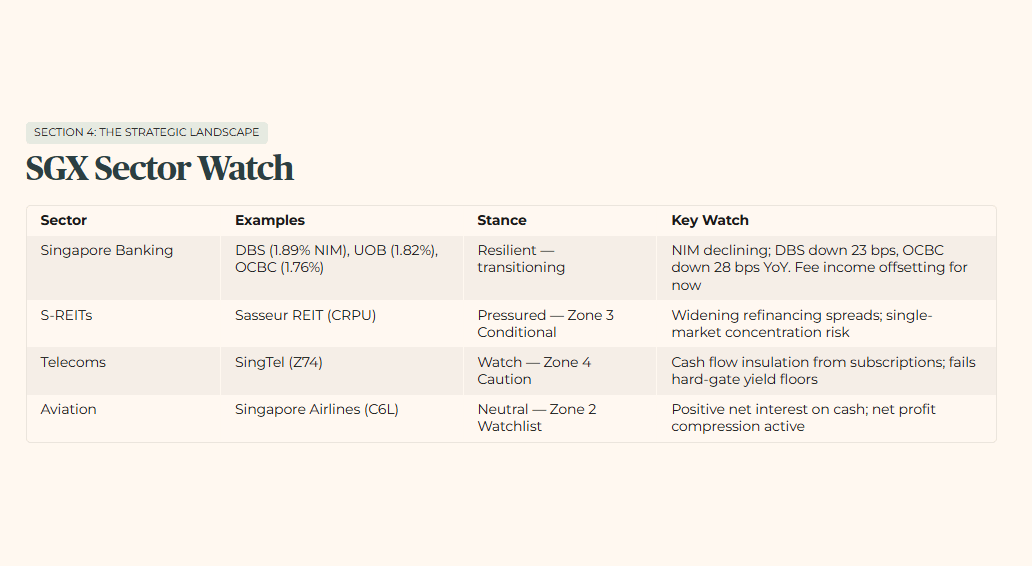
Section 4: The Strategic Landscape (Scenario Matrix and SGX Sector Watch)
The domestic equity market exhibits a sharp division. Banking institutions are holding earnings through fee income rather than margin expansion. Leveraged property vehicles face international refinancing volatility.
SGX Sector Watch
The global liquidity transmission mechanism is highly sensitive to the duration of the maritime trade blockade. Different outcomes create distinct structural consequences across the macroeconomic landscape.
Macro Scenario Matrix
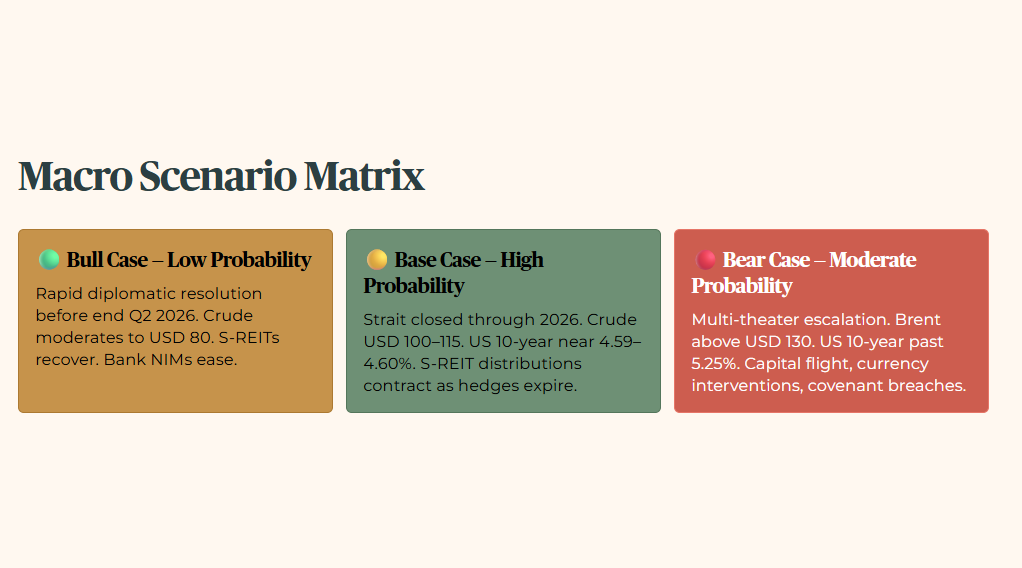
Structural capital flight from emerging markets, forcing localized currency interventions and triggering covenant breaches across leveraged sectors
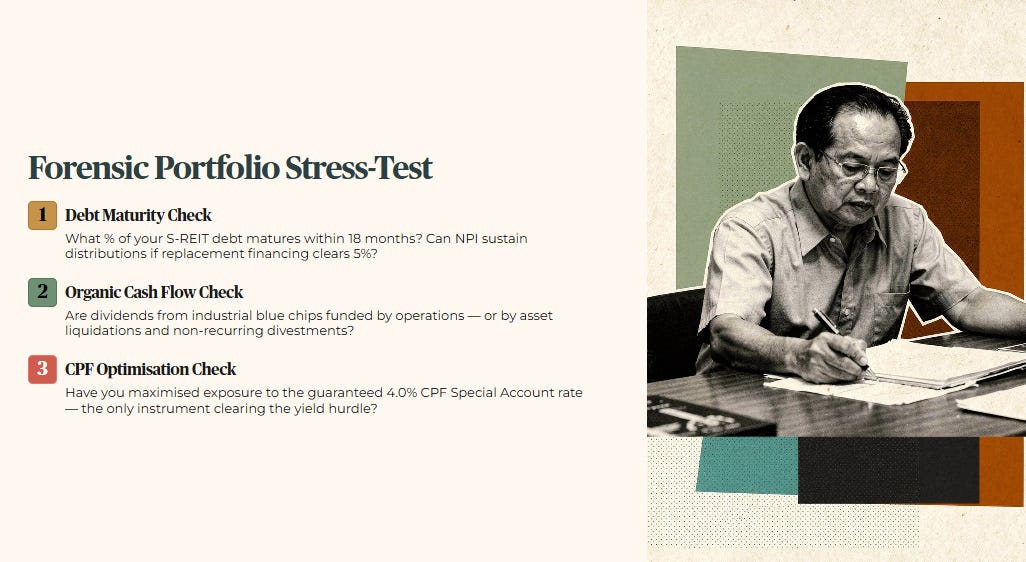
Forensic Portfolio Stress-Test Questions
Ask yourself these three questions.
First: What percentage of your current S-REIT portfolio debt matures within the next eighteen months? If the replacement financing rate clears five percent, can the underlying net property income sustain distributions?
Second: Does your portfolio exposure to major domestic industrial blue chips rely on organic operational cash flow? Or are current dividends being funded through asset liquidations and non-recurring divestments?
Third: The Singapore six-month T-bill is currently yielding 1.40% on the secondary market — well below the 3.2% forensic floor. Have you reallocated surplus cash assets to maximise exposure to the guaranteed 4.0% CPF Special Account sanctuary rate, which remains the only risk-free instrument currently clearing the minimum yield hurdle?
Section 5: The Singapore Investor Playbook (Shock Absorption and Retirement Impact)
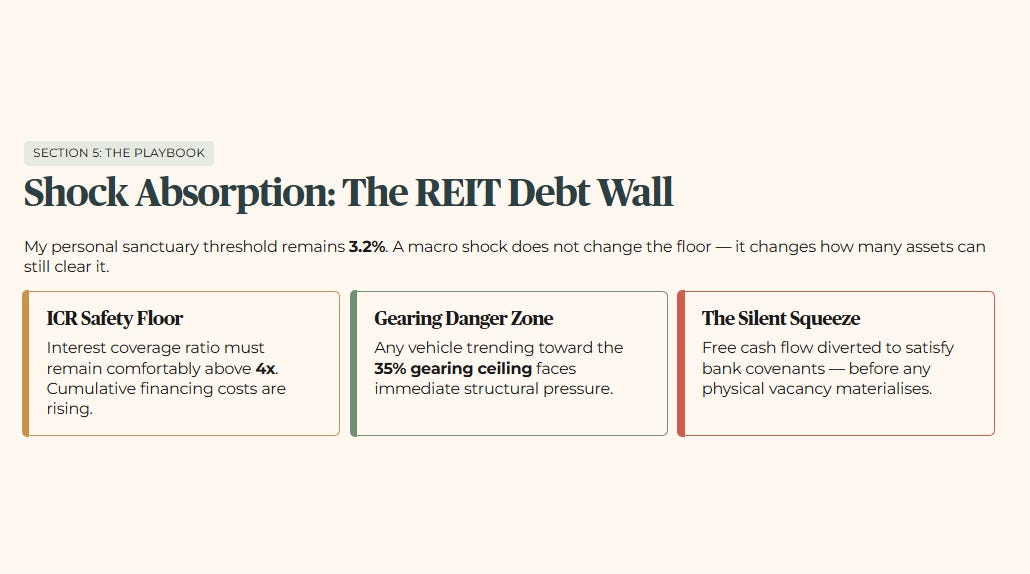
My personal sanctuary threshold remains 3.2%. A sustained macro shock does not change the floor. It changes how many assets can still clear it.
The evaluation of an income portfolio during an international credit crunch must focus entirely on balance sheet duration and structural insulation from foreign capital markets.
Part A — Shock Absorption
The analytical audit of the domestic real estate investment trust sector indicates that debt-servicing capability is entering a period of structural divergence. For vehicles positioned within the retail and commercial space, direct exposure to international capital markets introduces an immediate refinancing risk as interest rate hedges expire.
The average sector buffer headroom is trending lower. Historically, it relied on an interest coverage ratio (ICR) — the measure of whether a trust’s income can comfortably cover its debt repayments — comfortably above four times. Cumulative financing costs are increasing.
The shock threshold for highly geared vehicles arrives when total interest expenses expand to a level that compromises bank debt covenants. Any vehicle carrying a gearing ratio — the proportion of its assets funded by debt — trending toward the 35% ceiling faces immediate structural pressure.
This pressure manifests as an automatic requirement to divert free cash flow away from shareholder distributions to satisfy capital preservation mandates. This happens long before physical vacancies materialise.
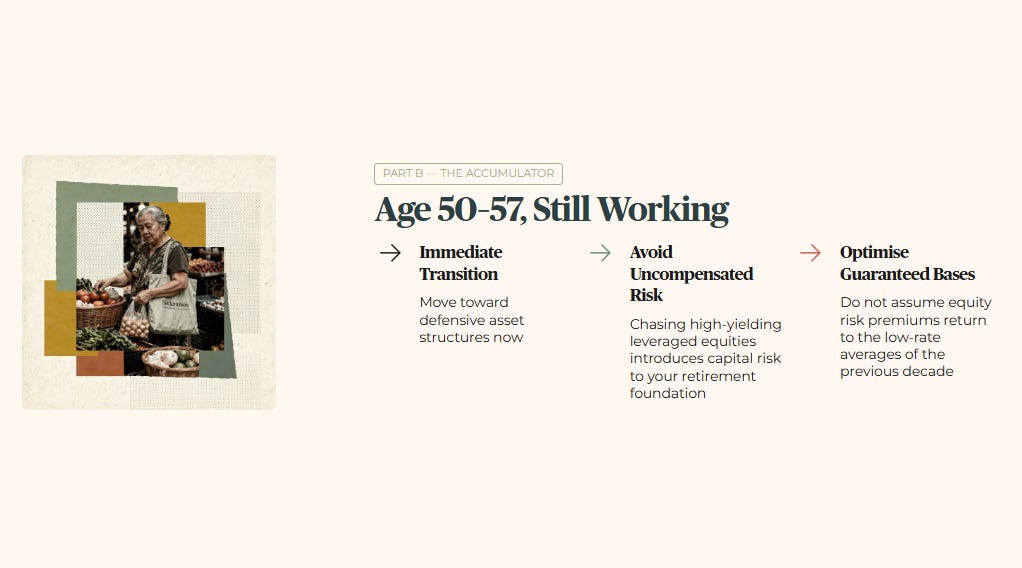
Part B — The Accumulator (Aged 50–57, Still Working)
If you are still drawing a salary and building your portfolio within a heartland employment framework, the current macroeconomic configuration demands an immediate transition toward defensive asset structures.
The forensic picture suggests that chasing nominal high-yielding equities that carry significant leverage introduces an uncompensated capital risk to your retirement foundation. You should monitor whether your monthly cash deployments are ignoring the structural safety of the domestic risk-free framework.
With global interest rates remaining structurally elevated to absorb massive sovereign debt issuance, the priority for an accumulator must be the optimisation of guaranteed capital bases. Make sure your accumulation strategy does not rely on the assumption that equity risk premiums will return to the low-interest-rate averages of the previous decade.
Part C — The Drawdown Investor (Aged 58–65, Retired or Semi-Retired)
If you are already drawing down your SRS or living partly off distributions to meet daily living costs in a heartland neighbourhood like Punggol, cash flow stability takes absolute priority over speculative capital growth.
The forensic picture indicates that relying on engineered yields or trusts that feature consistent declines in net asset value (NAV) — the underlying worth of each unit you hold — exposes your retirement capital to permanent impairment. Monitor whether your active income streams are adequately insulated from the corporate debt wall facing leveraged structures.
For an investor in the drawdown phase, capital preservation during a global treasury crunch requires a strict re-allocation toward assets that maintain interest coverage ratios well above the 4x safety floor. Any failure to audit these credit metrics increases the risk of experiencing a sudden, unannounced distribution cut precisely when household inflation is rising.
The gearing analysis above sets the minimum capital filter — but the debt maturity calendar in the final section determines which trusts face forced distribution cuts within the next six quarters.
