



Bank Valuation 101
Most retail investors look at a bank stock and immediately reach for P/B (price-to-book value, the market price divided by the net asset value per share) or P/E ratios because that is what the standard corporate playbook teaches. If you are building an income portfolio for retirement drawdown, relying on those generic metrics is a structural trap. By the time a broken balance sheet shows up in a compressed book value, your capital has already evaporated.

If you are chasing momentum and short-term capital gains, standard corporate multiples might clear your hurdle. But if you are a retiree focused on wealth preservation and dependable drawdown income, my forensic standard uses a completely different lens.

Let’s look at why the standard playbook breaks for banks, and the four capital-safety metrics that actually matter for your cash.

Why the Standard Playbook Breaks for Banks
The Four Metrics That Actually Matter
The Banking Capital Gate Framework
Iggy’s Insight
Live Case Audit: OCBC (O39)
Financial Health Checklist
Iggy’s Insight
Your Bank Valuation Starter Kit
Iggy’s Insight
The Bottom Line

Why the Standard Playbook Breaks for Banks
When you buy shares in a property developer or a retail company, you can look at gearing (the ratio of total debt to total assets) to see how heavily leveraged the business is. But on a bank’s financial statement, standard debt ratios literally do not exist in the same format.
A bank’s primary assets are its loans, the mortgages and corporate credit lines it hands out. Its primary liabilities are your deposits, the cash sitting in your savings account. If you treat customer deposits as raw debt, every bank on the Singapore Exchange would look hopelessly insolvent.
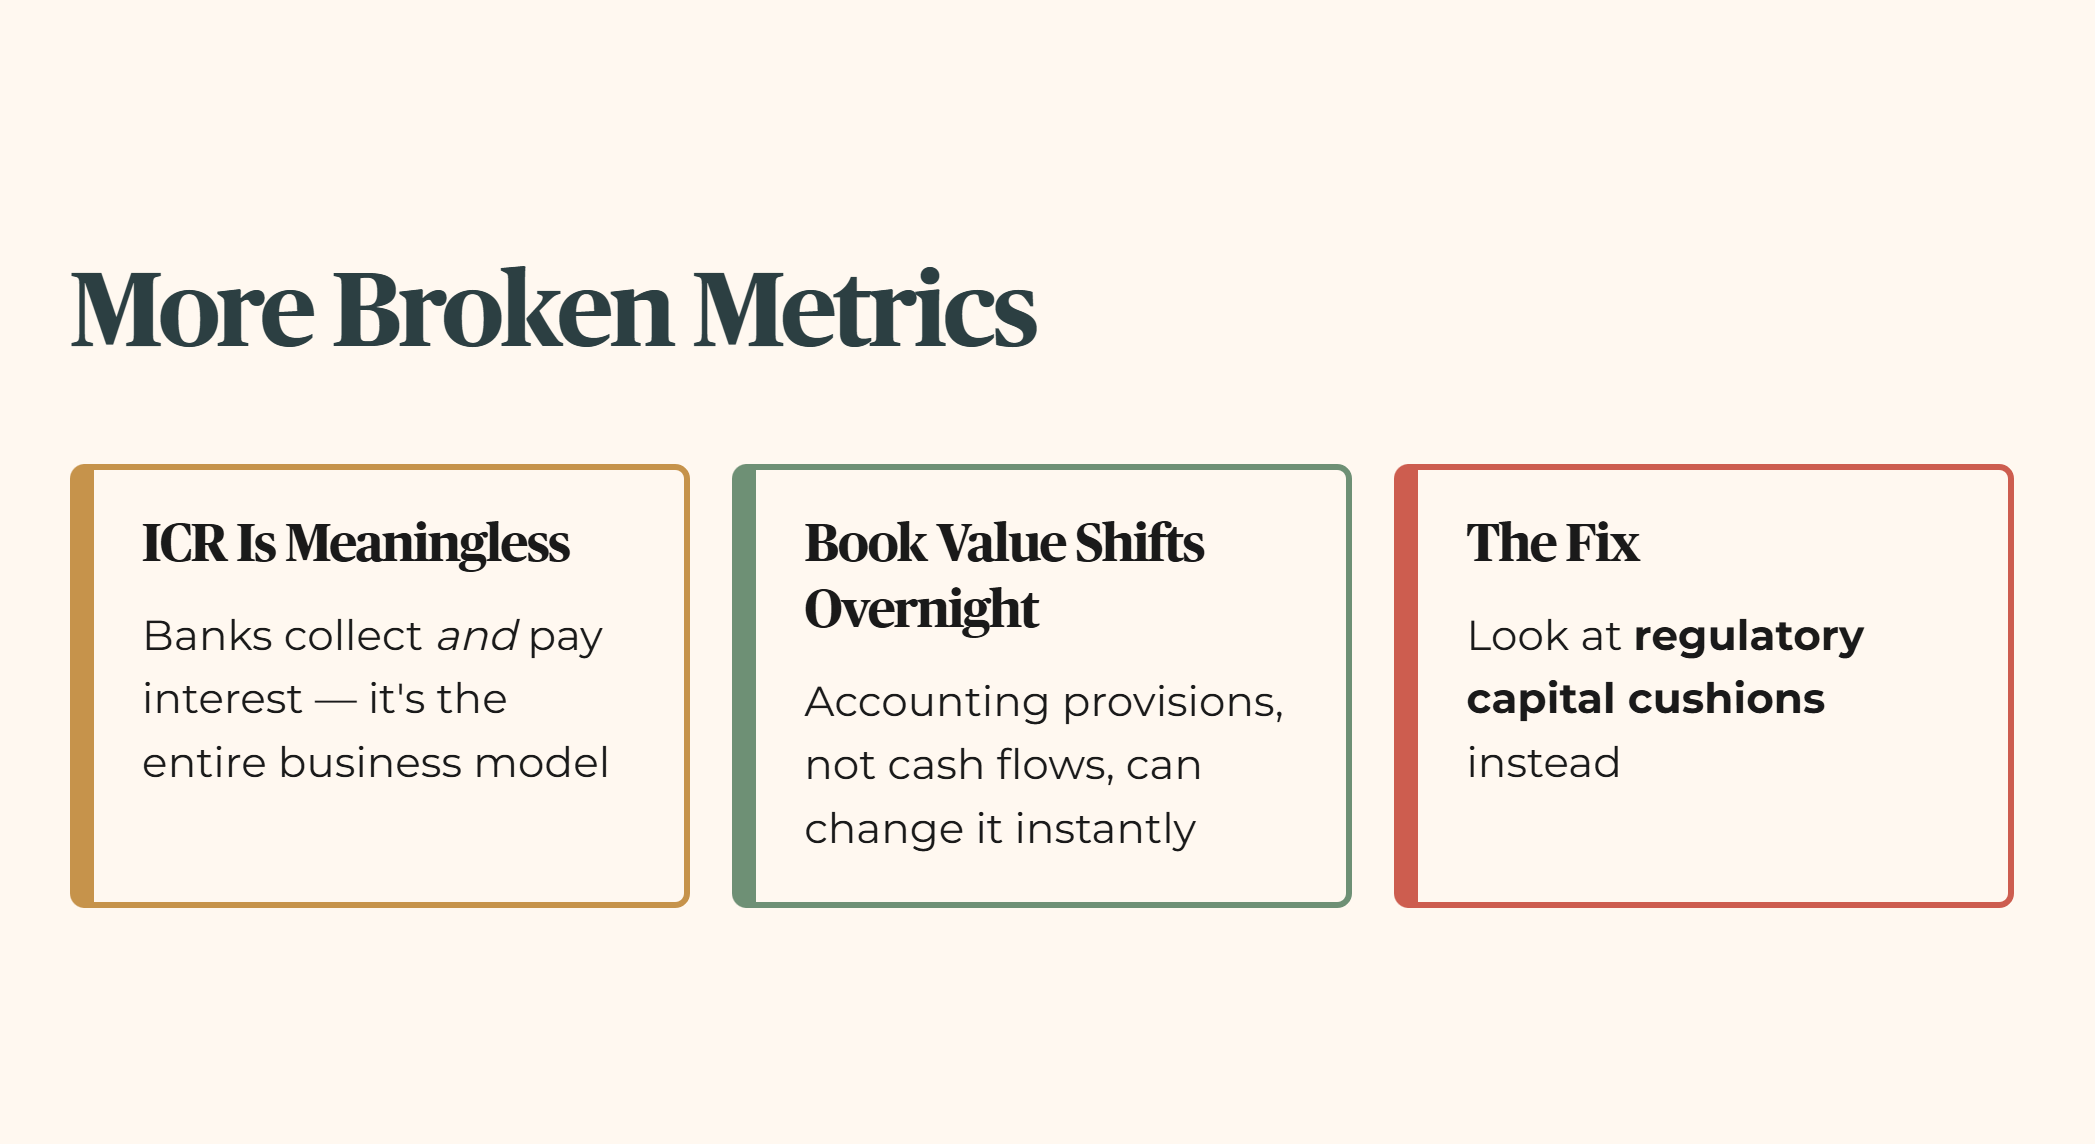
Similarly, the ICR (interest coverage ratio, how many times operating profit can cover its interest costs) is meaningless here. A bank’s entire business model is based on collecting interest from borrowers and paying out interest to savers. Because banking assets are financial contracts rather than physical factories, book value can change overnight based on accounting provisions rather than actual cash flows. To protect a retirement portfolio, you must throw out the standard industrial playbook and look at regulatory capital cushions instead.
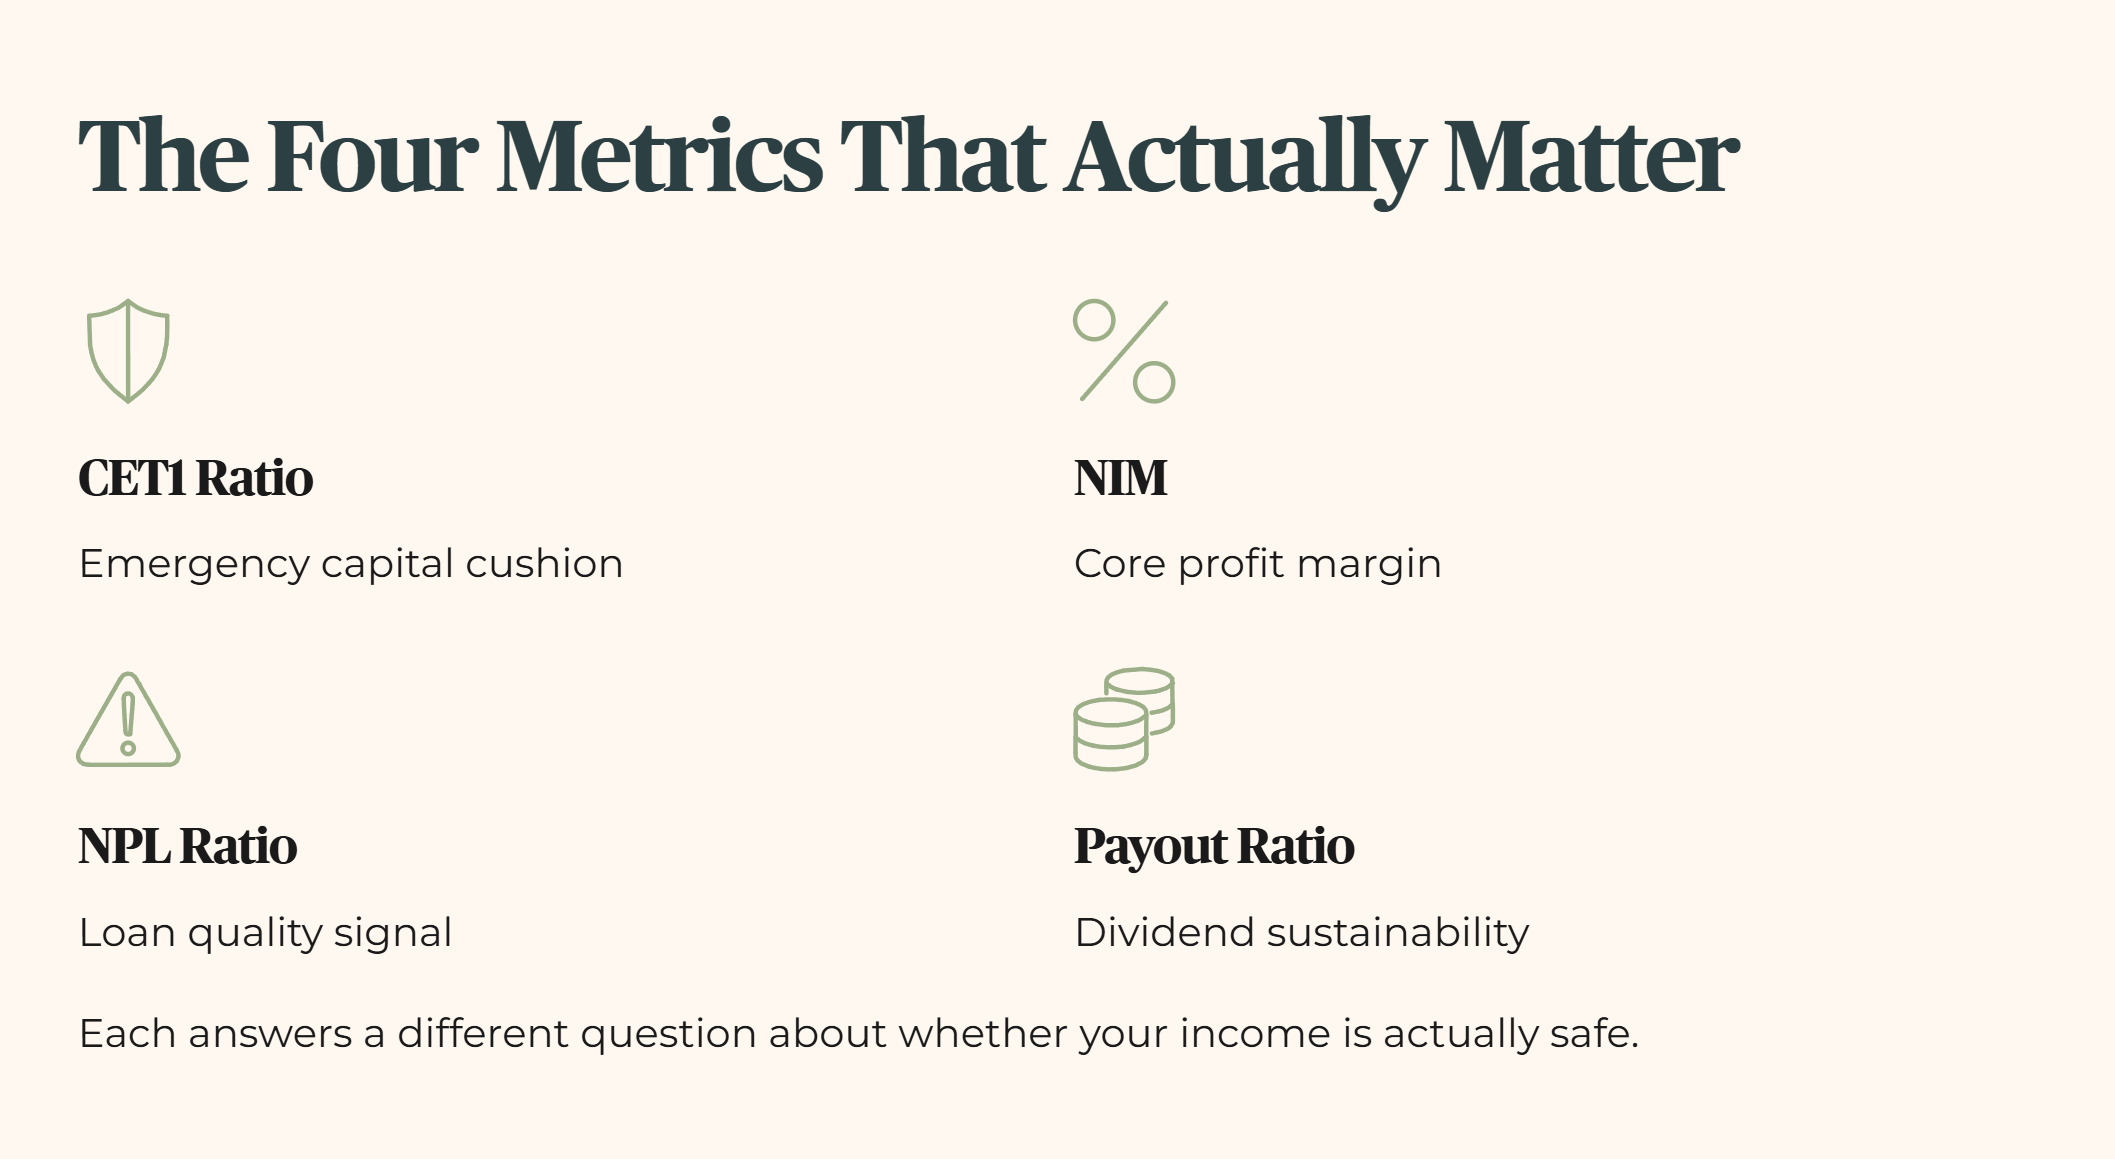
The Four Metrics That Actually Matter
To evaluate a bank safely, throw out the industrial playbook entirely and track four specialized metrics instead. Each one answers a different question about whether your income is actually safe, and each requires a specific plain-language translation before the number means anything to you.

Transitional CET1 (Common Equity Tier 1 ratio): This measures the proportion of a bank’s risk-weighted assets funded by the highest-quality capital, mainly ordinary shareholders’ equity. Think of it as the ultimate emergency cash cushion, the money a bank has set aside that isn’t borrowed, isn’t owed to depositors, and exists purely to absorb losses before anyone else’s money is at risk.
The Monetary Authority of Singapore requires local banks to maintain a minimum transitional CET1 of 9%.
My standard sets a far stricter bar at 16%, roughly seventy-five percent above the regulatory floor, because a number that just clears the legal minimum tells you the bank is compliant, not that it’s built to withstand a genuine shock. When CET1 is comfortably above 16%, a bad quarter, a spike in bad loans, a sudden market shock, gets absorbed by that cushion instead of forcing the bank to cut what it pays you.
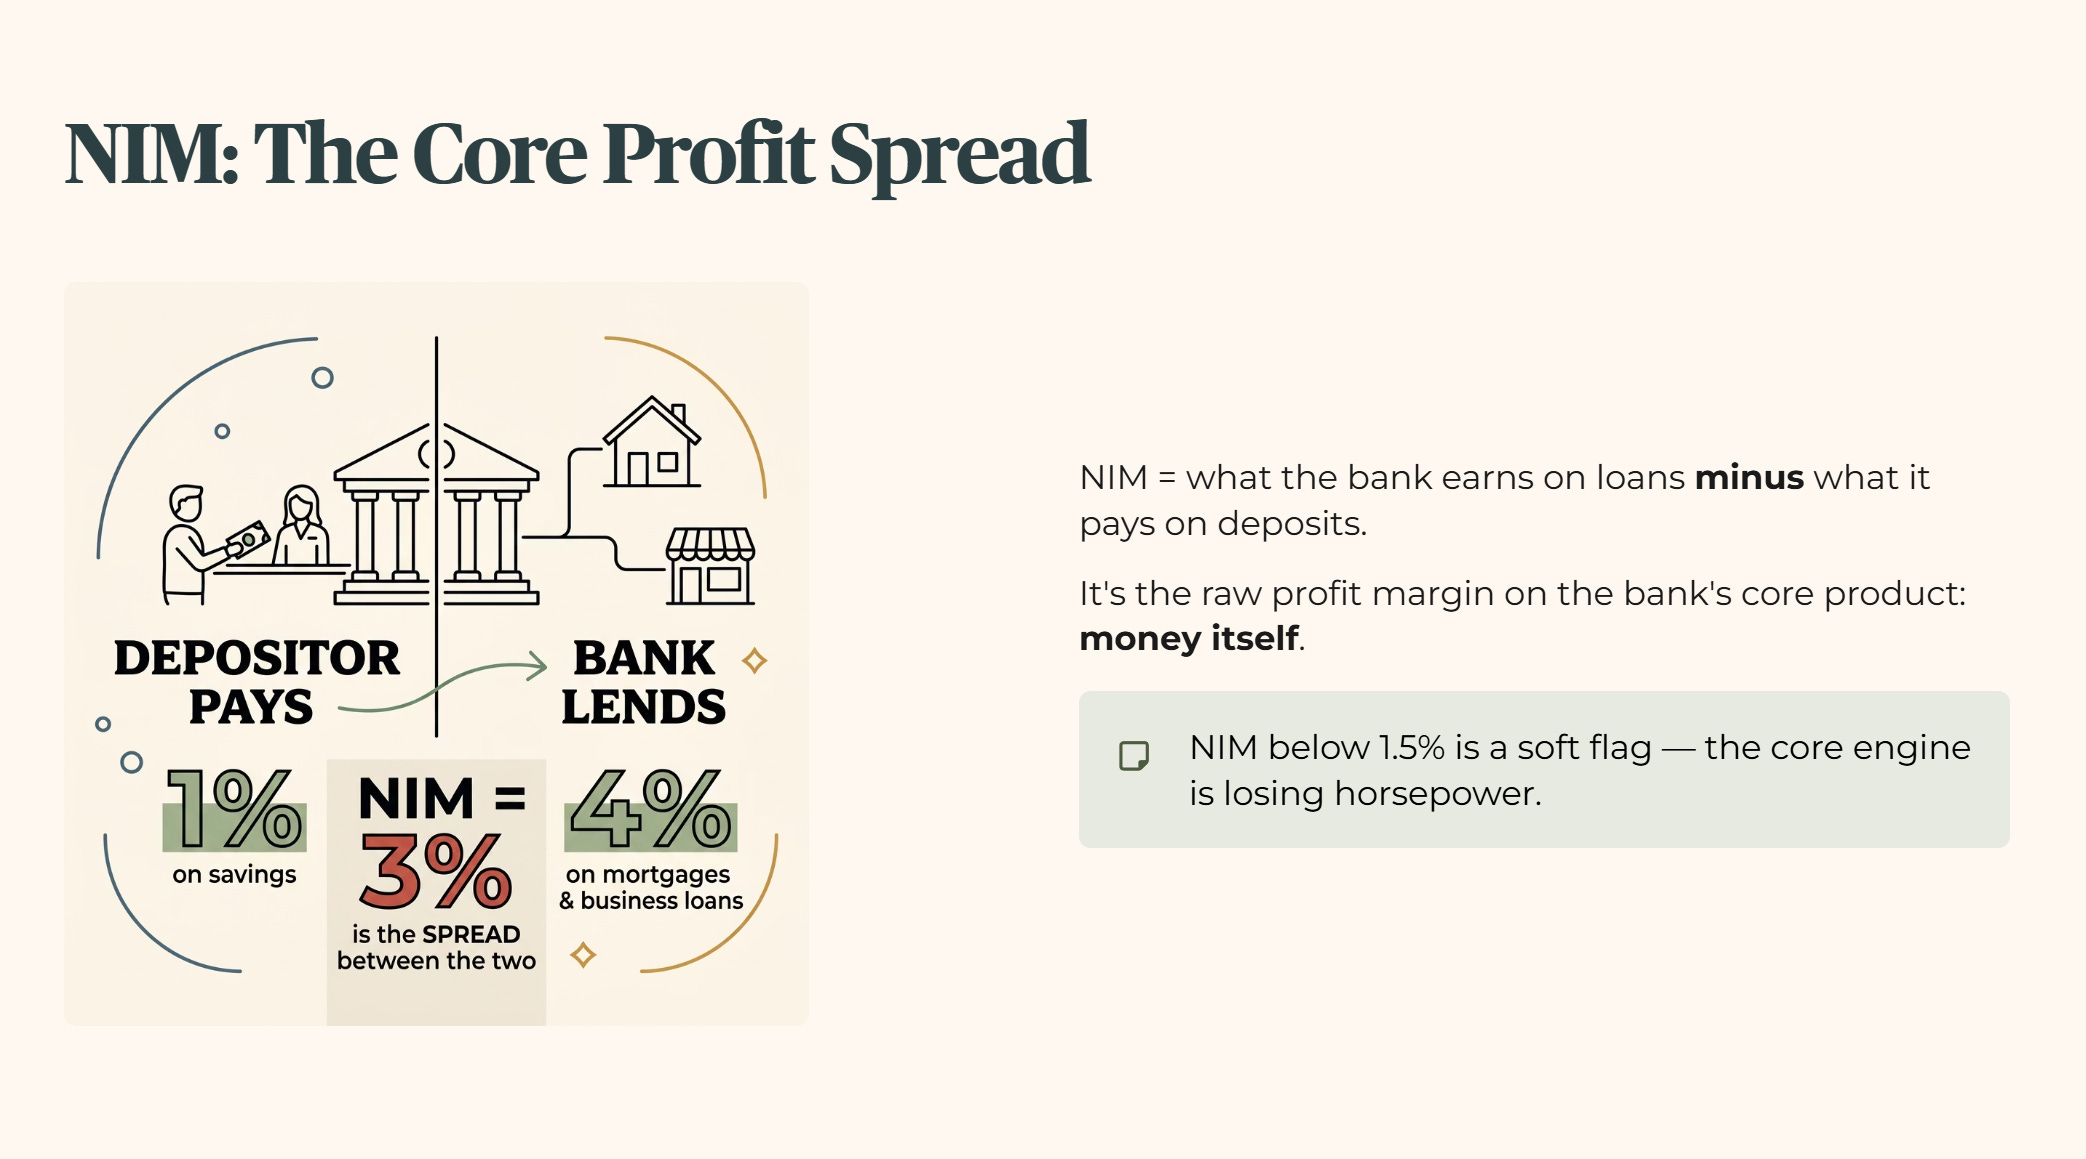
NIM (Net Interest Margin): The difference between what a bank earns on its loans and what it pays out on deposits, expressed as a percentage of its interest-earning assets. In plain terms, this is the raw profit margin on the bank’s core product: money. A bank borrows from you at a low rate through your savings account, then lends that same money out at a higher rate through mortgages and business loans, and NIM tells you how wide that spread actually is.

When interest rates fall or competition for deposits heats up, NIM compresses, meaning the bank makes less profit on every dollar it handles, even if the total amount of lending stays exactly the same. That’s why NIM below 1.5% is a soft flag on my framework, it’s an early warning that the bank’s core engine is losing horsepower, well before it shows up in a headline profit number.
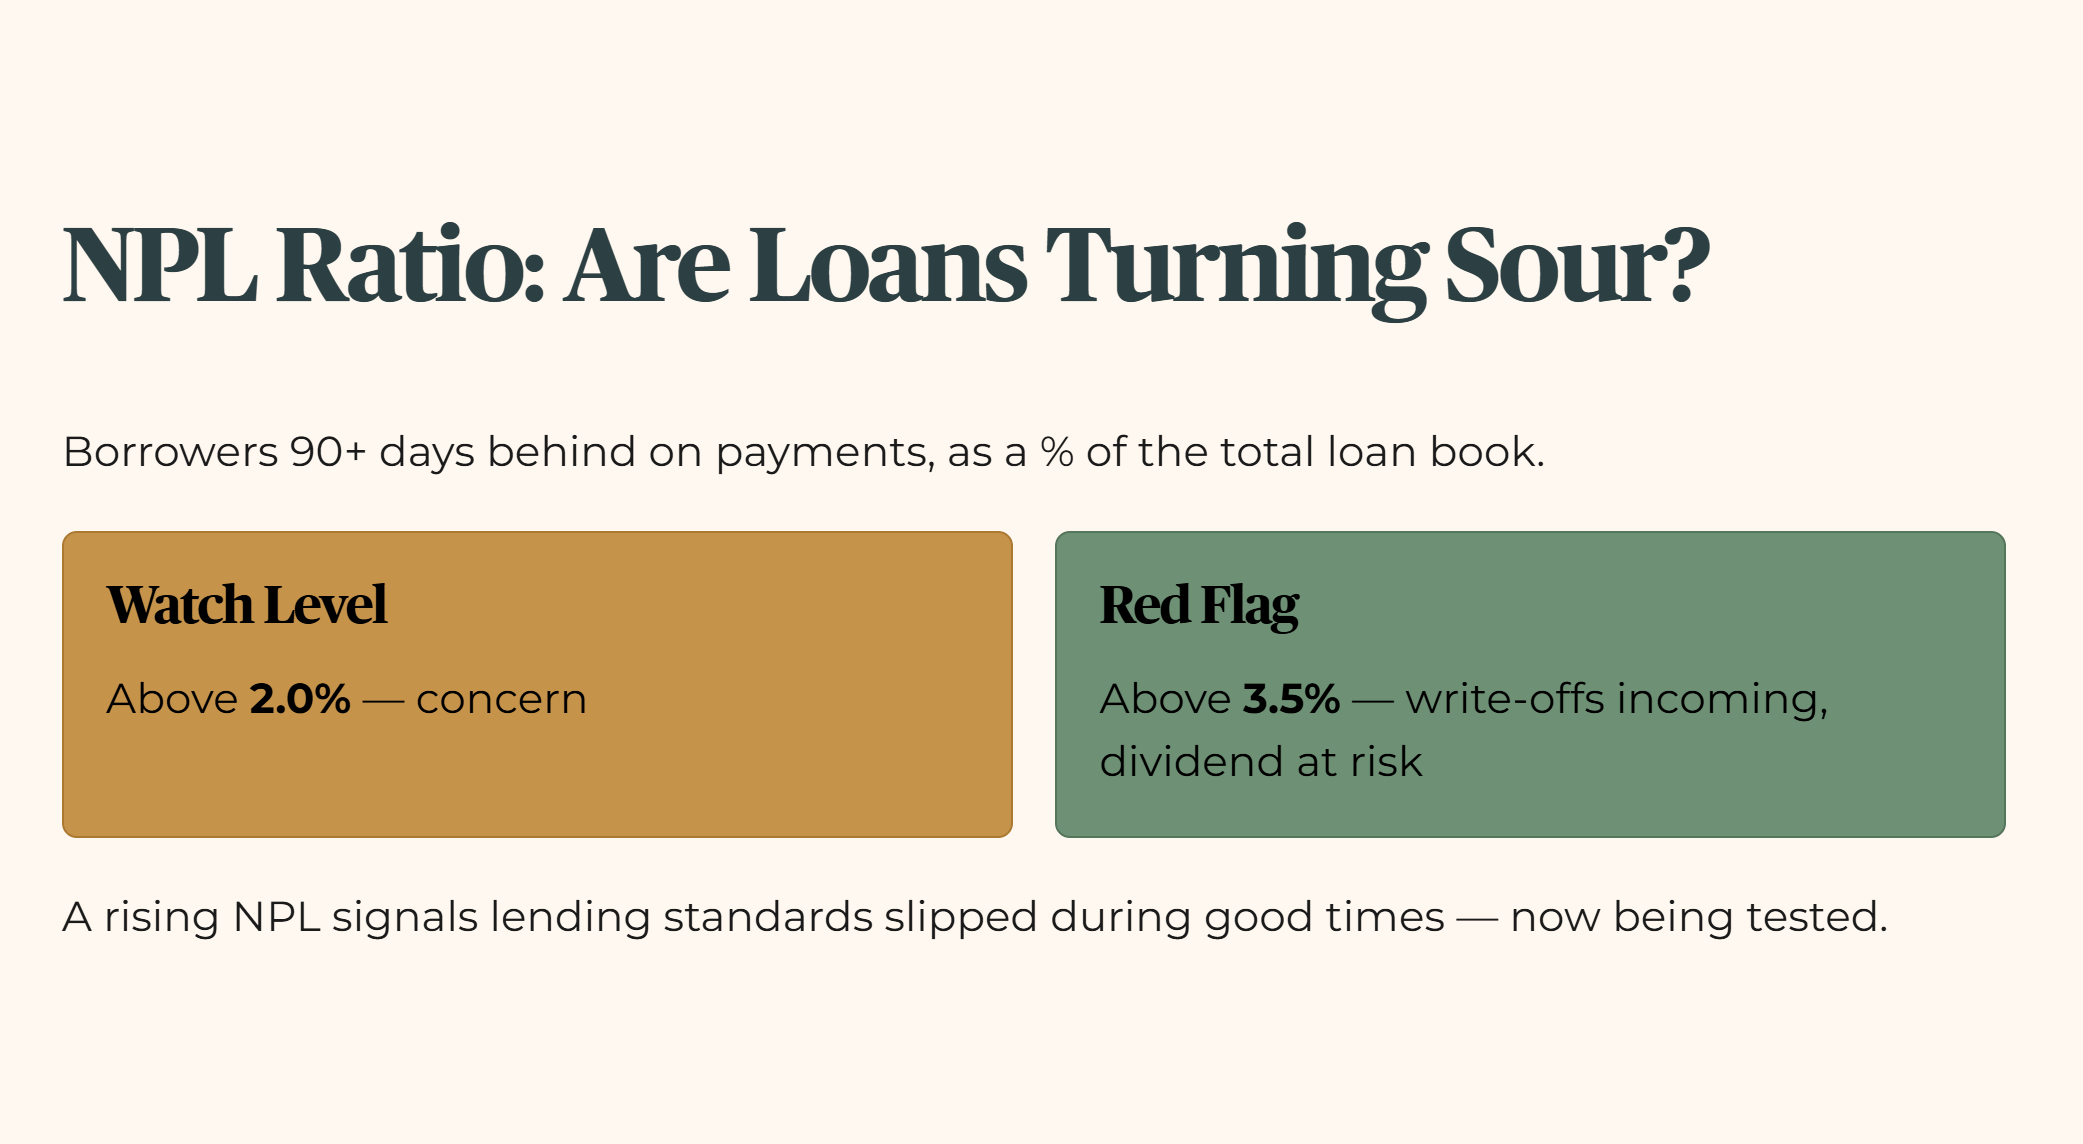
NPL ratio (Non-Performing Loan ratio): The proportion of the bank’s total loan book where borrowers are behind on their payments by 90 days or more. This tells you what percentage of the bank’s loans are turning sour, money that was lent out and isn’t reliably coming back. A rising NPL ratio is one of the clearest early signals that a bank’s lending standards slipped during good times and are now being tested by a tougher environment, whether that’s rising interest rates squeezing borrowers or a slowing economy hitting business revenues.
My threshold flags anything above 2.0% as a concern, and anything above 3.5% as a serious red flag, since that level typically means write-offs are coming, and write-offs eat directly into the profit that would otherwise fund your dividend.

Payout ratio: The percentage of net profit the bank pays out to shareholders as dividends. This sounds like the simplest of the four metrics, but it’s arguably the most important one for anyone relying on bank dividends for income. A payout ratio that sits too high, sustained above 70% for multiple periods, means the bank is emptying its cash reserves to keep the dividend looking attractive, rather than retaining enough capital to backstop future bad loans or absorb a downturn. Think of it like a household spending its entire monthly income with nothing left over for emergencies, it works fine until something goes wrong, and then there’s no buffer left to fall back on.
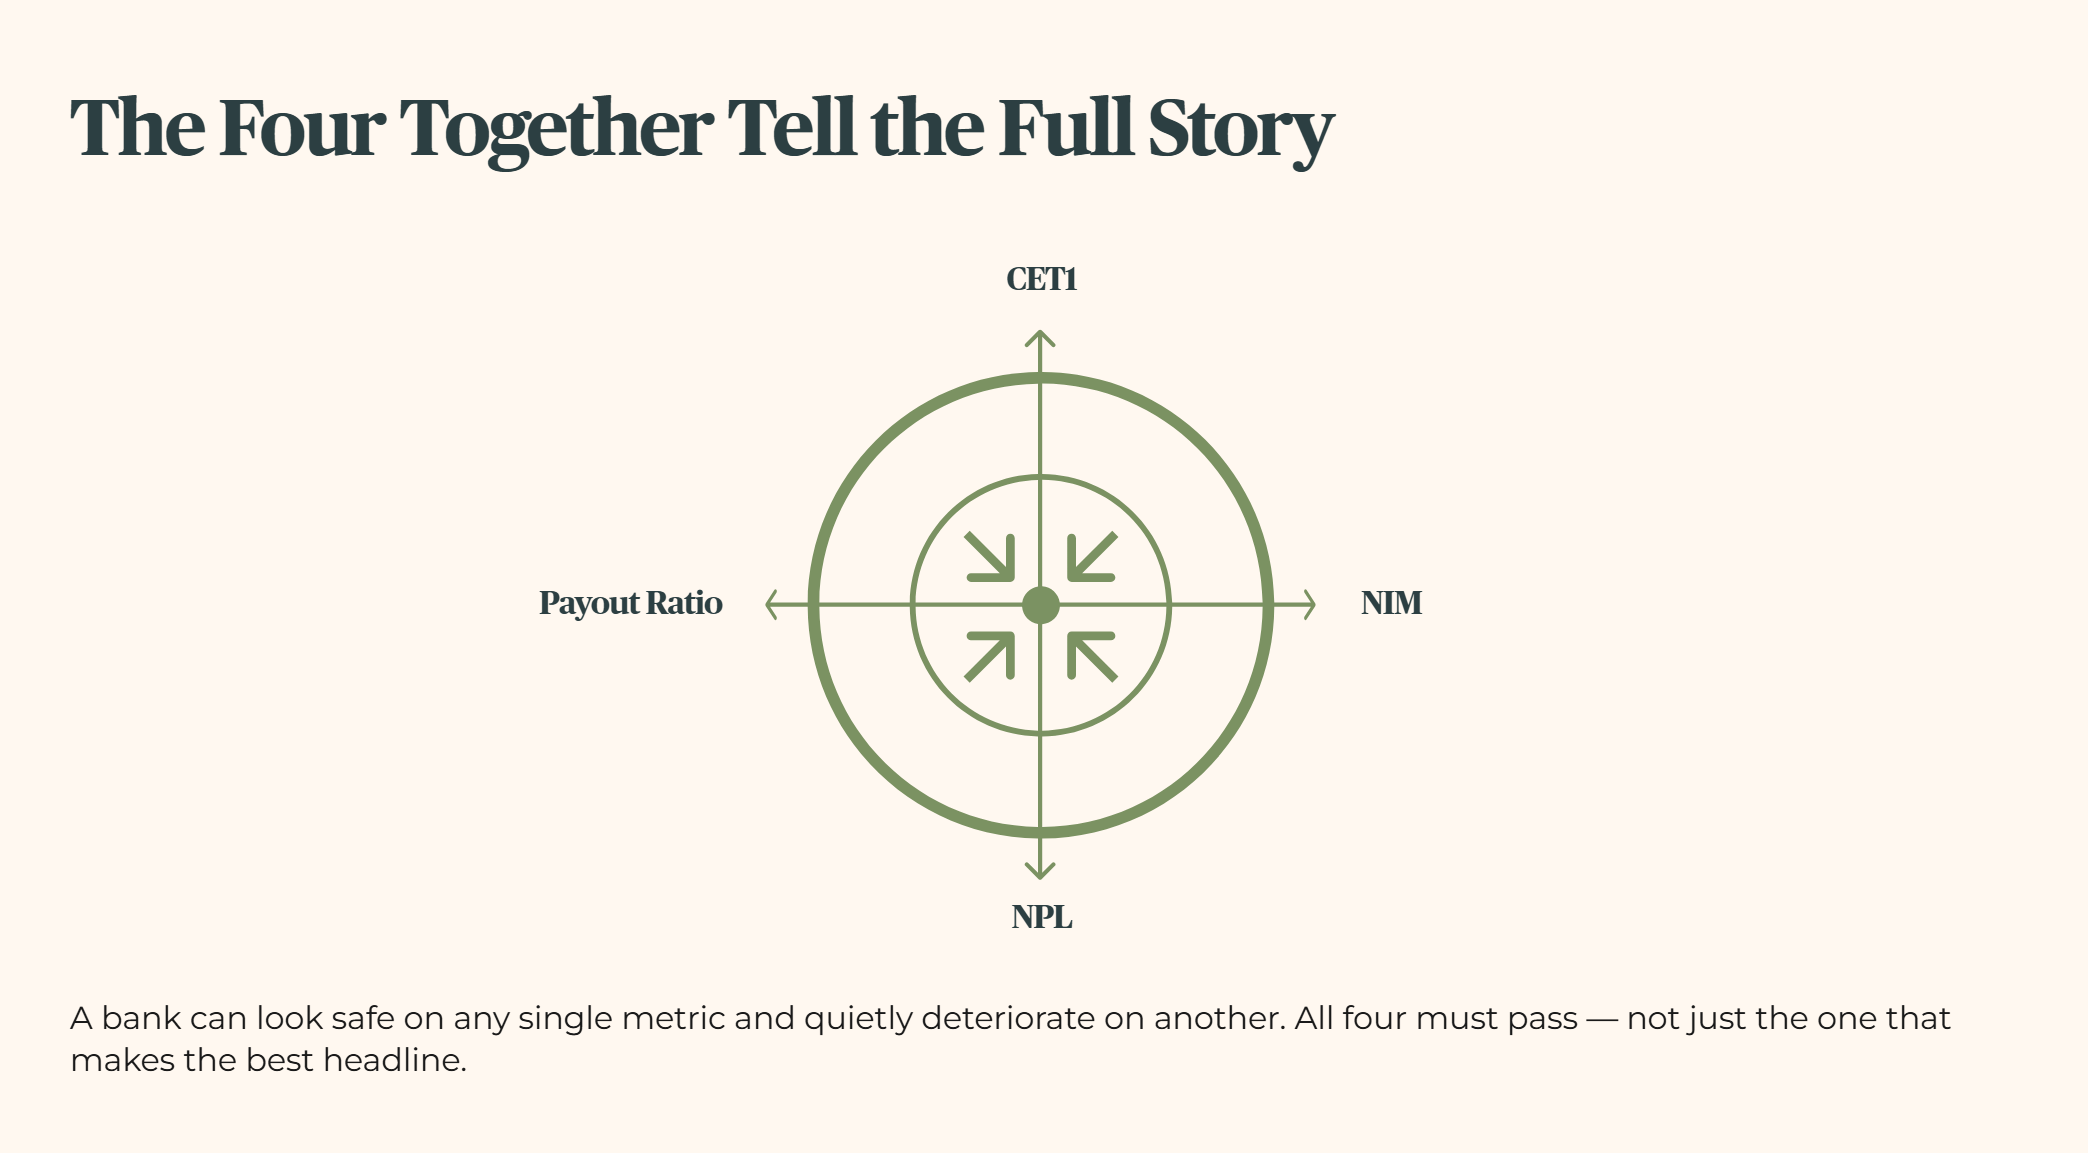
Put together, these four numbers tell a story none of them can tell alone. CET1 tells you how much of a shock the bank can absorb. NIM tells you how healthy its core business actually is right now. NPL tells you whether its past lending decisions are coming back to bite it. Payout ratio tells you whether it’s being disciplined or generous with the cash it does have. A bank can look perfectly safe on any single one of these and still be quietly deteriorating on another, which is exactly why the framework demands all four pass together, not just the one that happens to make the best headline.
In the next section I run this four-gate matrix against DBS’s latest balance sheet and dividend stream, and the yield hurdle verdict that falls out of that calculation is the line between a genuine Sanctuary and a hidden Yield Trap.
