



Singapore’s latest T-bill auction just cleared at 1.59%. No salary credit. No card spend. No insurance purchase. Just a number, and it’s yours.
Compare that to your bank’s savings account. The headline says up to 4.10%. What you’ll actually earn depends on how many boxes you tick.
I get asked constantly why I bother checking a REIT’s gearing and occupancy instead of just trusting the yield on the cover page. The same discipline applies here, just aimed at your own bank statement instead of a listed company’s. A headline savings rate is a REIT’s headline yield wearing a different outfit, the real number lives in the conditions underneath it, not the number in bold.
The Clean Number First
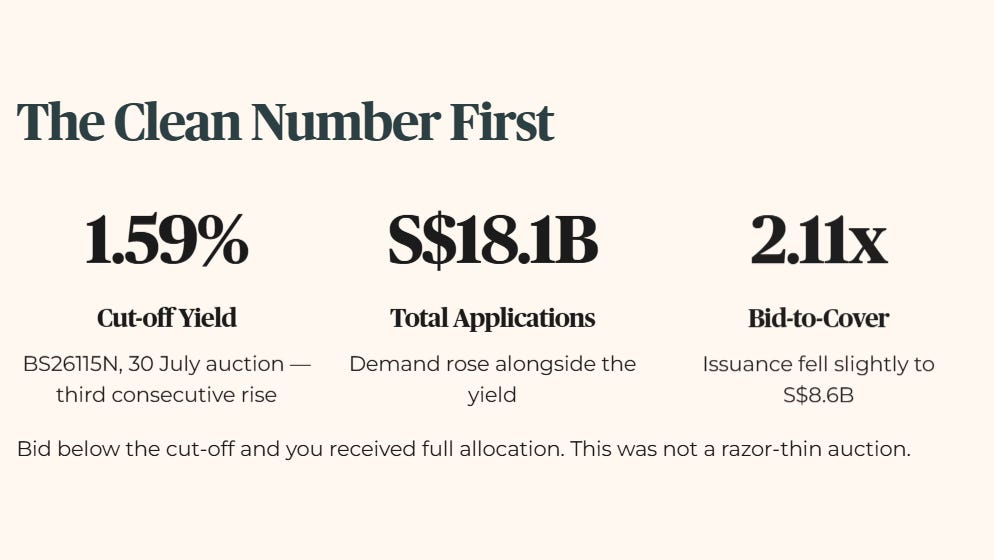
The 6-month Singapore T-bill (BS26115N) cleared at a cut-off yield of 1.59% in the 30 July auction, its third consecutive rise, up from 1.55% on 16 July and 1.50% on 2 July. Demand rose alongside it, total applications reached S$18.1 billion, and the bid-to-cover ratio climbed to 2.11 times as issuance fell slightly to S$8.6 billion. If you’d bid below the cut-off, you got your full allocation. Bid exactly at 1.59%, and allocation ran close to full as well, this wasn’t a razor-thin cut-off auction.
Here’s what makes 1.59% the honest number in this piece: it’s what MAS actually paid, full stop. No behavioural conditions, no minimum spend, no product cross-sell. You bid, you get allotted, you’re paid the rate. That’s the baseline every other number in this piece needs to be measured against.
UOB One: The Closest To Honest
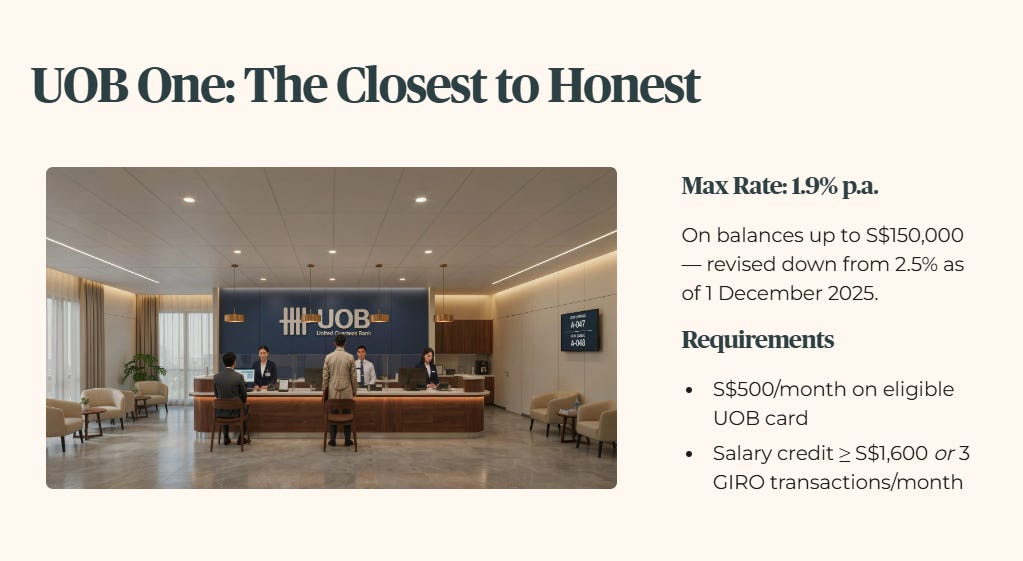
UOB’s One Account currently advertises a maximum effective interest rate of 1.9% p.a. on balances up to S$150,000, revised down from 2.5% as of 1 December 2025, in what the bank described as an adjustment to align with long-term interest rate expectations. To hit that ceiling, you need S$500 in monthly spend on an eligible UOB card, plus either a salary credit of at least S$1,600 or three GIRO transactions a month.
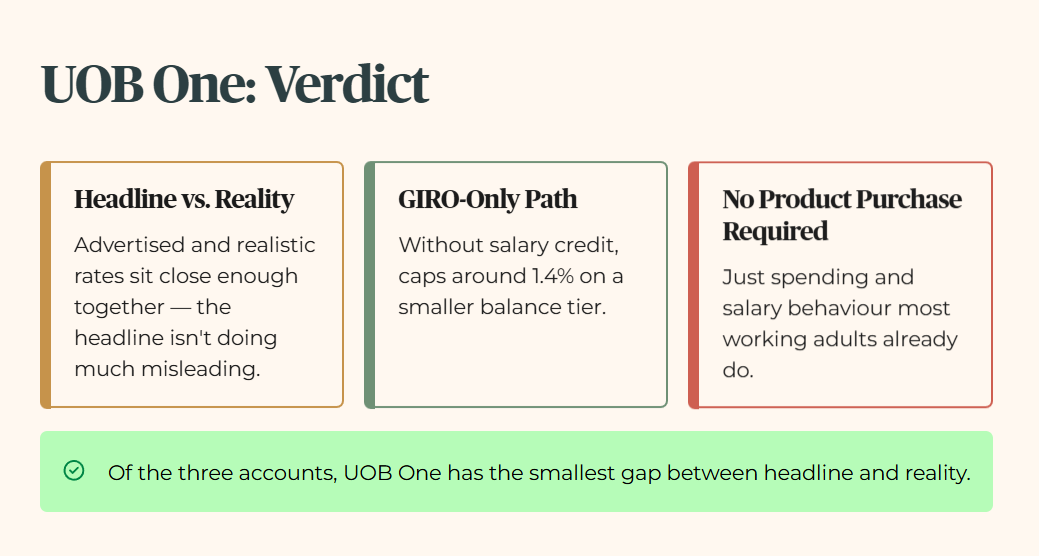
Of the three accounts in this piece, this is the smallest gap between headline and reality. No insurance purchase, no investment product, just spending and salary behaviour most working adults already do anyway. The GIRO-only path, without a salary credit, caps out lower, around 1.4% on a smaller balance tier, worth knowing if you’re not routing your paycheck through UOB.
Iggy’s Forensic Zone: not applicable. This isn’t a stock, so there’s no zone verdict here, just a straightforward read: UOB One’s advertised rate and its realistic rate sit close enough together that the headline isn’t doing much misleading. That’s not true of the next two.
OCBC 360: The Widest Gap
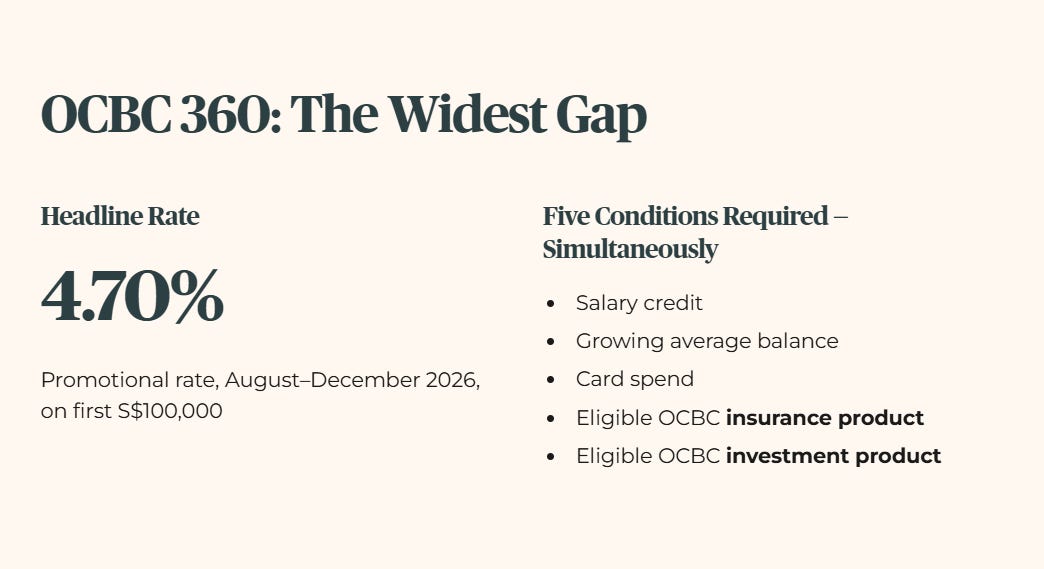
OCBC 360’s current promotional headline reaches as high as 4.70% p.a. on the first S$100,000, a limited-time bump running from August through December 2026 on top of an already-revised 4.45% ceiling. To actually reach that number, you need all five categories at once: salary credit, growing your average balance, card spend, and, critically, purchasing an eligible OCBC insurance product and an eligible OCBC investment product.
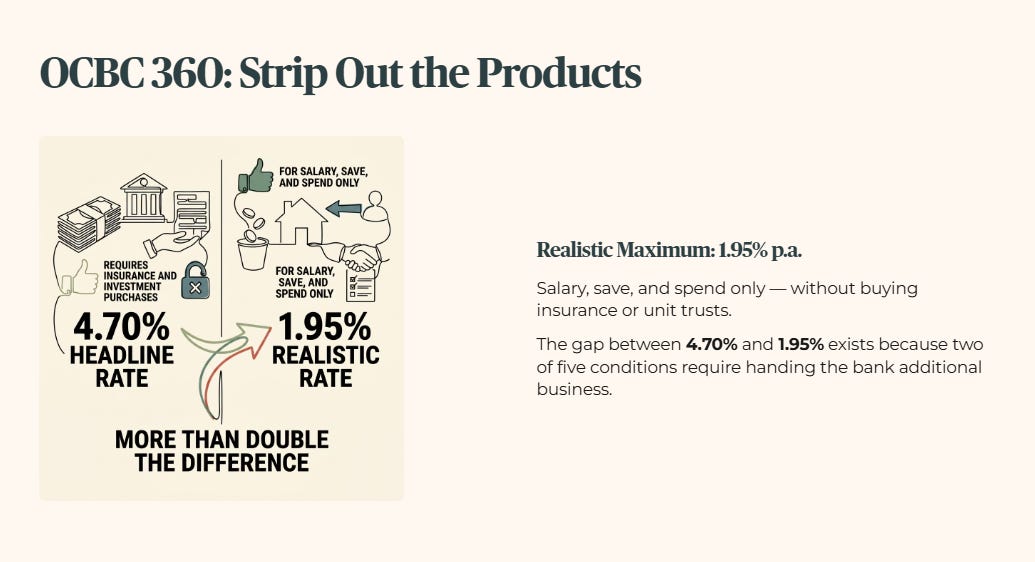
Strip out the insurance and investment purchases, the two categories that require you to actually buy a financial product from the bank, and the realistic maximum most account holders will earn is 1.95% p.a. on salary, save, and spend alone. That’s the number worth anchoring on if you’re not planning to buy insurance or unit trusts specifically to unlock a savings account tier. The gap between 4.70% and 1.95% isn’t a rounding difference, it’s more than double, and it exists specifically because two of the five conditions require handing the bank additional business, not just banking behaviour.
What “Up To” Actually Means
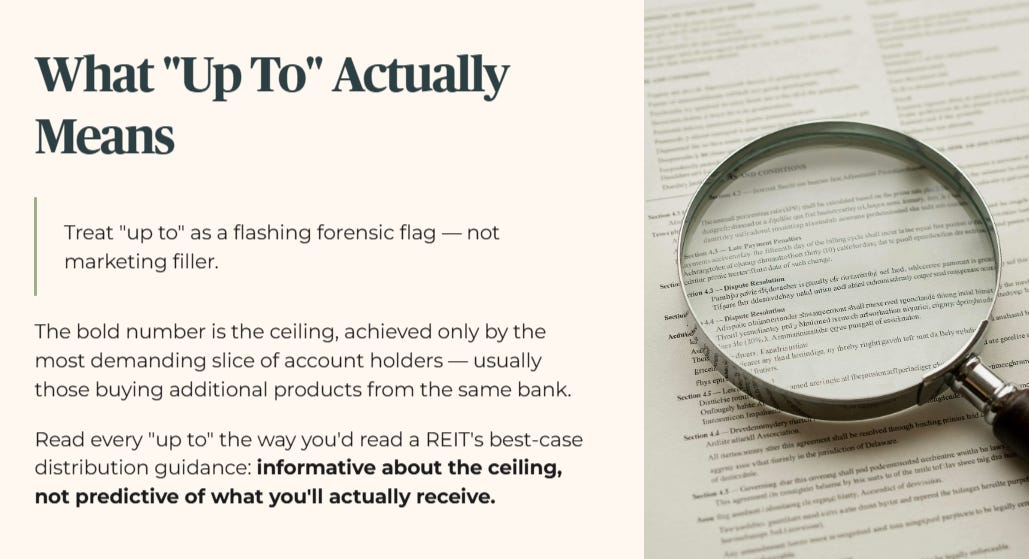
Every time you see a savings account advertised as “up to” a headline rate, treat those two words as a flashing forensic flag, not marketing filler. “Up to” means the number in bold is the ceiling, achieved only by the smallest, most demanding slice of account holders, usually the ones buying additional products from the same bank. The realistic rate for someone who just banks normally, salary credit and everyday spend, is almost always closer to the base of the tier structure than the top. Read every “up to” the way you’d read a REIT’s best-case distribution guidance: informative about the ceiling, not predictive of what you’ll actually receive.
DBS Multiplier: The Volume Trap
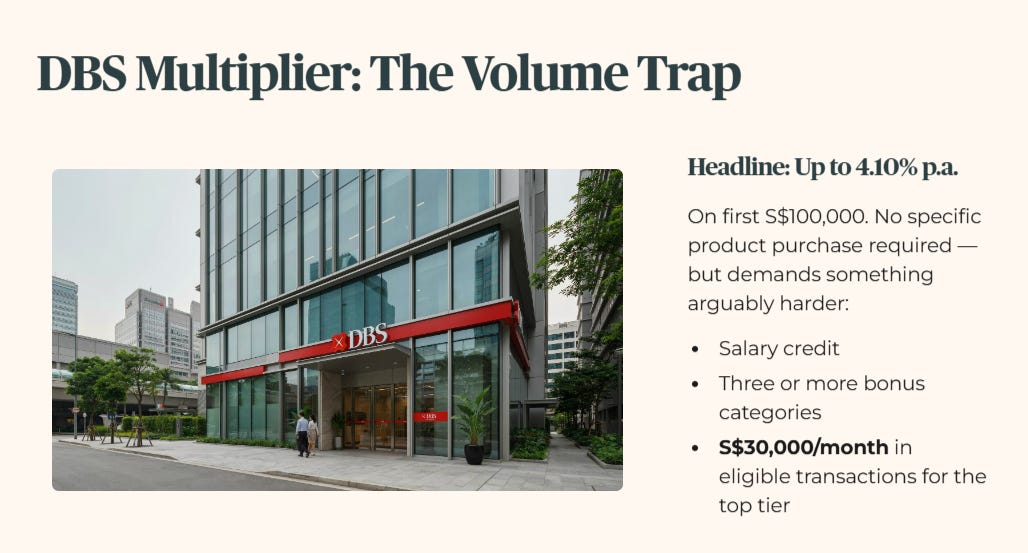
DBS Multiplier’s headline sits at up to 4.10% p.a. on the first S$100,000. Unlike OCBC, it doesn’t require buying a specific product, but it demands something arguably harder for most households to sustain: a salary credit plus three or more bonus categories, card spend, home loan, insurance, or investment, and at least S$30,000 a month in eligible transactions running through the account to land in the top tier of the rate grid.
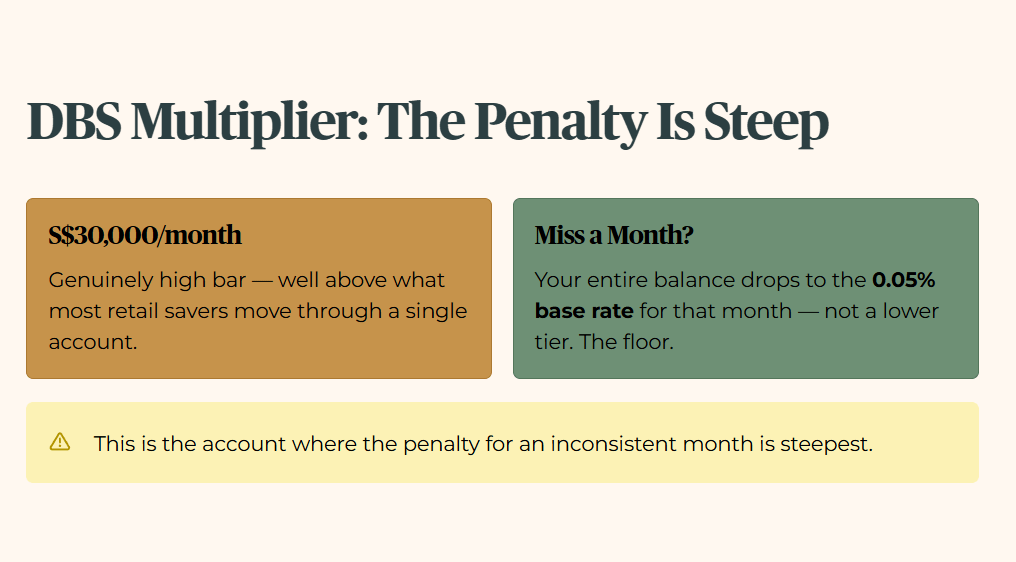
Thirty thousand dollars of monthly eligible transactions is a genuinely high bar, well above what most individual retail savers move through a single account in a normal month. Fewer categories or a thinner month lands you in a lower cell of the same grid, and missing the income credit or category requirement entirely in any given month doesn’t just lower your rate, it drops your entire balance to the 0.05% base rate for that month. This is the account where the penalty for an inconsistent month is steepest, not a lower tier, the floor.
The trade-off section that follows applies the same forensic discipline to liquidity and capital risk, the point where a clean 1.59% T-bill starts competing directly with your “up to” savings rates for where idle cash should actually sit.
