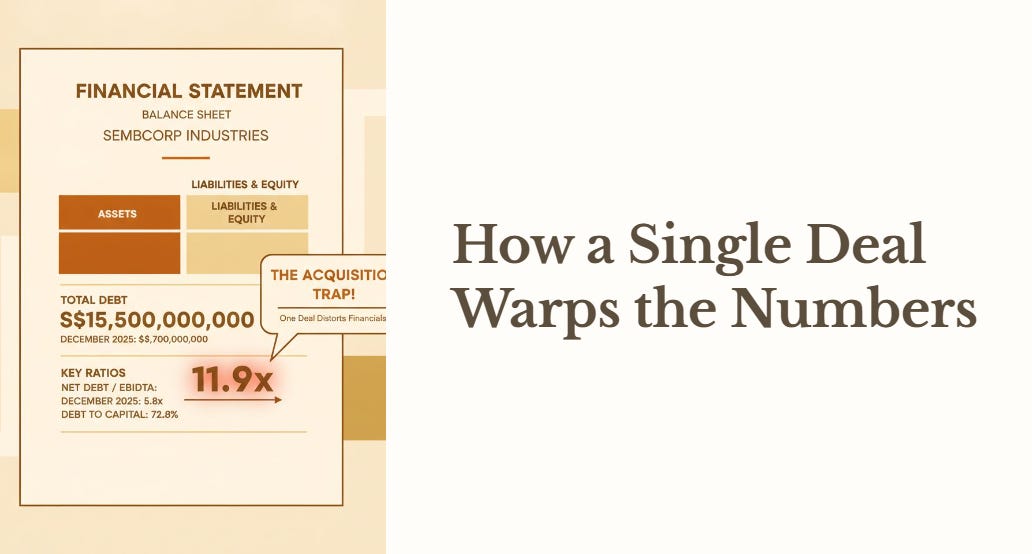
The Acquisition Trap: How a Single Deal Can Make Any Company’s Balance Sheet Look Terrible for a Year
Sembcorp’s leverage ratios just looked like they tripled overnight. Here’s why that number is telling you less than you think, and what I’m actually waiting on before I’ll call it.
A company’s debt to earnings ratio just went from comfortable to alarming in a single quarter, no fire sale, no crisis, just one acquisition. Most investors will see a number like 11.9x and assume the worst. The truth is almost always more complicated, and less scary, than the ratio alone can tell you.
I get messages every time a familiar SGX name reports a leverage figure that looks frightening on paper. This week it’s Sembcorp Industries, whose Net Debt to EBITDA reading appears to have nearly doubled in six months. If you’re holding this stock, or thinking about buying it after a recent broker upgrade, you deserve to understand why that number moved so violently before deciding what it means.
This is exactly the kind of moment my forensic framework exists for, not to hand you a verdict I can’t yet defend, but to show you how to read past a frightening headline figure until the real picture is actually knowable.

The number that looks terrible
Why acquisitions break this ratio temporarily
The Sembcorp case, specifically
What we still don’t know
How to spot this pattern yourself, on any stock
Iggy’s Elite Read
The number that looks terrible
Sembcorp’s total debt rose from S$9.7 billion in December 2025 to S$15.5 billion by June 2026, an increase of S$5.75 billion in a single half.
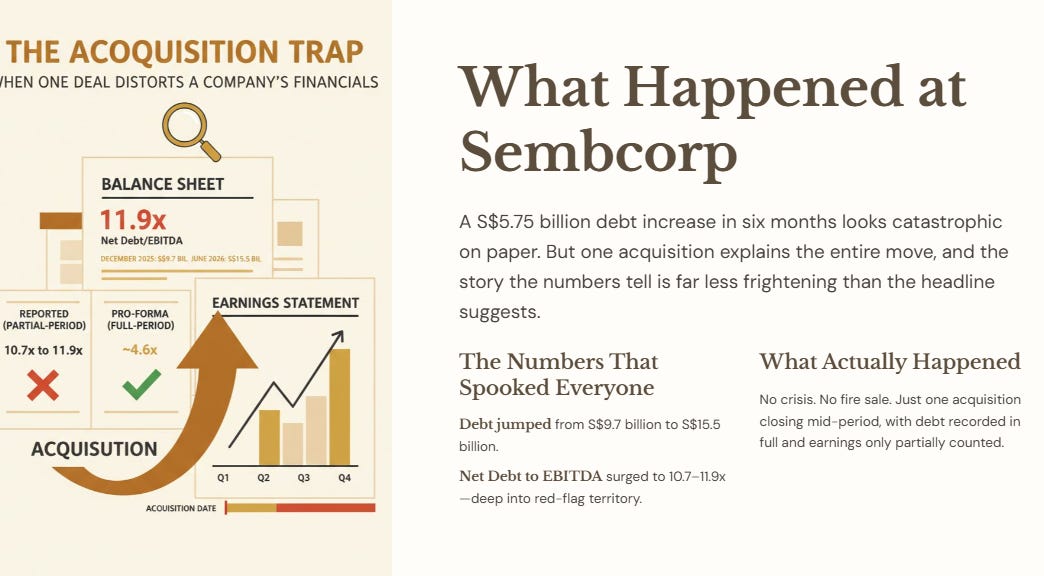
Against trailing EBITDA of roughly S$1.3 billion, that produces a Net Debt to EBITDA reading of approximately 10.7 to 11.9 times, well above my own 5x yellow-flag threshold, and deep into red-flag territory above 10x. Debt to capital comes in around 72.8 percent, more than double my 35 percent ceiling for standard corporate entities.
If you stopped reading right there, this would look like a company that overextended itself. That’s exactly the trap.
Why acquisitions break this ratio temporarily

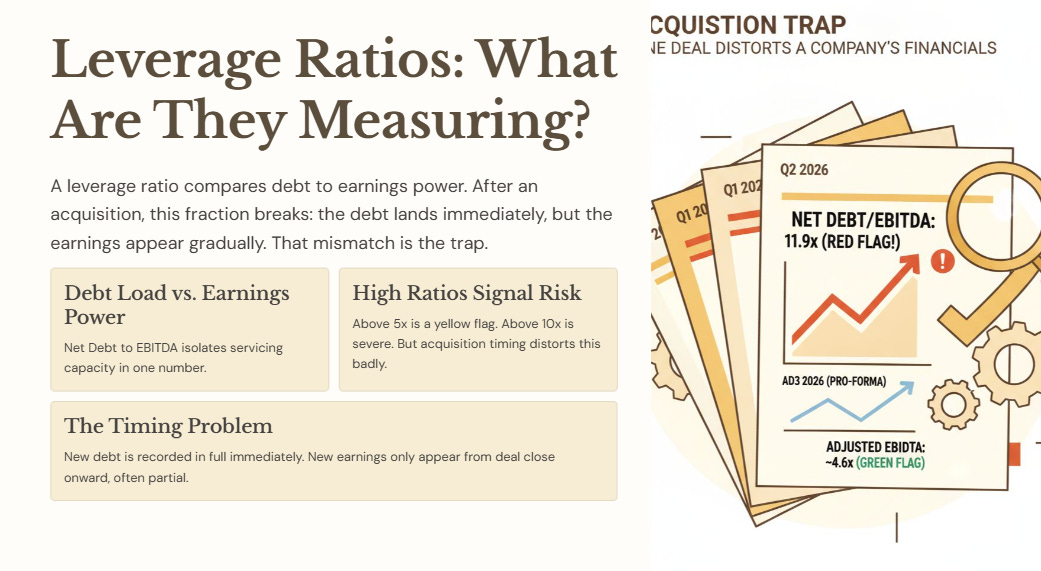
A leverage ratio is a fraction. Debt sits on top, earnings sit on the bottom. When a company completes an acquisition, the debt used to fund it lands on the balance sheet immediately and in full, the moment the deal closes. The earnings that debt is meant to be serviced against arrive gradually, often only from the completion date forward, sometimes not fully for a year or more depending on integration and reporting timing.
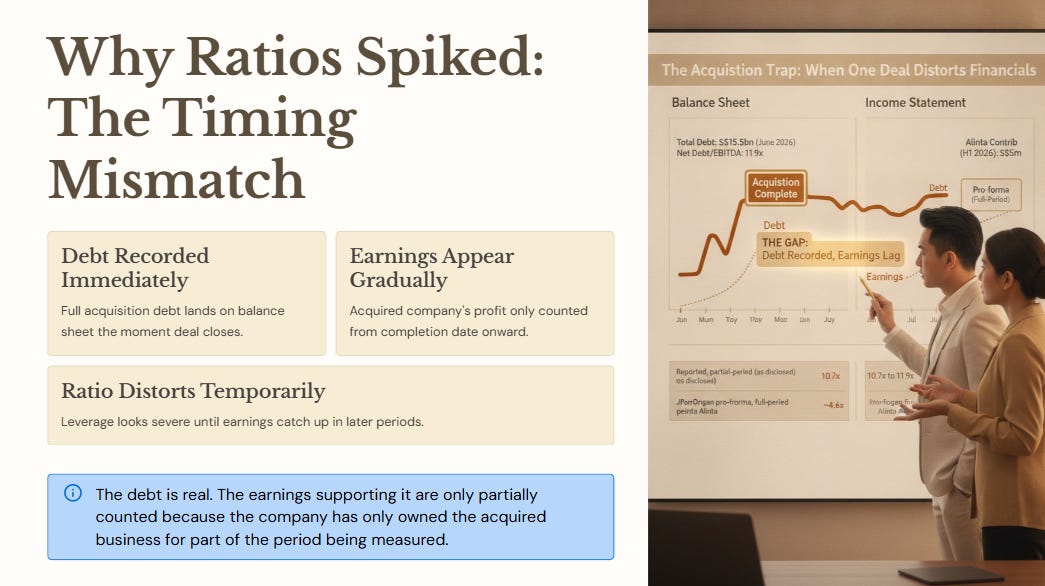
That mismatch means the ratio can look catastrophic for one or two reporting periods even when the underlying economics of the deal are genuinely sound. The debt is real and fully counted. The earnings supporting it are only partially counted, because the company has only owned the acquired business for part of the period being measured.

🟢Iggy’s Insights
Think of it like buying a rental property with a mortgage in your last week of the tax year. Your bank statement shows the full loan from day one. Your tax return shows one week of rental income. Anyone judging your finances purely off that year’s numbers would conclude you’d made a terrible decision, over-leveraged against almost no income to show for it. The mortgage was never the problem.
The reporting period was just too short to show what the property actually earns in a full year. A leverage ratio taken in the middle of an acquisition’s first reporting cycle has exactly this distortion built in, and the size of the distortion depends entirely on how much of the period the new earnings were actually being counted.
The Sembcorp case, specifically
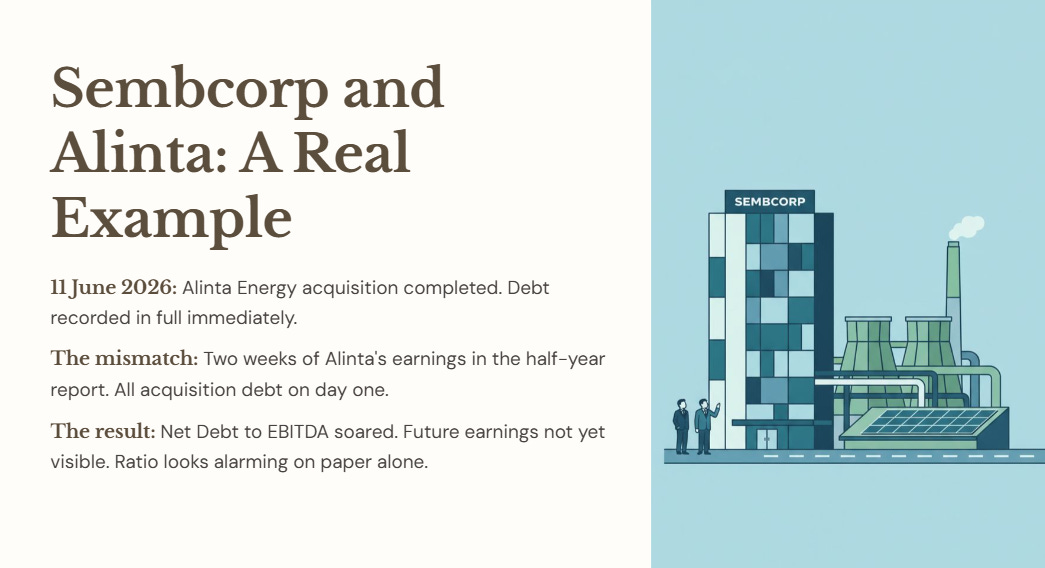
Sembcorp completed its acquisition of Alinta Energy on 11 June 2026. Because consolidation only began from that date, Alinta contributed just S$5 million to Sembcorp’s reported first-half profit, a single fortnight’s worth of results dropped into a six-month income statement.
But Sembcorp’s own pro-forma disclosure, which assumes the acquisition had closed on 1 January instead, shows Alinta would have contributed S$209 million of underlying profit for the same half, lifting group underlying net profit from S$369 million to S$558 million.
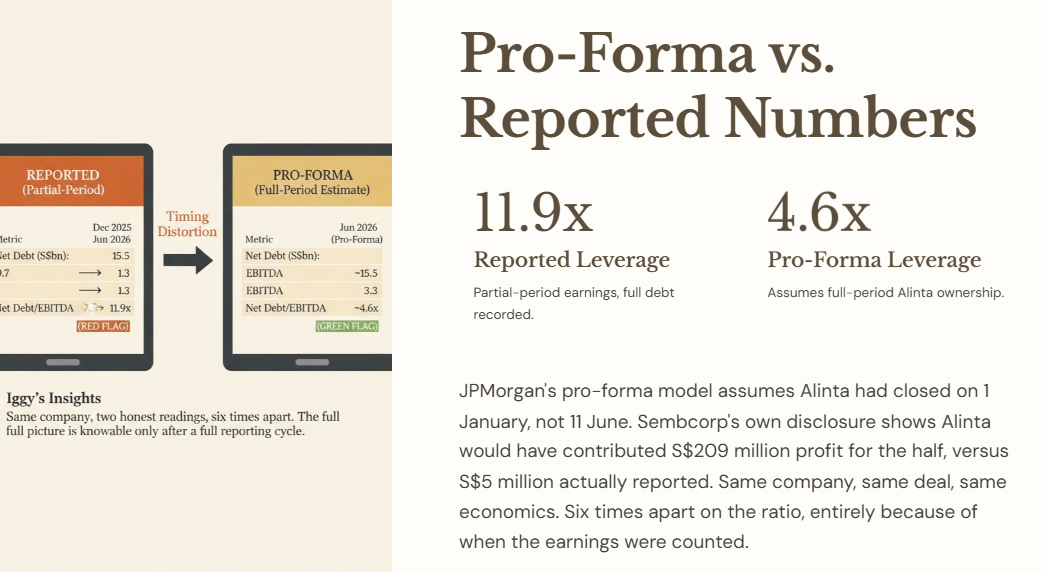
That’s the earnings side of the mismatch, made concrete. The debt side landed in full in June. The earnings side is still almost entirely absent from the reported numbers, through no fault of the business, purely because of when the deal closed relative to the reporting calendar.
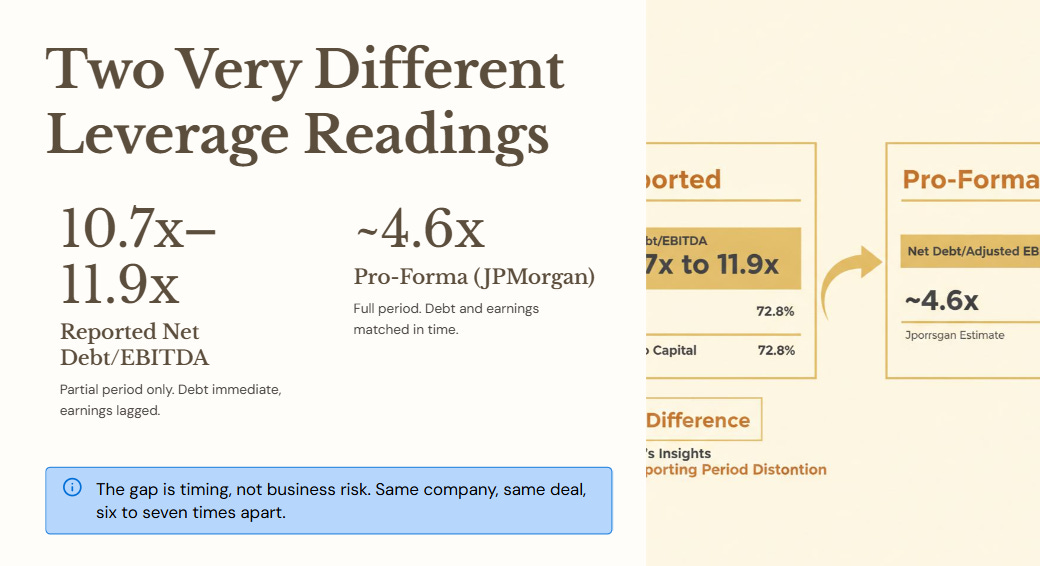
One broker’s own modelling reflects this gap directly. JPMorgan’s pro-forma estimate, treating Alinta as fully owned for the comparison period, puts net debt to adjusted EBITDA at approximately 4.6 times, comfortably under my 5x yellow-flag line. That’s a dramatically different picture from the 10.7 to 11.9 times implied by the reported, partial-period figures.
Two honest readings of the same company, six to seven times apart, depending entirely on a reporting-period technicality rather than anything that’s actually changed about how much debt the business can support.
🔒 What’s Next
The 4.6x pro-forma figure comes from a broker estimate, not from Sembcorp itself. The section below covers exactly what would need to be confirmed, and disclosed by the company directly, before I’d treat either number as reliable enough to assign this stock a forensic verdict.