

The Chicken Rice Seller and the Ten-Year Loan: A Parkway Life REIT Forensic
Investigating why InvestingPro sees a "Refund" of capital while DBS sees the ultimate healthcare toll-bridge.

1. The Context
Picture this: You are sitting at the kitchen table, staring at your brokerage statement while sipping your morning kopi. The Straits Times Index is dancing around the 5,000-point historic resistance milestone, and we are navigating the Year of the Fire Horse—a cycle defined by high momentum and stomach-churning volatility. You are managing your hard-earned CPF and SRS funds, looking for a safe harbor, but the financial headlines are screaming about shifting global rate policies.
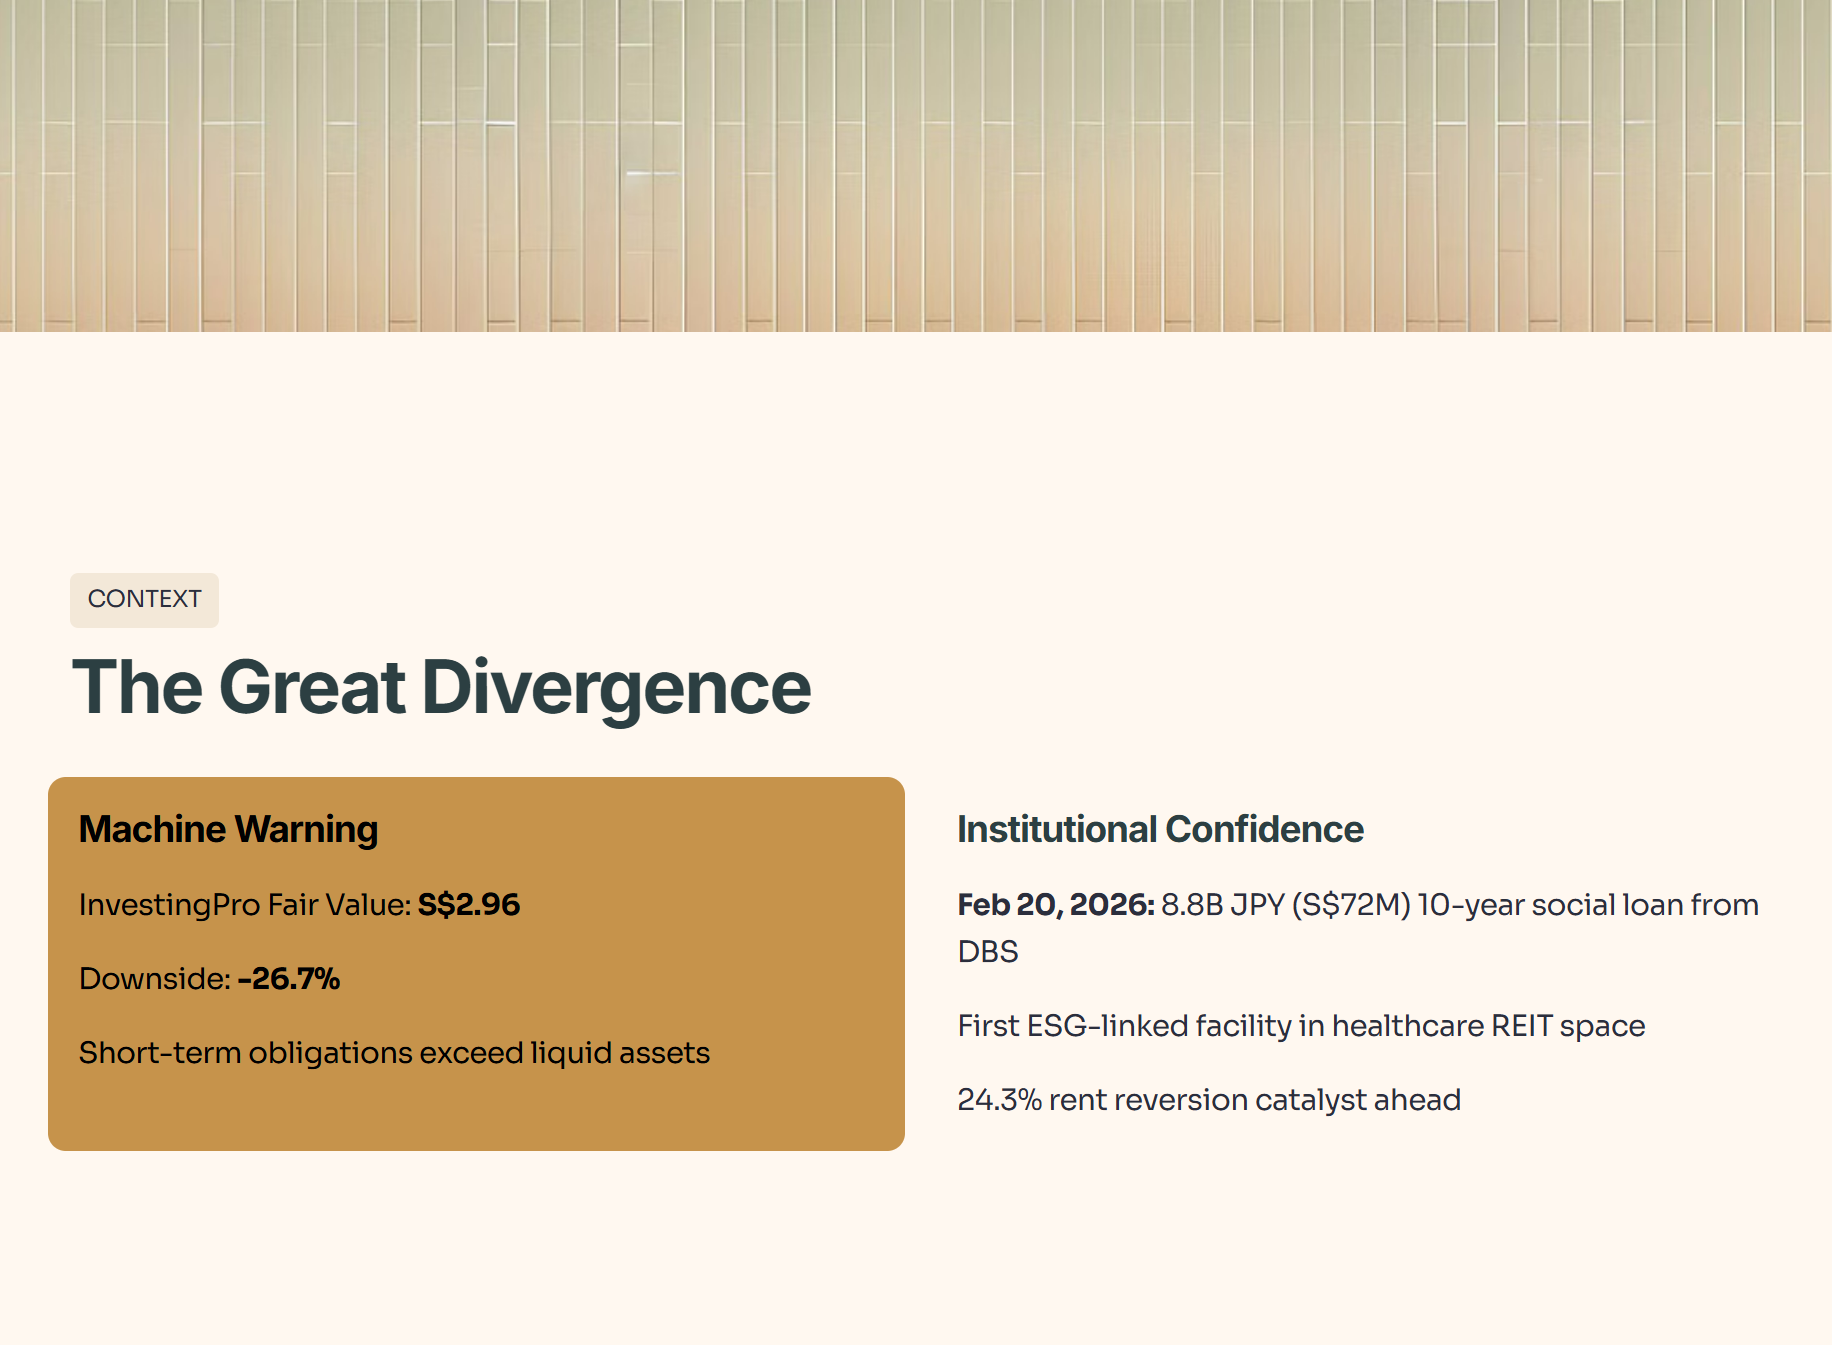
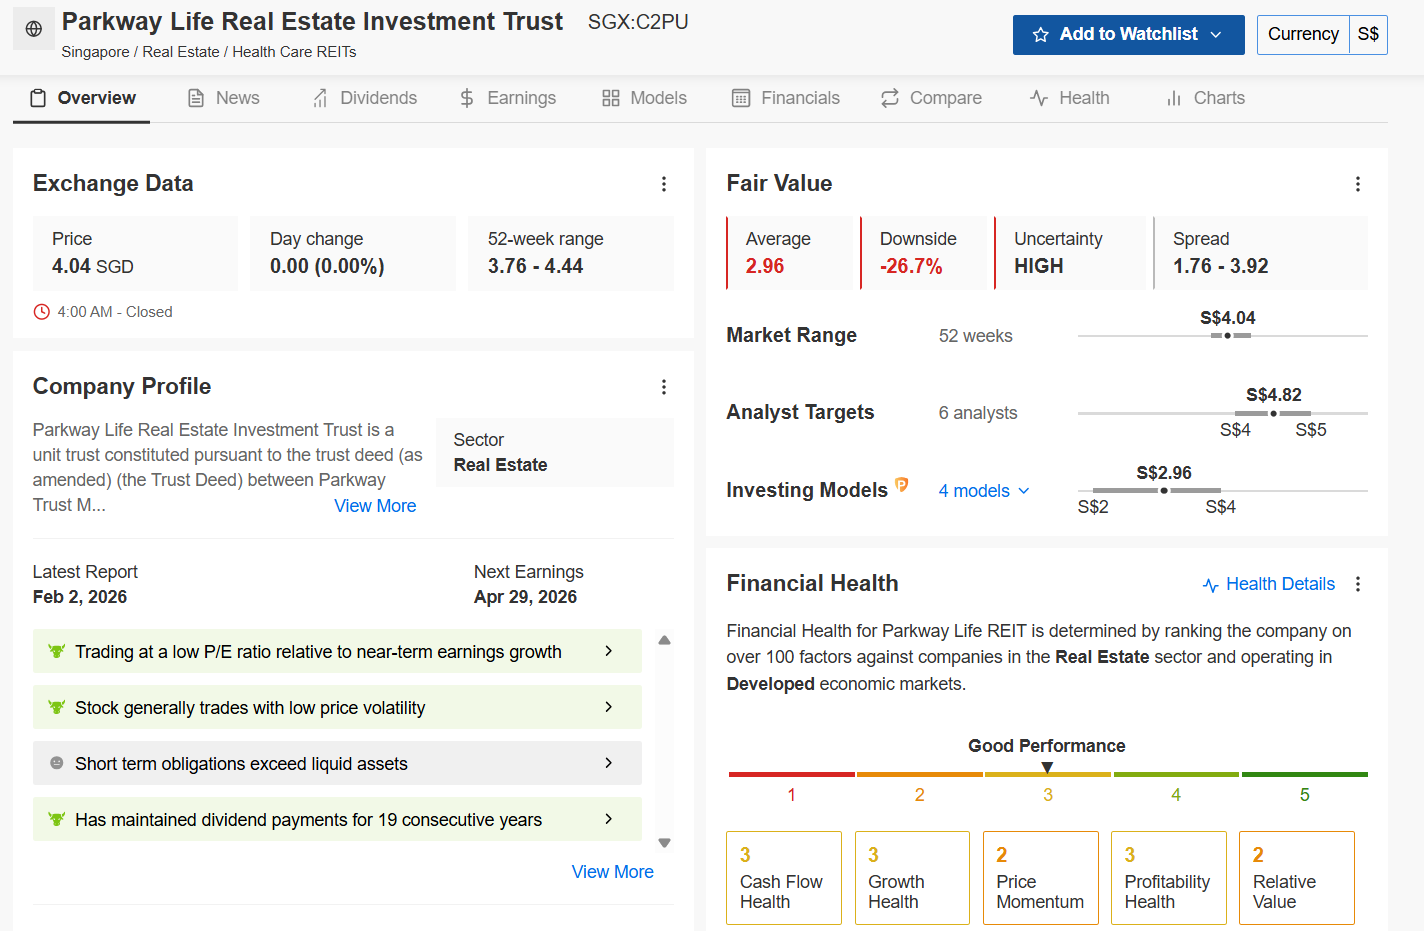
The trigger event that brings us here today is a massive divergence between human institutional capital and machine algorithms. On one hand, the quantitative models on InvestingPro just flashed a glaring warning: they calculate an Average Fair Value of S$2.96, indicating a massive -26.7% downside from the current price of S$4.04. The machine is worried because short-term obligations exceed liquid assets.
But on the other hand, the institutional “Smart Money” is doing the exact opposite. On February 20, 2026, Parkway Life REIT secured a landmark 8.8 billion JPY (S$72 million) 10-year social loan from DBS Bank. This isn’t just a loan; it’s the first ESG-linked facility DBS has ever granted in the healthcare REIT space. While the AI is looking at the rearview mirror of the balance sheet, DBS—the “Institutional Asian Uncle” of banks—is providing a 10-year vote of confidence in the trust’s structural survival.
And let’s be honest, seeing an algorithmic downside of nearly 27% would make most retail investors hit the panic sell button. But here is the uncomfortable truth: algorithms look at static data; they cannot fully comprehend the ironclad nature of a 20-year master lease or the impending 24.3% rent reversion catalyst scheduled for the Singapore hospital assets.
In This Article:
The Masterclass: The Social Loan “Water” Element
Step 1: The Health Check (Balance Sheet & Solvency)
  The Five-Layer Audit: Gearing, Solvency, and Liquidity
  Financial Health Checklist
Step 2: The Wealth Check (Cash Flow & Yield)
  The Five-Layer Audit: Free Cash Flow and Distribution Sustainability
  Dividend and Payout Trajectory
Step 3: The Price Check (Valuation & Peers)
  The Five-Layer Audit: Valuation Multiples and Yield Spreads
  Peer Comparison Table
Step 4: The Future Check (Scenarios & Fair Value)
  The Five-Layer Audit: The FY2026 Rent Reversion Catalyst and Fair Value Divergence
  Sensitivity Matrix (FY2026 Projections)
The Bottom Line
InvestingPro Reality Check
Iggy's Verdict
Welcome to the 170 Elite Members of our high-conviction community. I am Iggy, your resident Institutional Asian Uncle. My job is to blend the skepticism of a financial auditor with the patience of an educator to find the exact “Forensic Gap” between the algorithmic headlines and the underlying math.
The Masterclass: The Social Loan “Water” Element
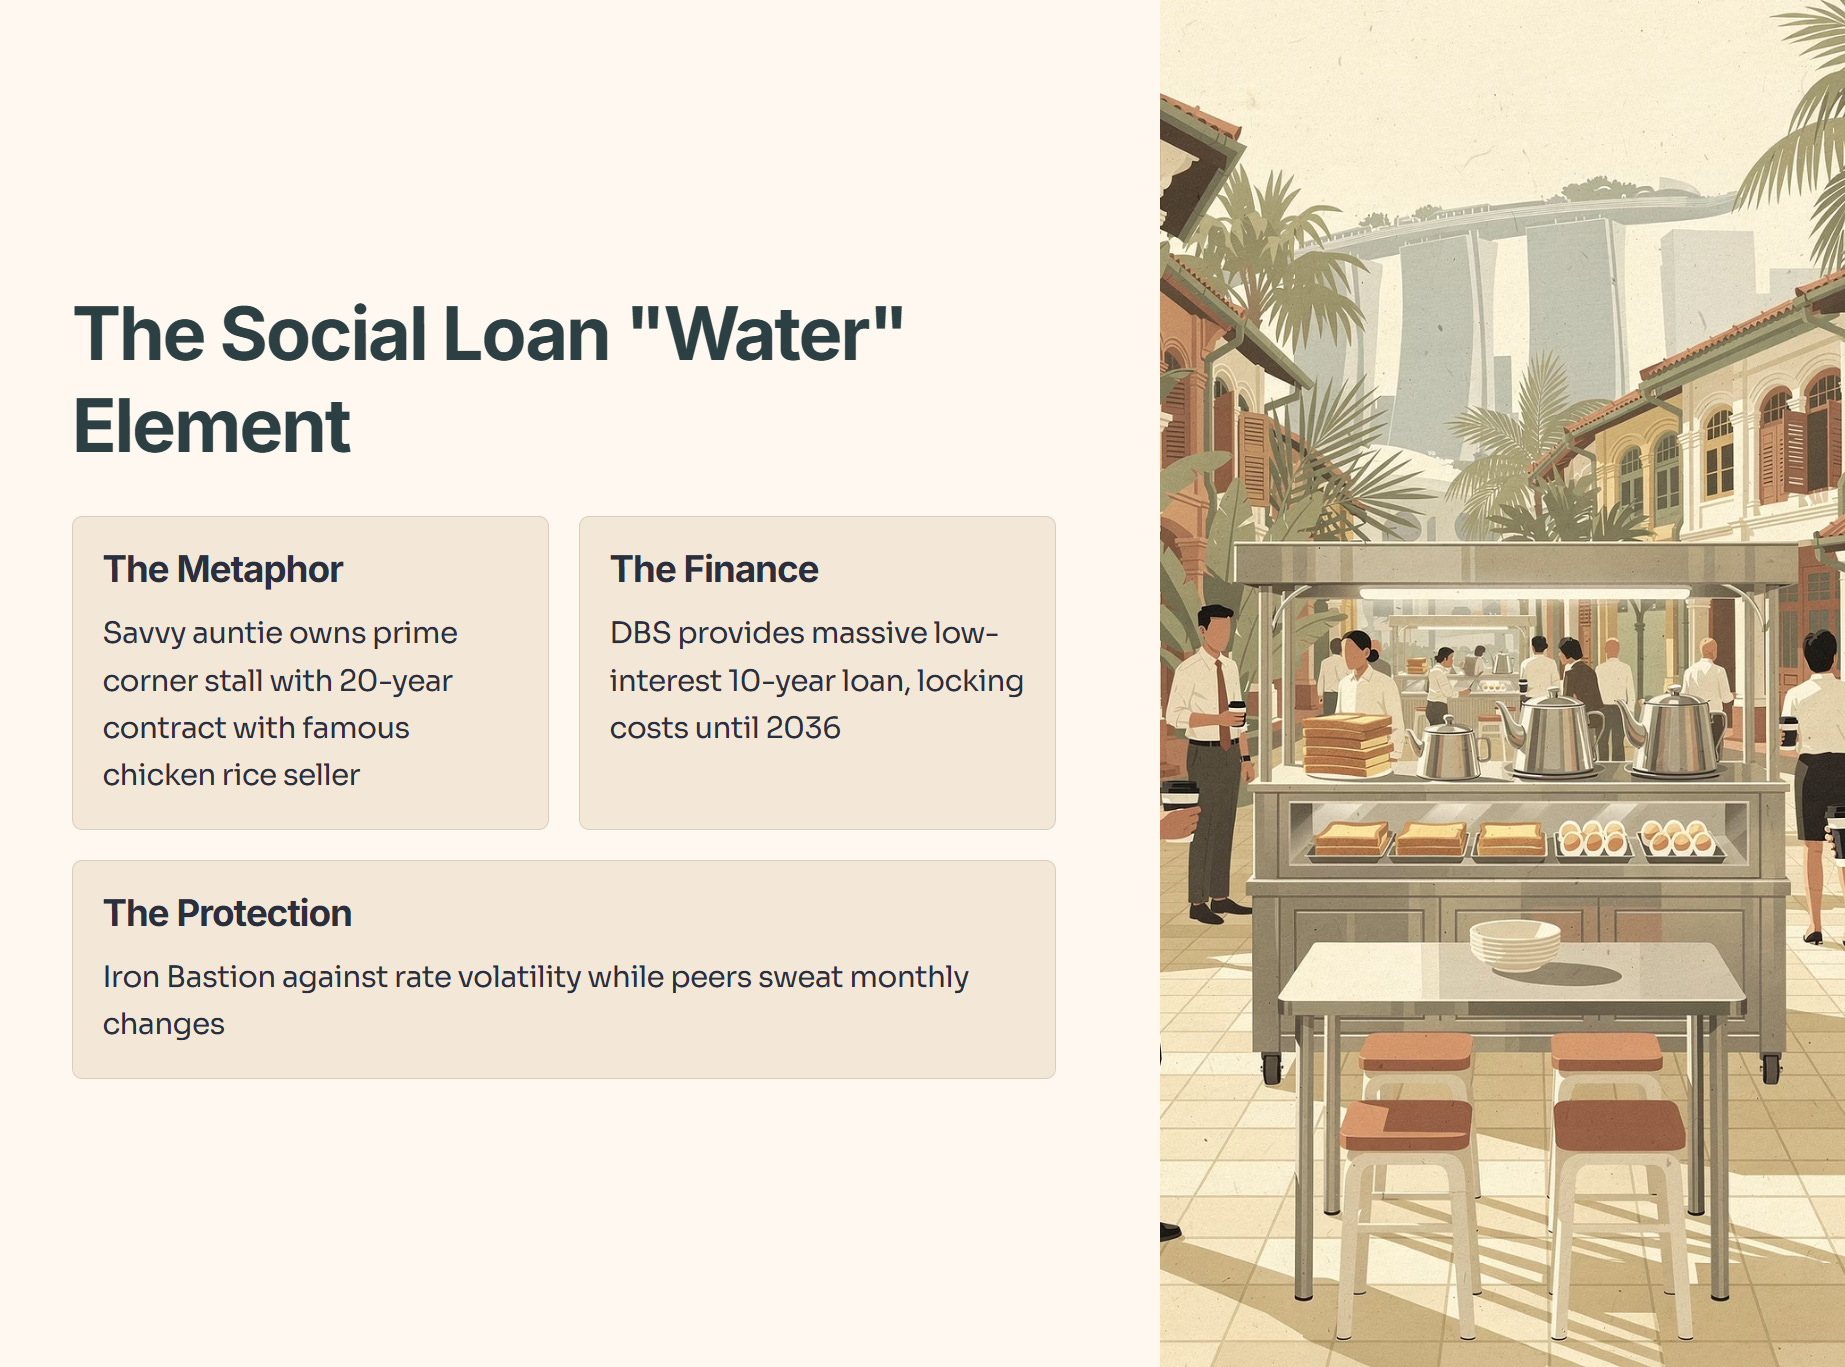
Let’s explain the primary financial driver here using a Singapore daily life metaphor. Think of PLife REIT as a savvy neighborhood auntie who owns a prime corner coffeeshop stall. The bank (DBS) just gave her a massive, low-interest 10-year loan because they know she has a 20-year contract with the most famous chicken rice seller in town. The loan is “Social” because it supports eldercare, but the finance is “Fortress” because it locks in her costs for a decade. This loan acts as the “Water” element that balances the “Fire” of market volatility. While other REITs are sweating over interest rates rising next month, PLife REIT just used DBS’s balance sheet to build an Iron Bastion around its distributions until 2036
2. Step 1: The Health Check (Balance Sheet & Solvency)
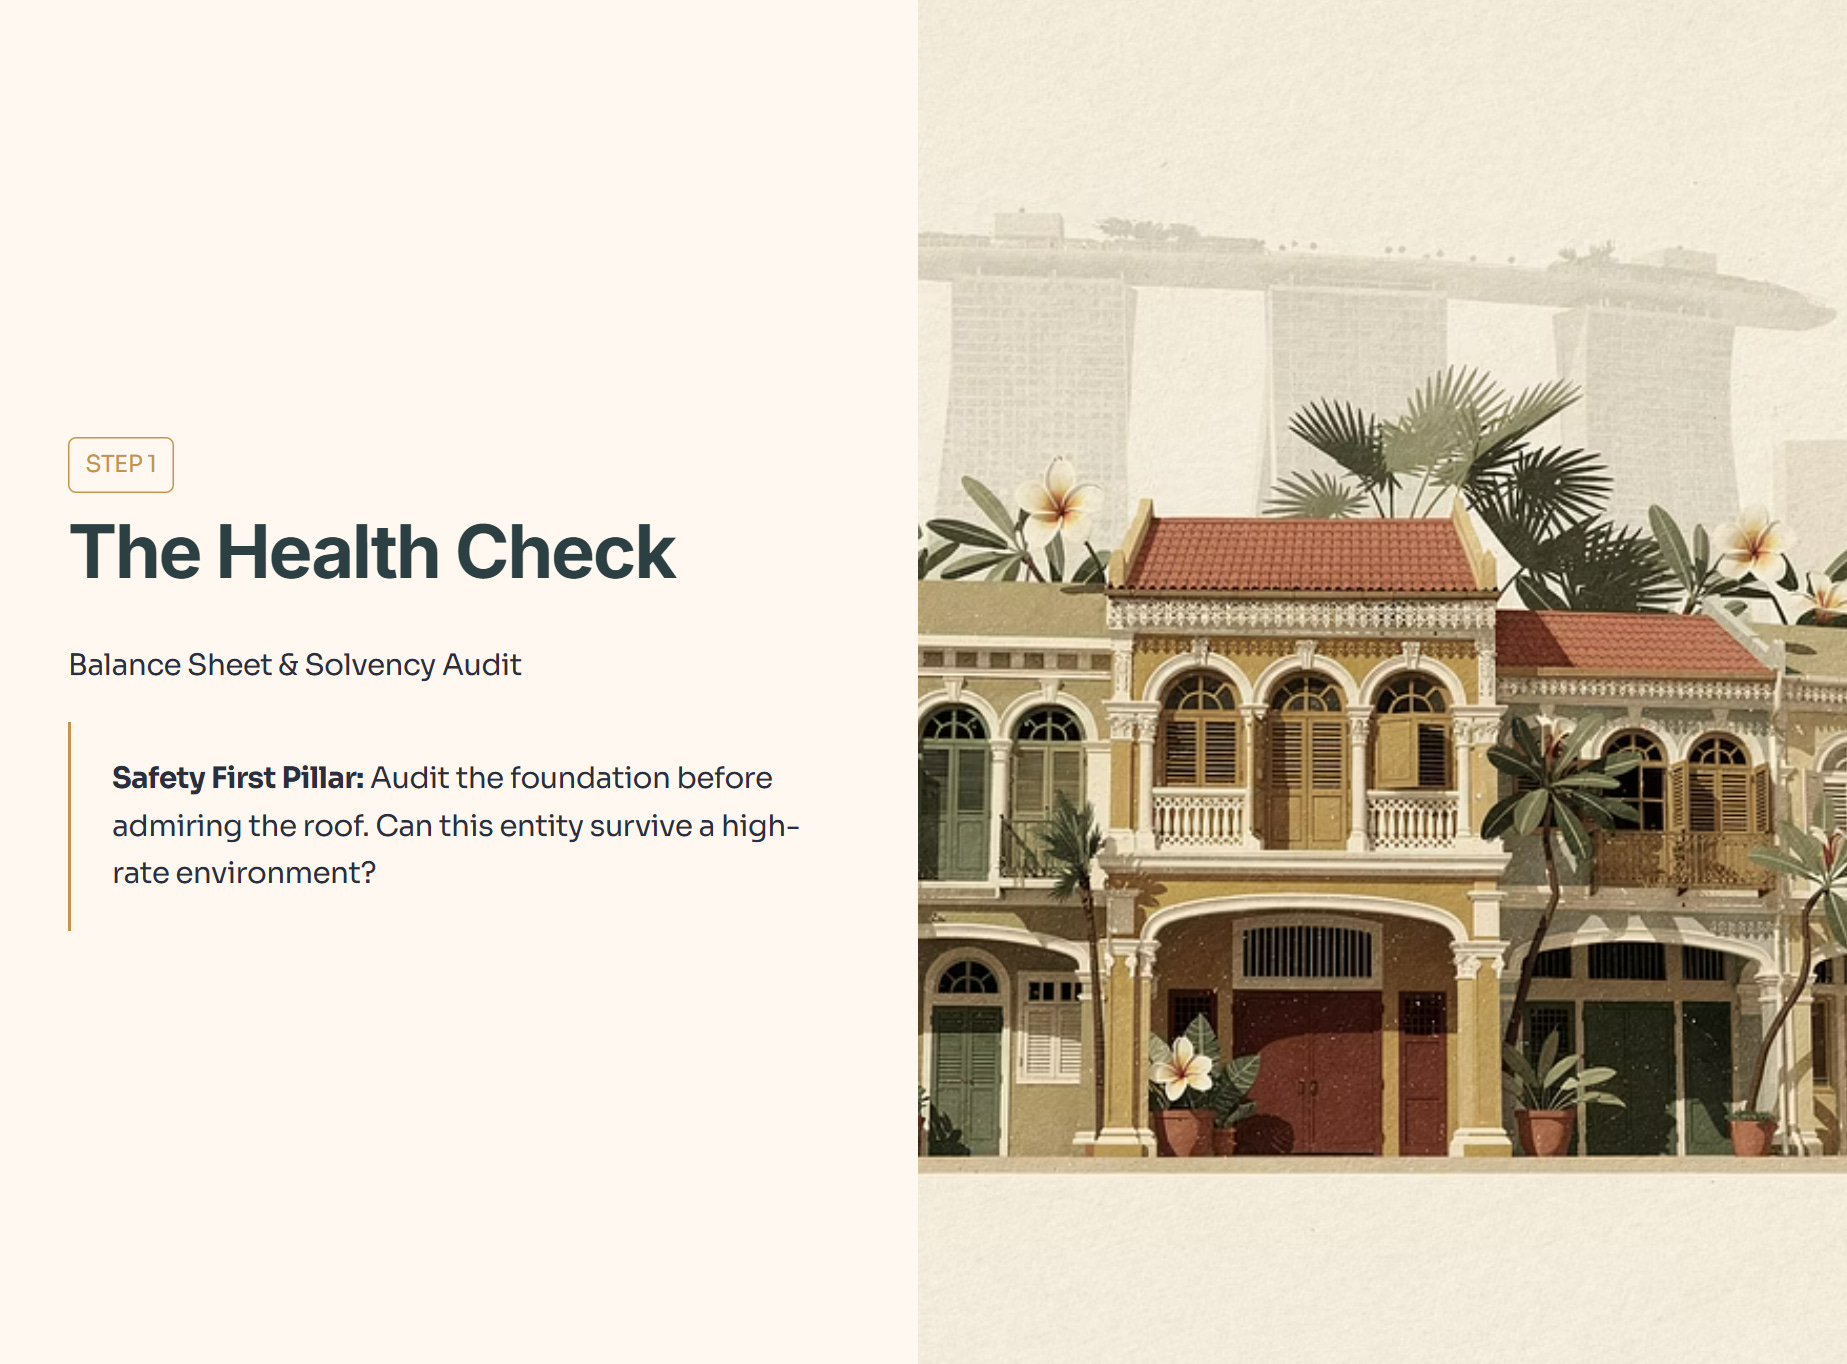
Before we ever look at the dividend, we must ask: can this entity survive a high-rate environment? We always adhere to the “Safety First” Pillar. We audit the foundation before admiring the roof. We need to specifically address the InvestingPro flag regarding short-term obligations.
Source: InvestingPro Data. Unlock these institutional tools for your own portfolio: Use code INVESTINGIGUANA for an exclusive 50% Discount.
🏛️ [Claim Your 50% Discount Here]
The Five-Layer Audit: Gearing, Solvency, and Liquidity
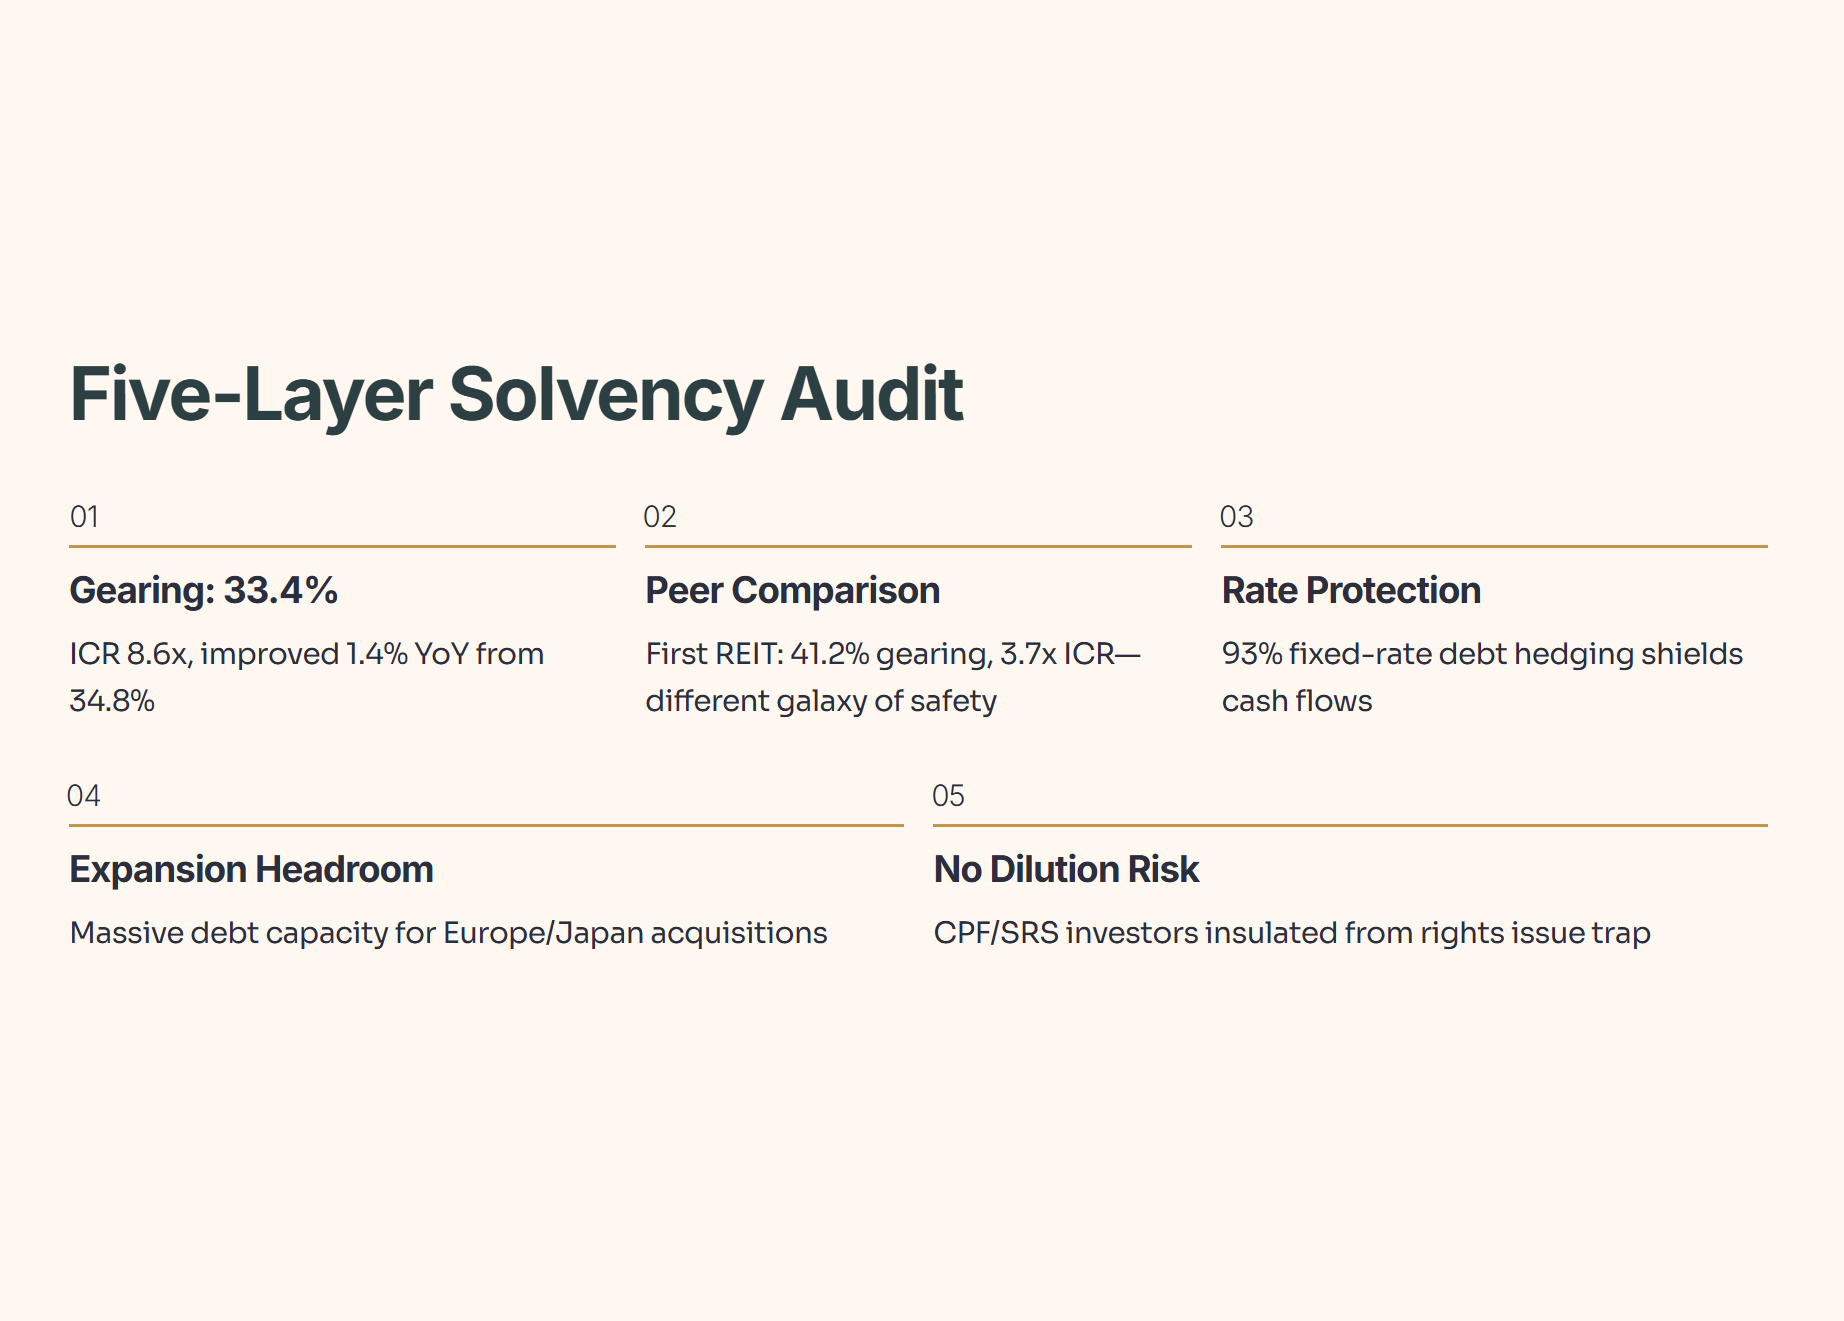
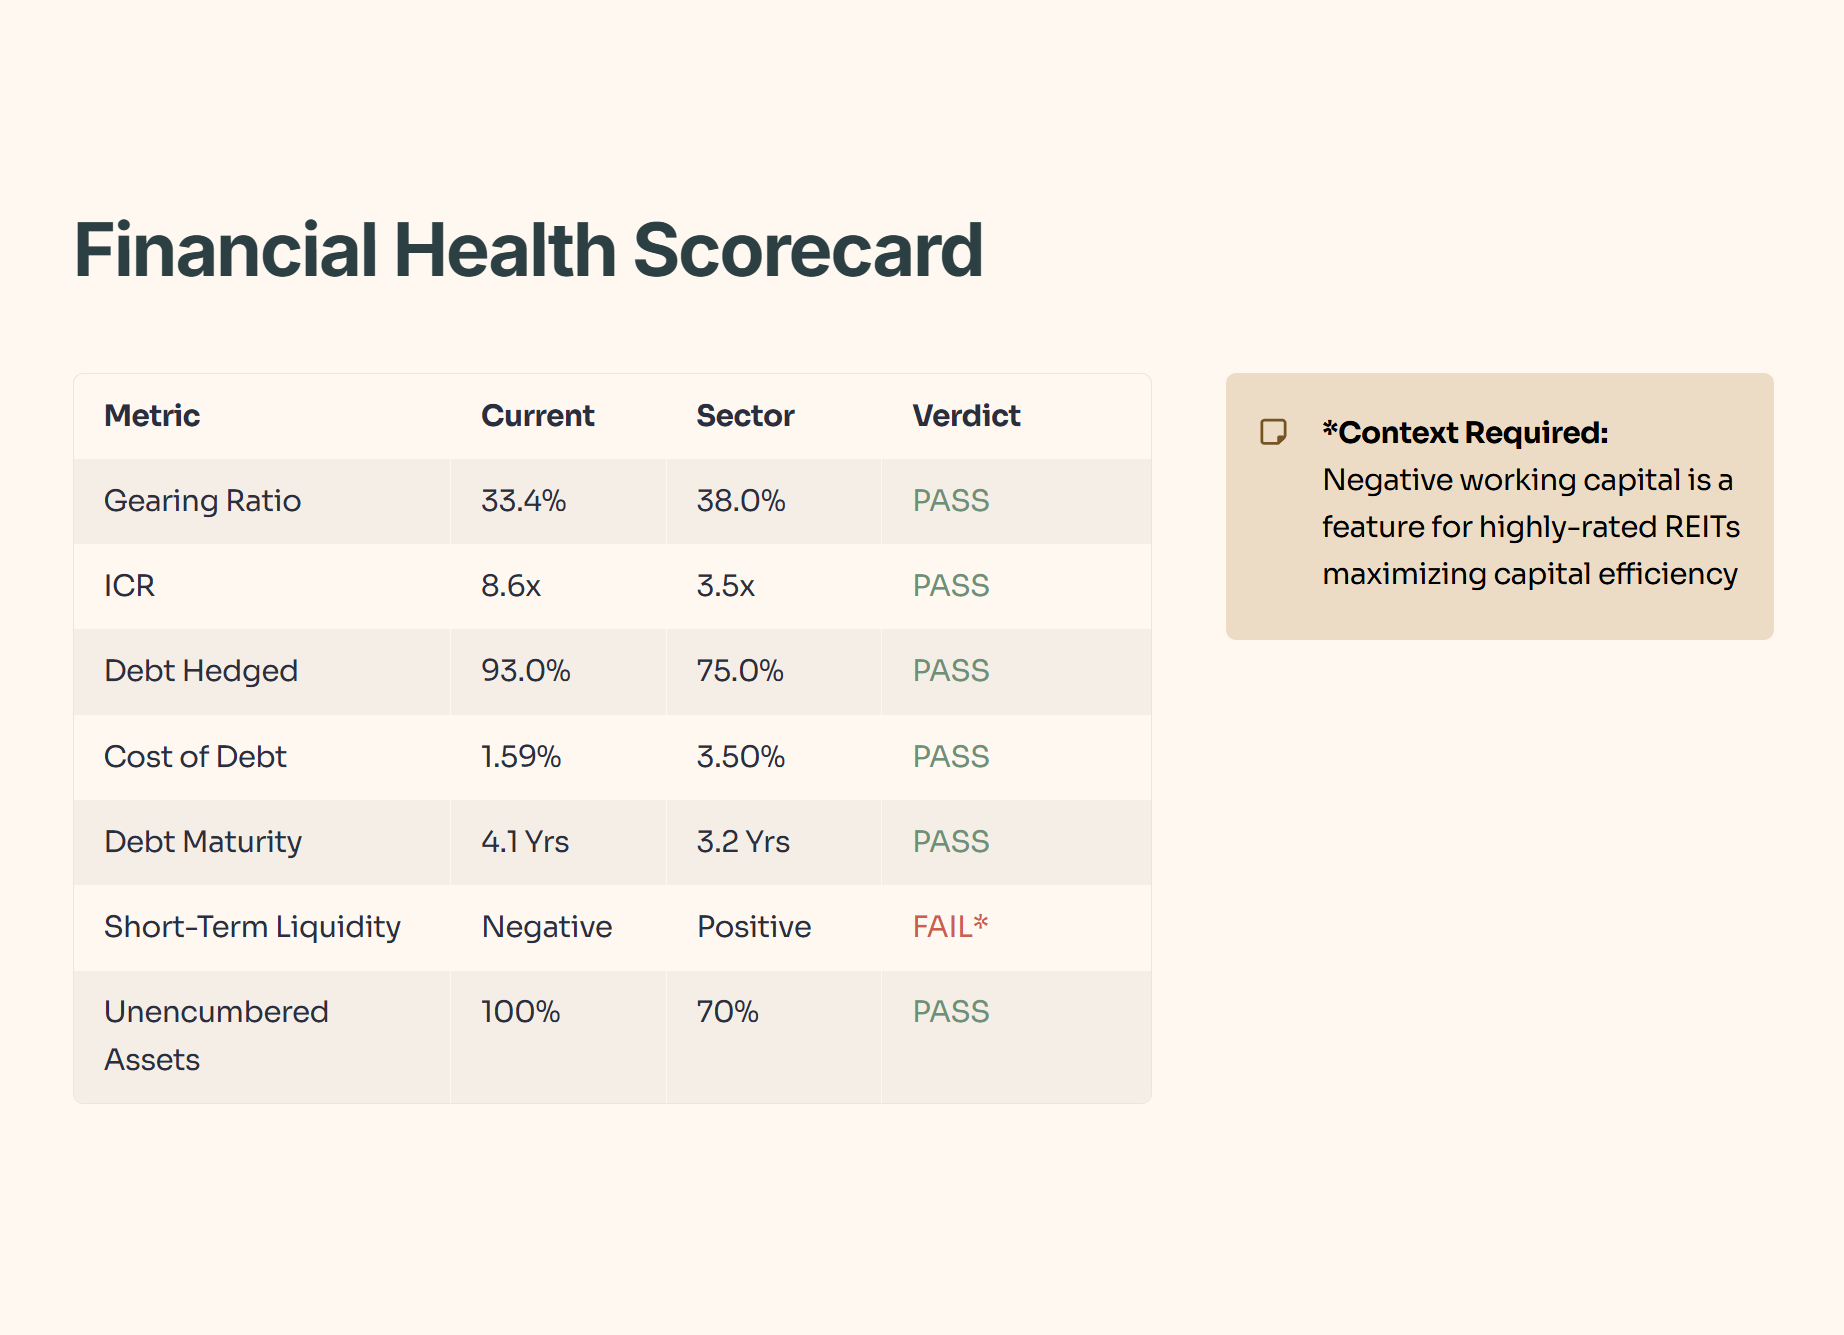
Raw Fact: PLife REIT operates with an aggregate leverage (gearing) ratio of 33.4% and an Interest Coverage Ratio (ICR) of 8.6x, though InvestingPro notes its short-term obligations exceed liquid assets.
Historical Benchmark: This represents a 1.4 percentage point YoY improvement from their 34.8% gearing at the end of 2024, demonstrating active, structural deleveraging over the past 12 months.
Peer Context: Compared to its closest regional peer, First REIT, which sits at a strained 41.2% gearing and a marginal 3.7x ICR, PLife REIT is operating in a completely different galaxy of financial safety.
Forward Scenario: If global interest rates deteriorate and spike by another 10%, PLife REIT’s 93% fixed-rate debt hedging wall protects its near-term cash flows from immediate damage. Conversely, if borrowing conditions improve by 10%, the trust has immense debt headroom to immediately acquire new assets in Europe or Japan without breaching MAS statutory limits.
Wallet Impact: For a Singaporean investor aged 50+ managing CPF and SRS funds, this specific capital structure means you are heavily insulated against the dreaded “rights issue trap.” The REIT does not need to dilute your holdings to pay down toxic debt.
Financial Health Checklist
🎓 Educational Note: Short-Term Liquidity and Negative Working Capital
Short-term obligations exceeding liquid assets means the cash in the bank today isn’t enough to pay all the bills due in the next 12 months.
The Metaphor: Imagine a successful chicken rice seller who doesn’t keep piles of cash under his mattress. Instead, every evening, he uses his daily profits to immediately pay off his supplier lines or buy more equipment. He has “negative working capital,” but because his business is so reliable, the bank is always happy to extend him a new line of credit the next morning.
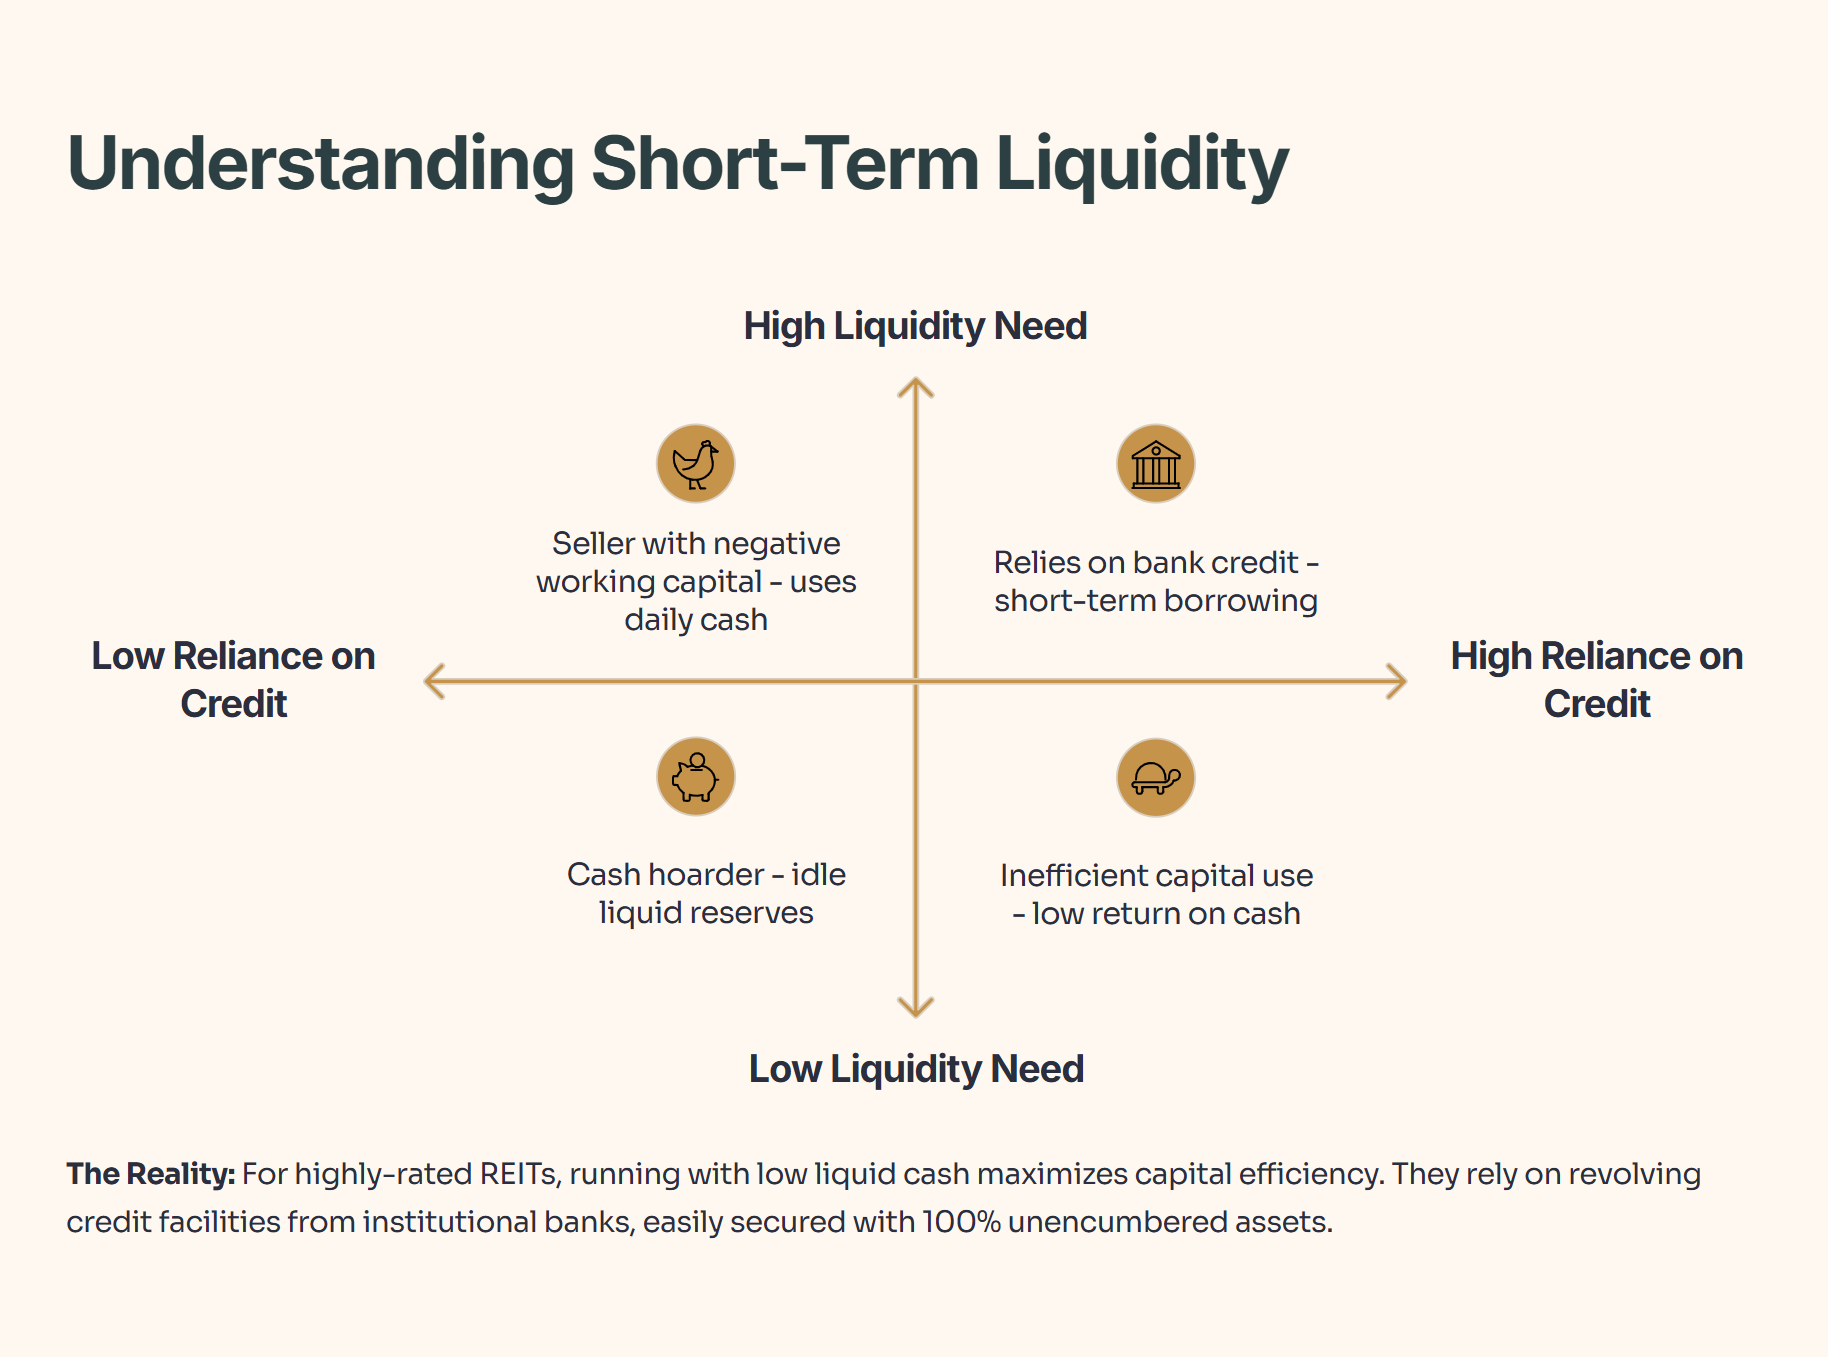
So what does this mean for you? For a highly-rated REIT, running with low liquid cash is a feature, not a bug. It means they are aggressively maximizing capital efficiency rather than letting cash sit idle. They rely on revolving credit facilities from institutional banks to roll over short-term debt, which is easily secured given their 100% unencumbered asset base.
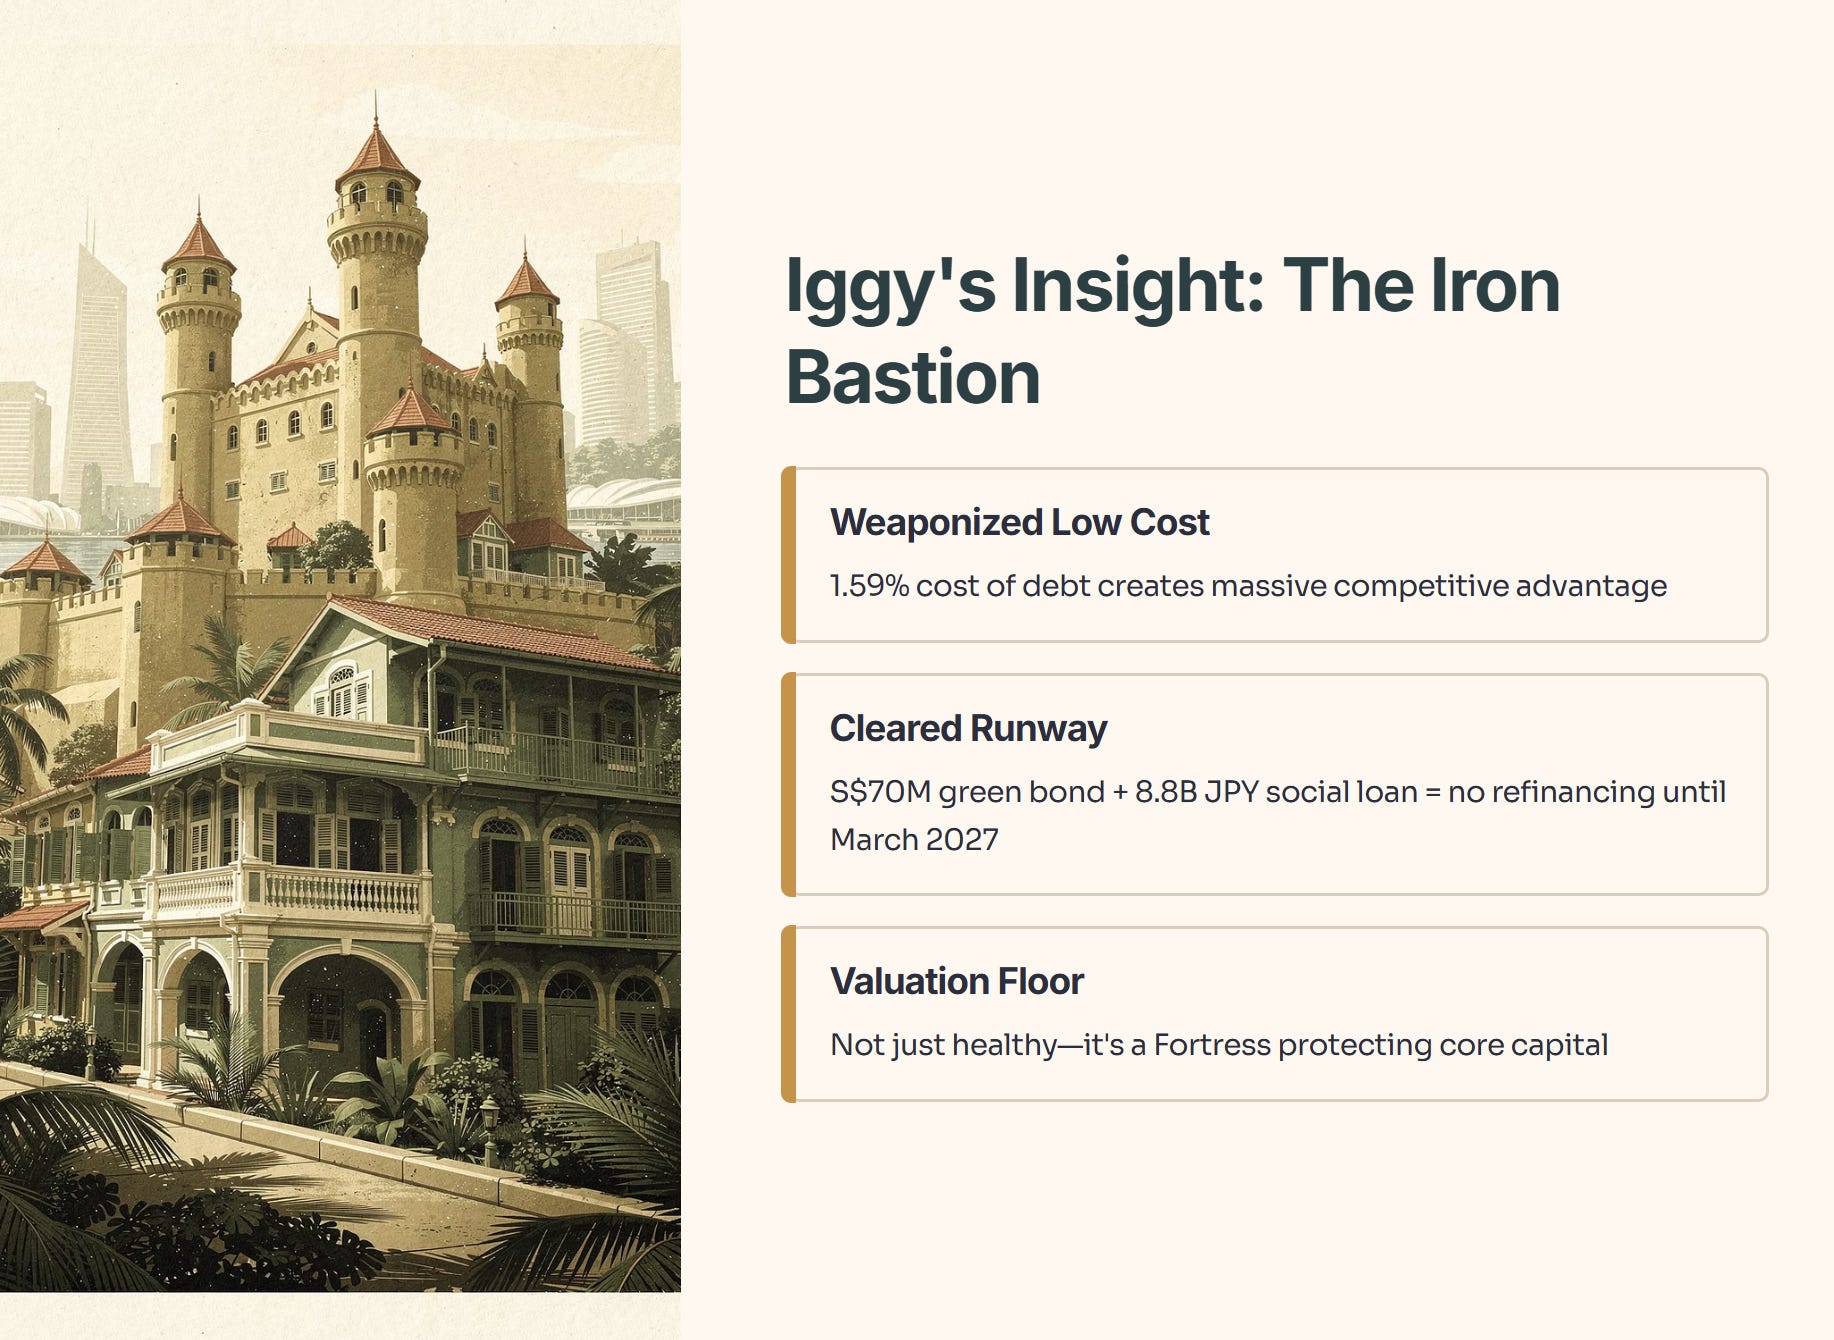
🦎 Iggy’s Insight: When conducting this Audit, I am looking for an Iron Bastion. While the algorithmic flag regarding short-term obligations is technically accurate, human context is required. The trust has effectively weaponized its low 1.59% cost of debt. By finalizing the S$70 million green bond and the 8.8 billion JPY social loan in February 2026, they have completely cleared their refinancing runway until March 2027. This is not just a healthy balance sheet; it is a Fortress. They have successfully built a massive Floor under their valuation, ensuring that even if algorithmic models scream danger, the core capital remains pristine.
3. Step 2: The Wealth Check (Cash Flow & Yield)
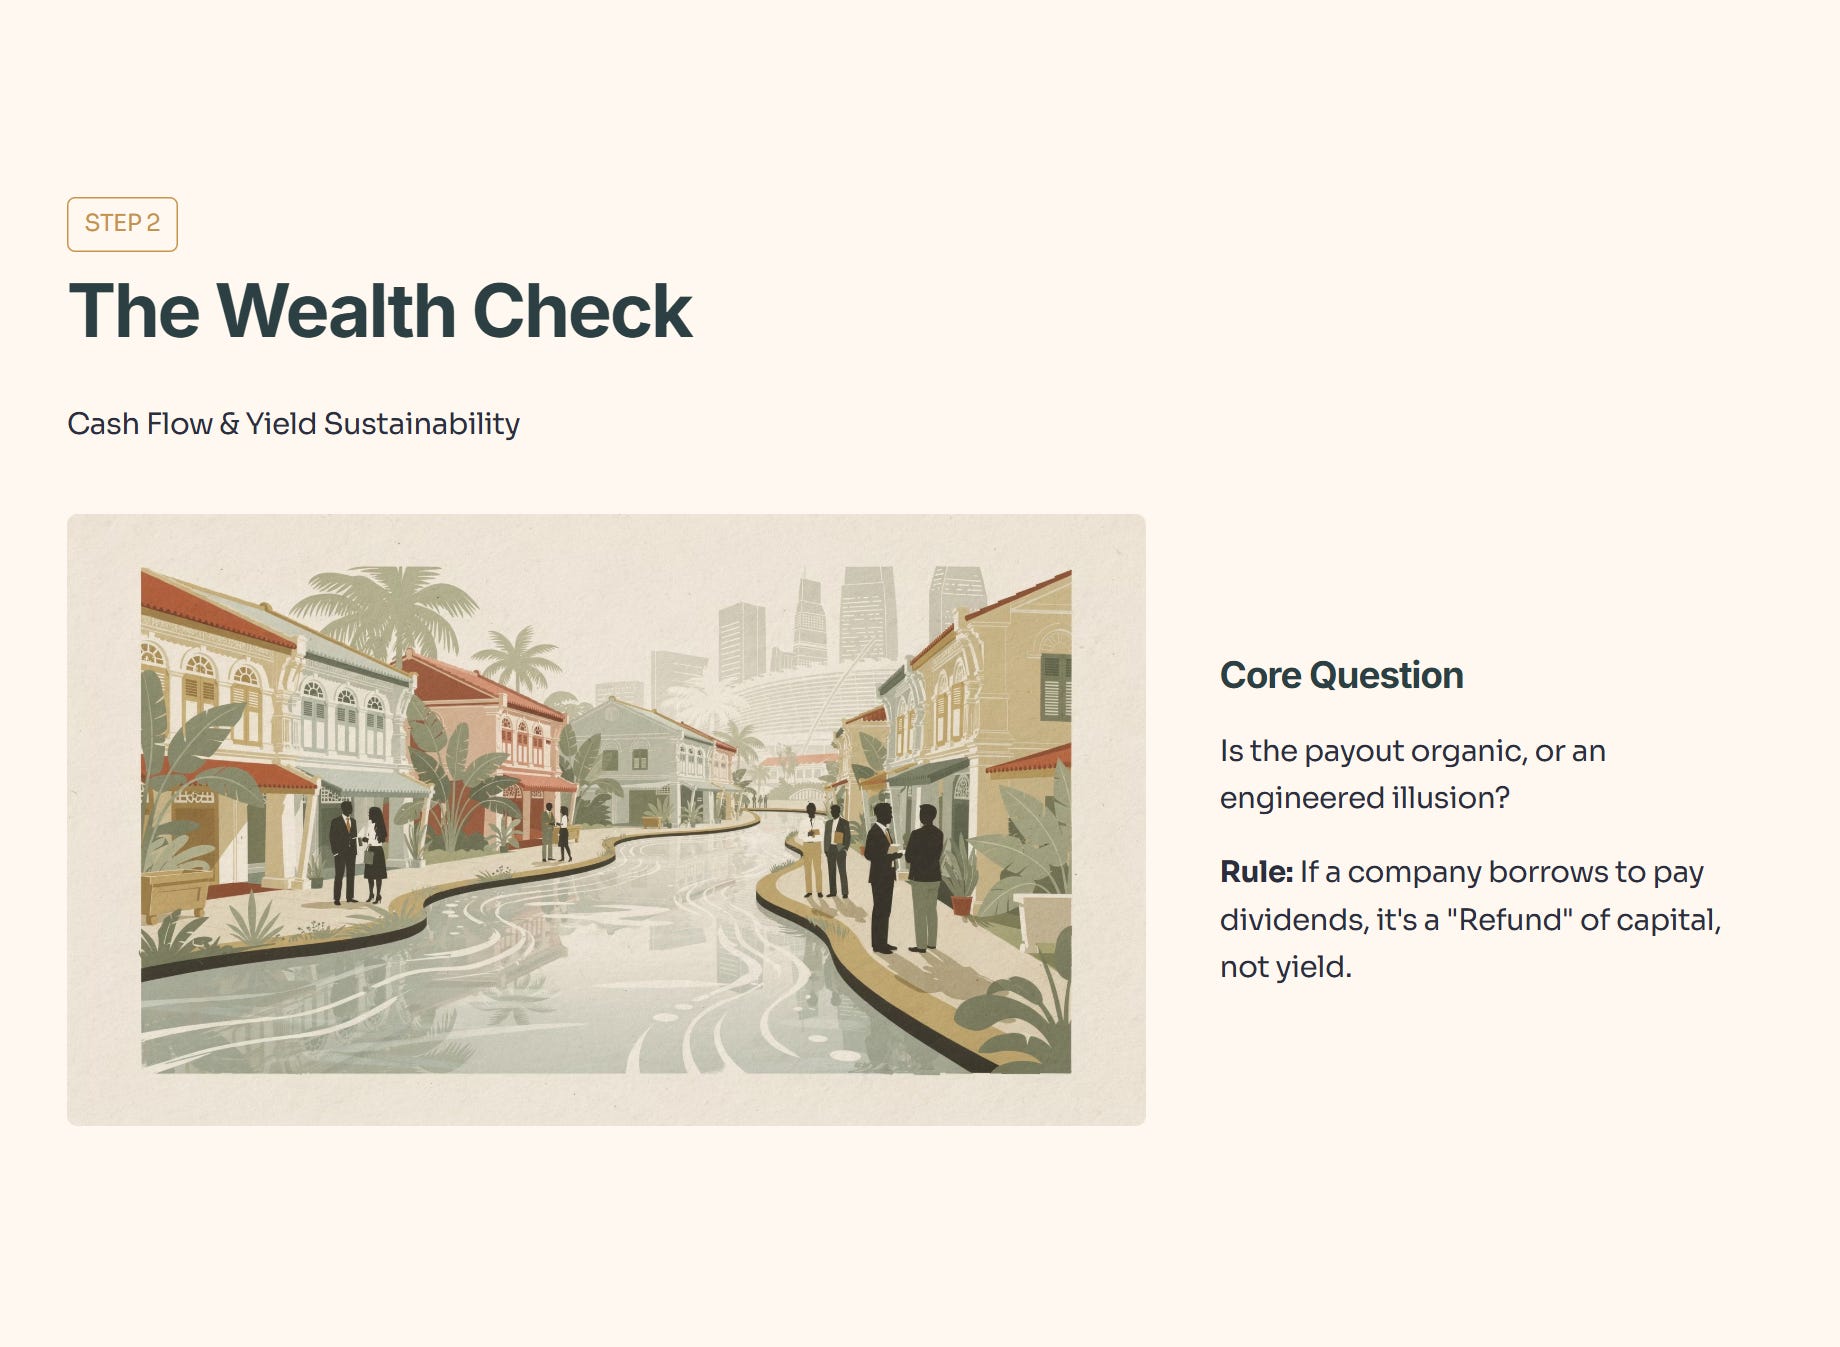
It is time to look at the wealth generation. Is the payout organic, or is it an engineered illusion? We must focus on Free Cash Flow and Payout Ratios. Remember our core rule: If a company borrows to pay a dividend, it is a “Refund” of capital, not a yield.
The Five-Layer Audit: Free Cash Flow and Distribution Sustainability
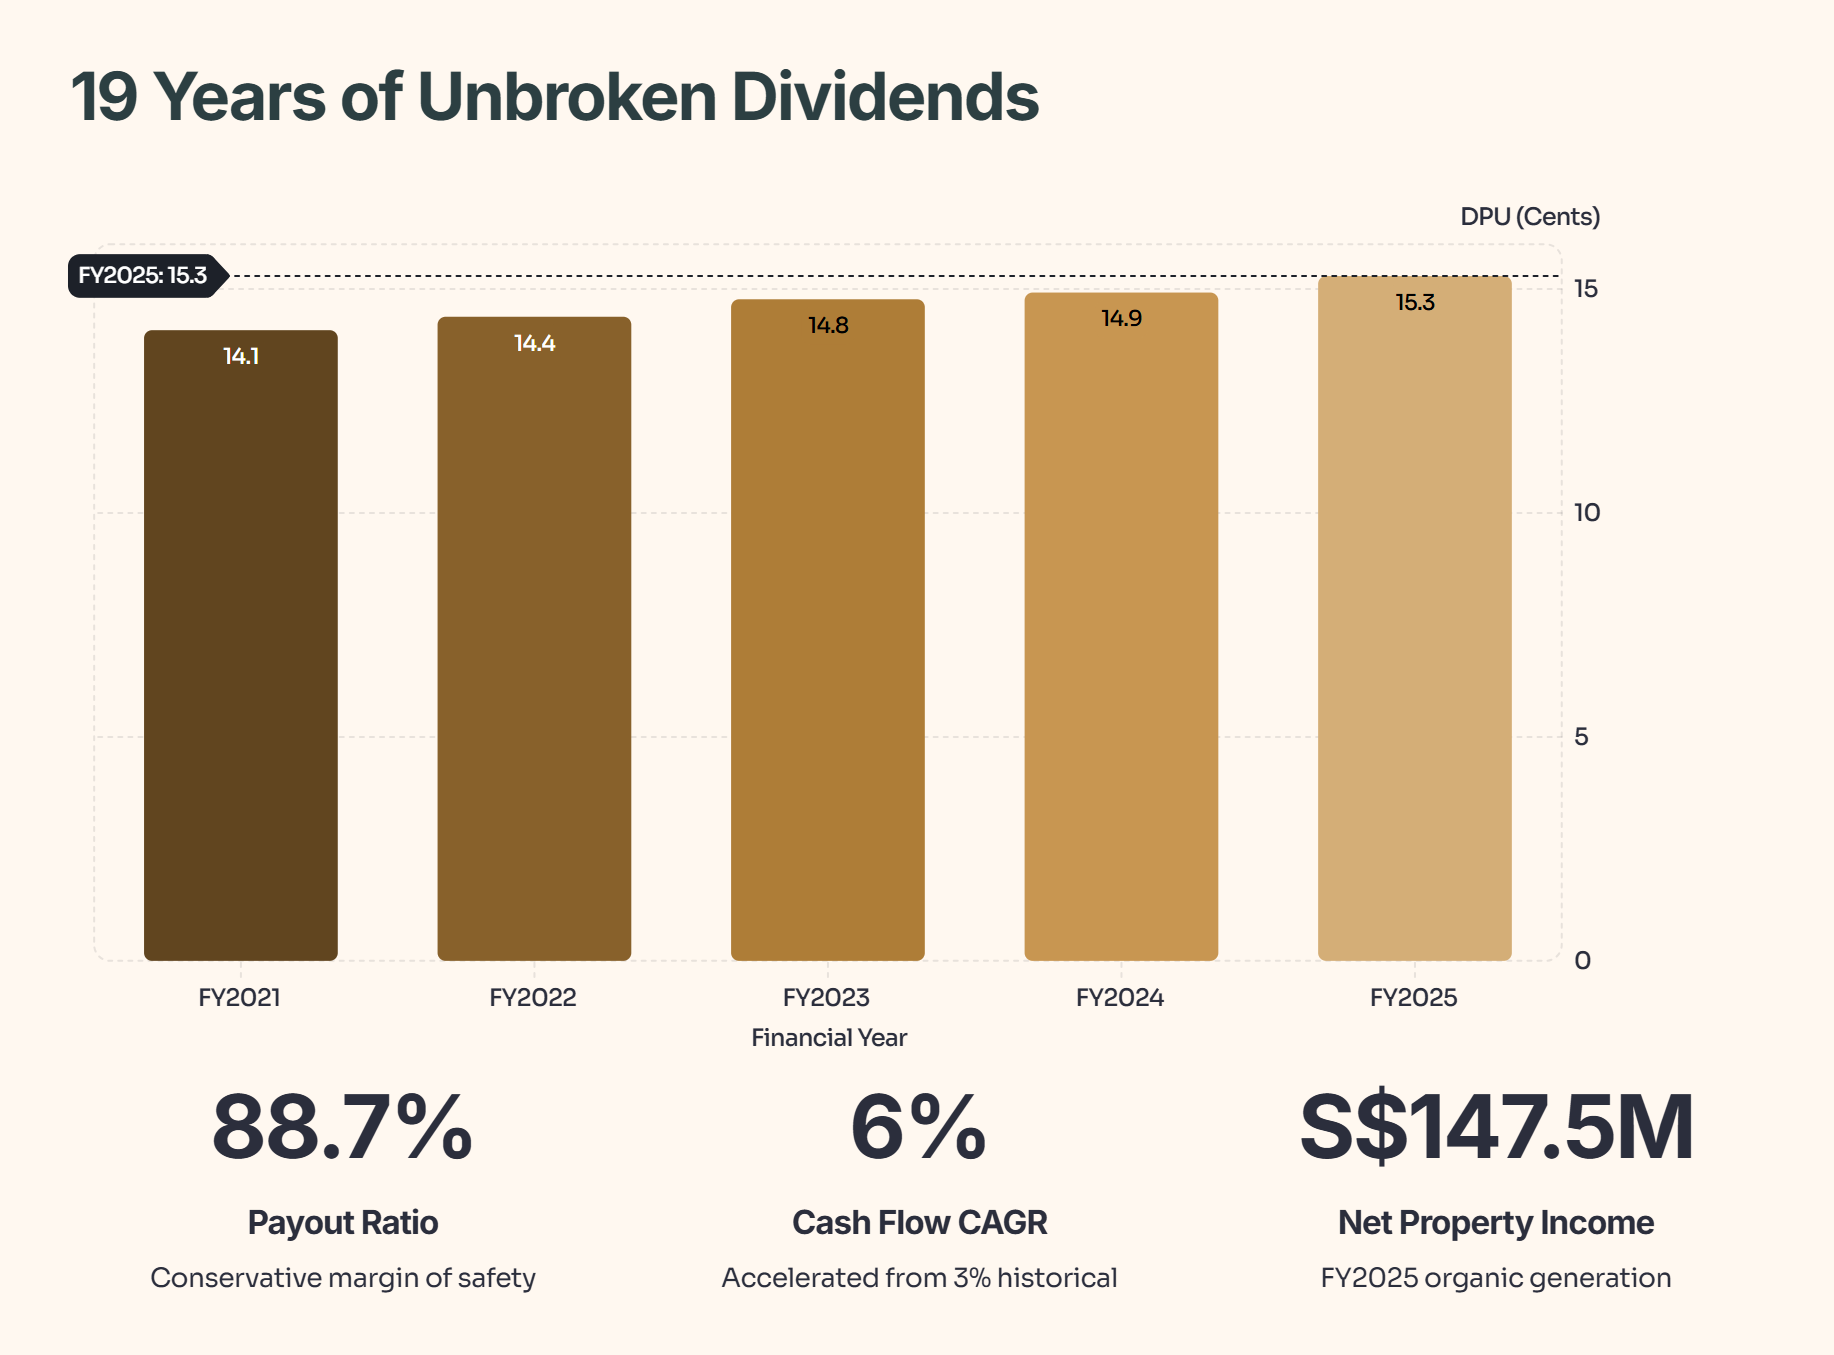
Raw Fact: PLife REIT has maintained its dividend payments for an astonishing 19 consecutive years, generating S$147.5 million in Net Property Income (NPI) for FY2025.
Historical Benchmark: The trust’s operating cash flow has compounded at an accelerated 6% annually over the last three years, up from a 10-year historical average of just 3%.
Peer Context: While First REIT boasts a mathematical yield of 8.8%, it is paying out nearly 100% of its usable cash to maintain the facade. PLife REIT maintains a conservative 88.7% payout ratio, leaving a wide margin of safety.
Forward Scenario: If hospital revenues improve 10% next year, the variable rent component of the lease captures the upside, flowing directly into distributable cash without incurring additional operational friction. If Japanese nursing home revenues deteriorate by 10%, the “up-only” lease ratchets protect the downside, keeping the cash flow entirely intact.
Wallet Impact: For the CPF/SRS investor, an 88.7% payout ratio backed by 19 years of consecutive payments means the dividend is fully funded by organic rent collection. You are receiving pure, untainted passive income that can reliably compound over your retirement horizon.
Dividend and Payout Trajectory
🎓 Educational Note: Free Cash Flow (FCF) vs Dividend Payout Ratio
FCF is the actual, physical money left over after paying all bills, debt servicing, and maintenance. The Payout Ratio is the percentage of that leftover cash handed to investors.
The Metaphor: Think of our chicken rice seller again. Net profit is the theoretical number the accountant writes down. Free Cash Flow is the physical stack of SGD notes in the cash register at closing time. The payout ratio is how much of that physical cash he takes home to feed his family versus leaving in the register for tomorrow’s operations.
So what does this mean for you? A payout ratio well under 90% means the REIT is generating far more physical cash than it is handing out. It is not dipping into emergency savings or taking desperate bank loans to pay your quarterly dividend.
🦎 Iggy’s Insight:
This cash flow profile is the ultimate definition of organic wealth. We are seeing a widening NPI margin, meaning revenue is scaling significantly faster than property-level expenses. The recent acquisition of the freehold nursing home portfolio in France acts as a powerful new engine, heavily supported by IRAS tax transparency approvals. The fact that the stock generally trades with low price volatility is a direct reflection of this 19-year unbroken cash flow track record. The dividend is safe, sustainable, and purely derived from physical rent collection.
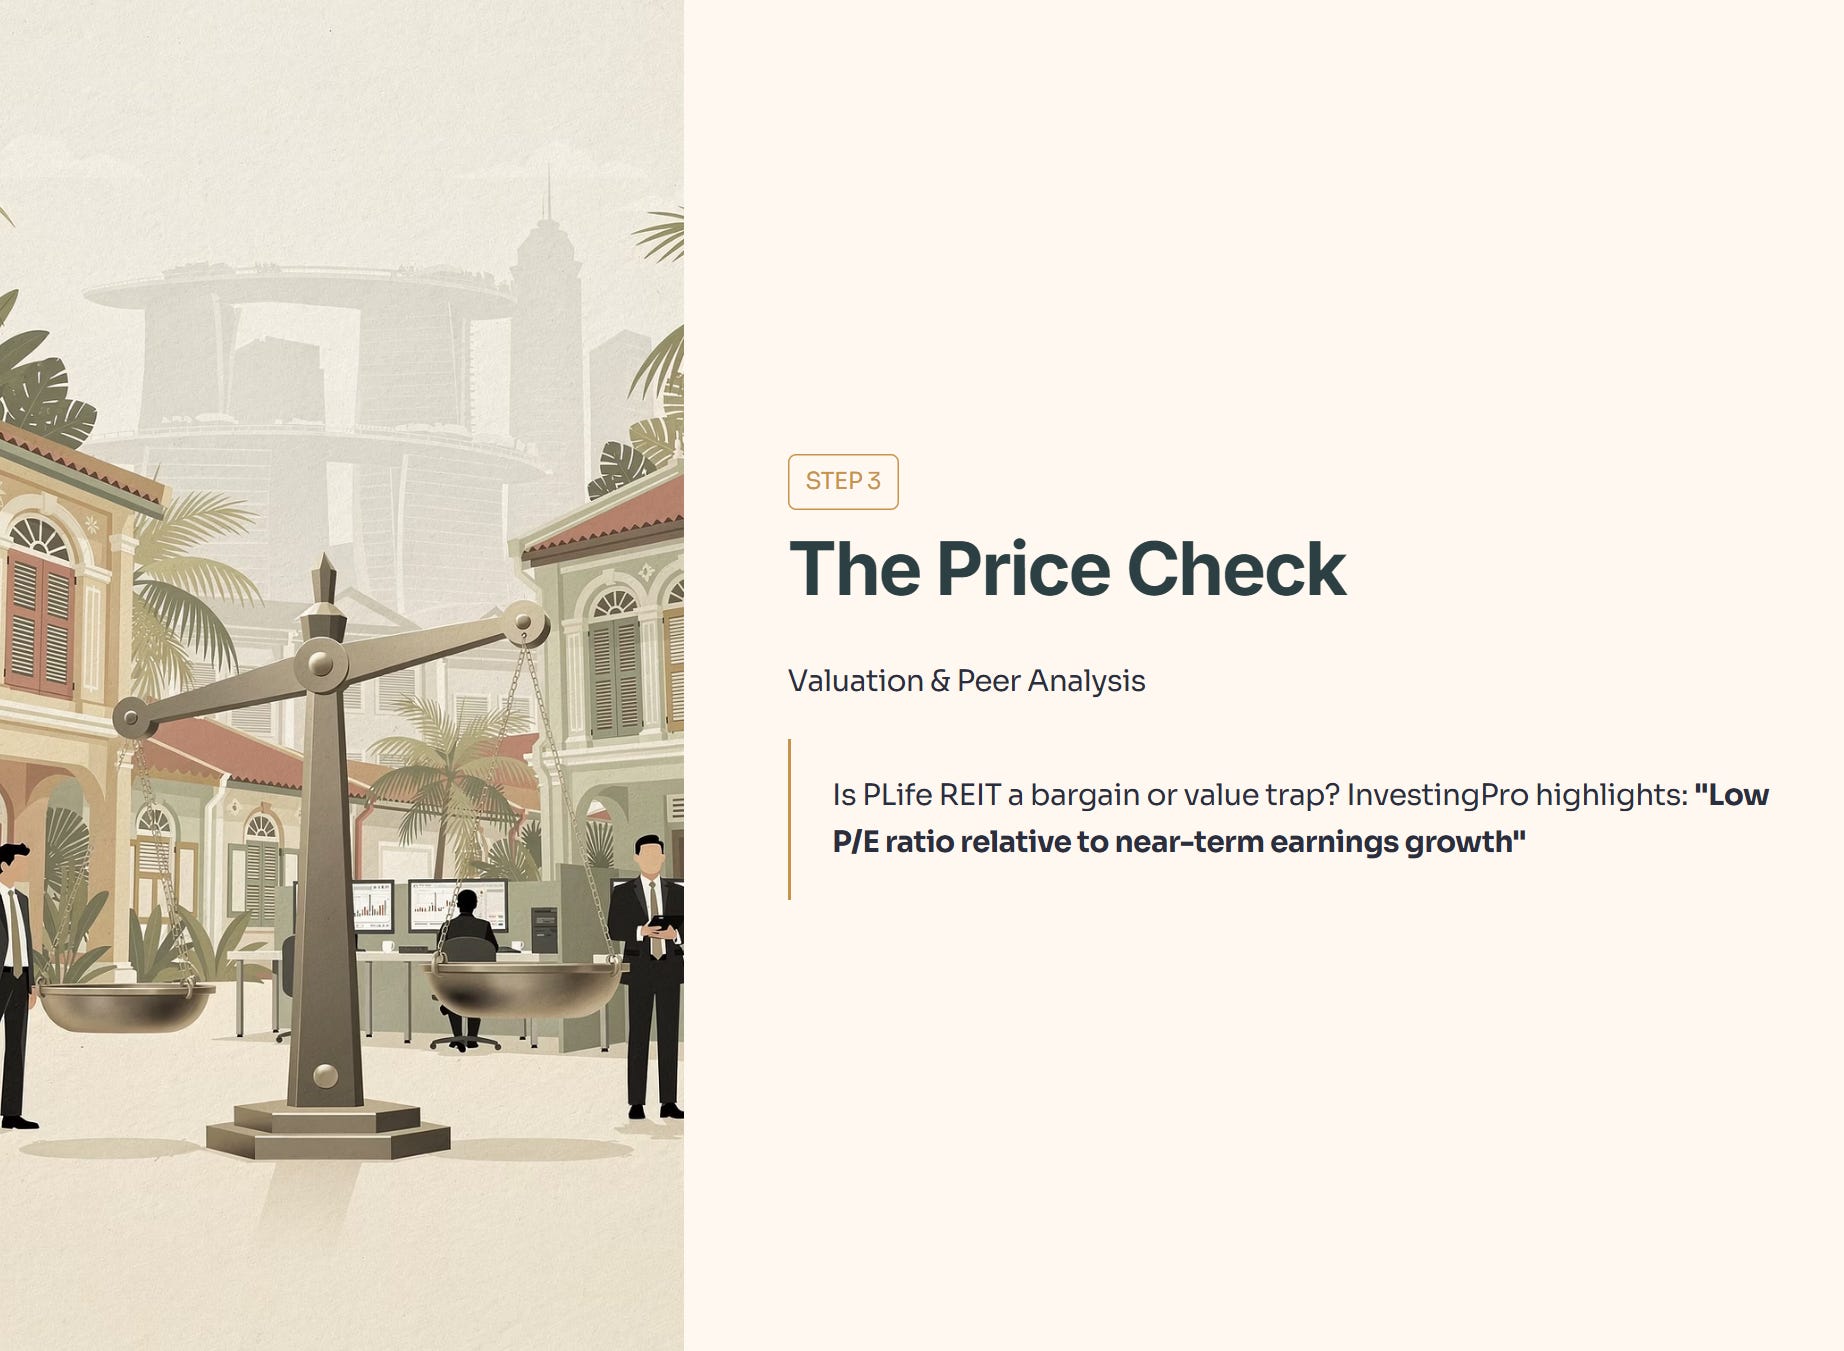
4. Step 3: The Price Check (Valuation & Peers)
Is PLife REIT a bargain, or is it a value trap? We use P/E and P/B vs. regional peers to find the “Forensic Gap”. This is where the InvestingPro data becomes critical.
The Five-Layer Audit: Valuation Multiples and Yield Spreads
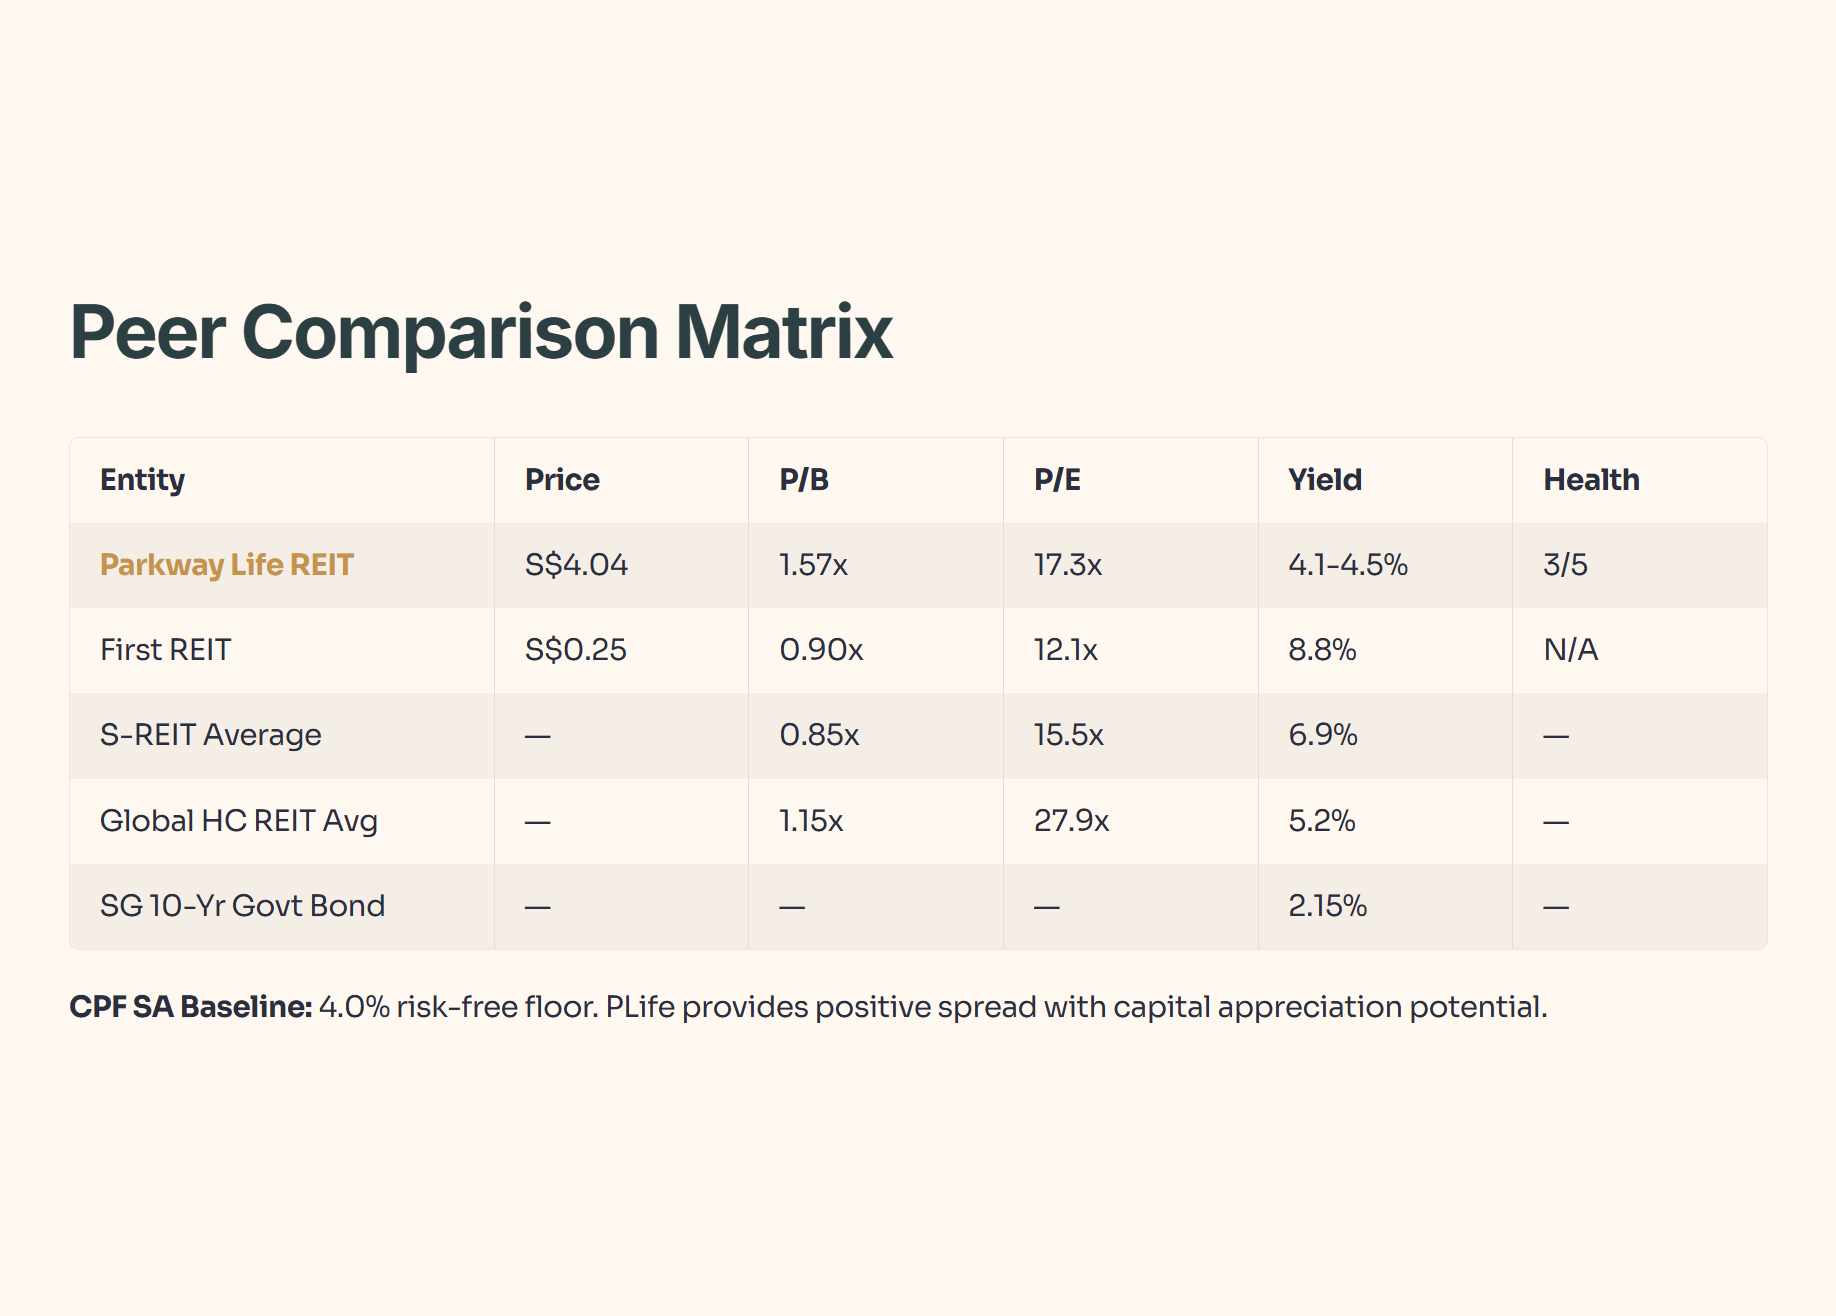
Raw Fact: PLife REIT trades at a price of S$4.04, with a Price-to-Book (P/B) multiple of approximately 1.57x, but InvestingPro highlights it is trading at a “low P/E ratio relative to near-term earnings growth”.
Historical Benchmark: The trust has historically maintained an average P/B ratio of 1.49x over a multi-year horizon; the current slight premium is mathematically justified by the impending FY2026 rent step-up catalyst.
Peer Context: The broader Global Health Care REITs industry average trades at a hefty P/E of 27.9x, making PLife REIT’s ~17.3x P/E look fundamentally cheap on an earnings basis, even if the P/B looks visually stretched compared to standard retail REITs.
Forward Scenario: If the institutional market rerates the S-REIT sector up by 10% as global yields drop, PLife REIT’s valuation premium will likely expand further due to its scarcity value and “bond-proxy” status. If the market deteriorates 10%, its sovereign-equivalent client base prevents severe capital flight, maintaining its low price volatility.
Wallet Impact: For an investor utilizing the CPF Special Account (SA) at 4.0% as a baseline, acquiring PLife at a ~4.1% to 4.5% forward yield provides a direct positive spread over your guaranteed government rate, while simultaneously retaining long-term capital appreciation potential.
Peer Comparison Table
🎓 Educational Note: Price-to-Earnings (P/E) vs Price-to-Book (P/B)
P/B compares the stock price to the literal break-up value of the physical bricks and land. P/E compares the stock price to the actual profits generated by those bricks.
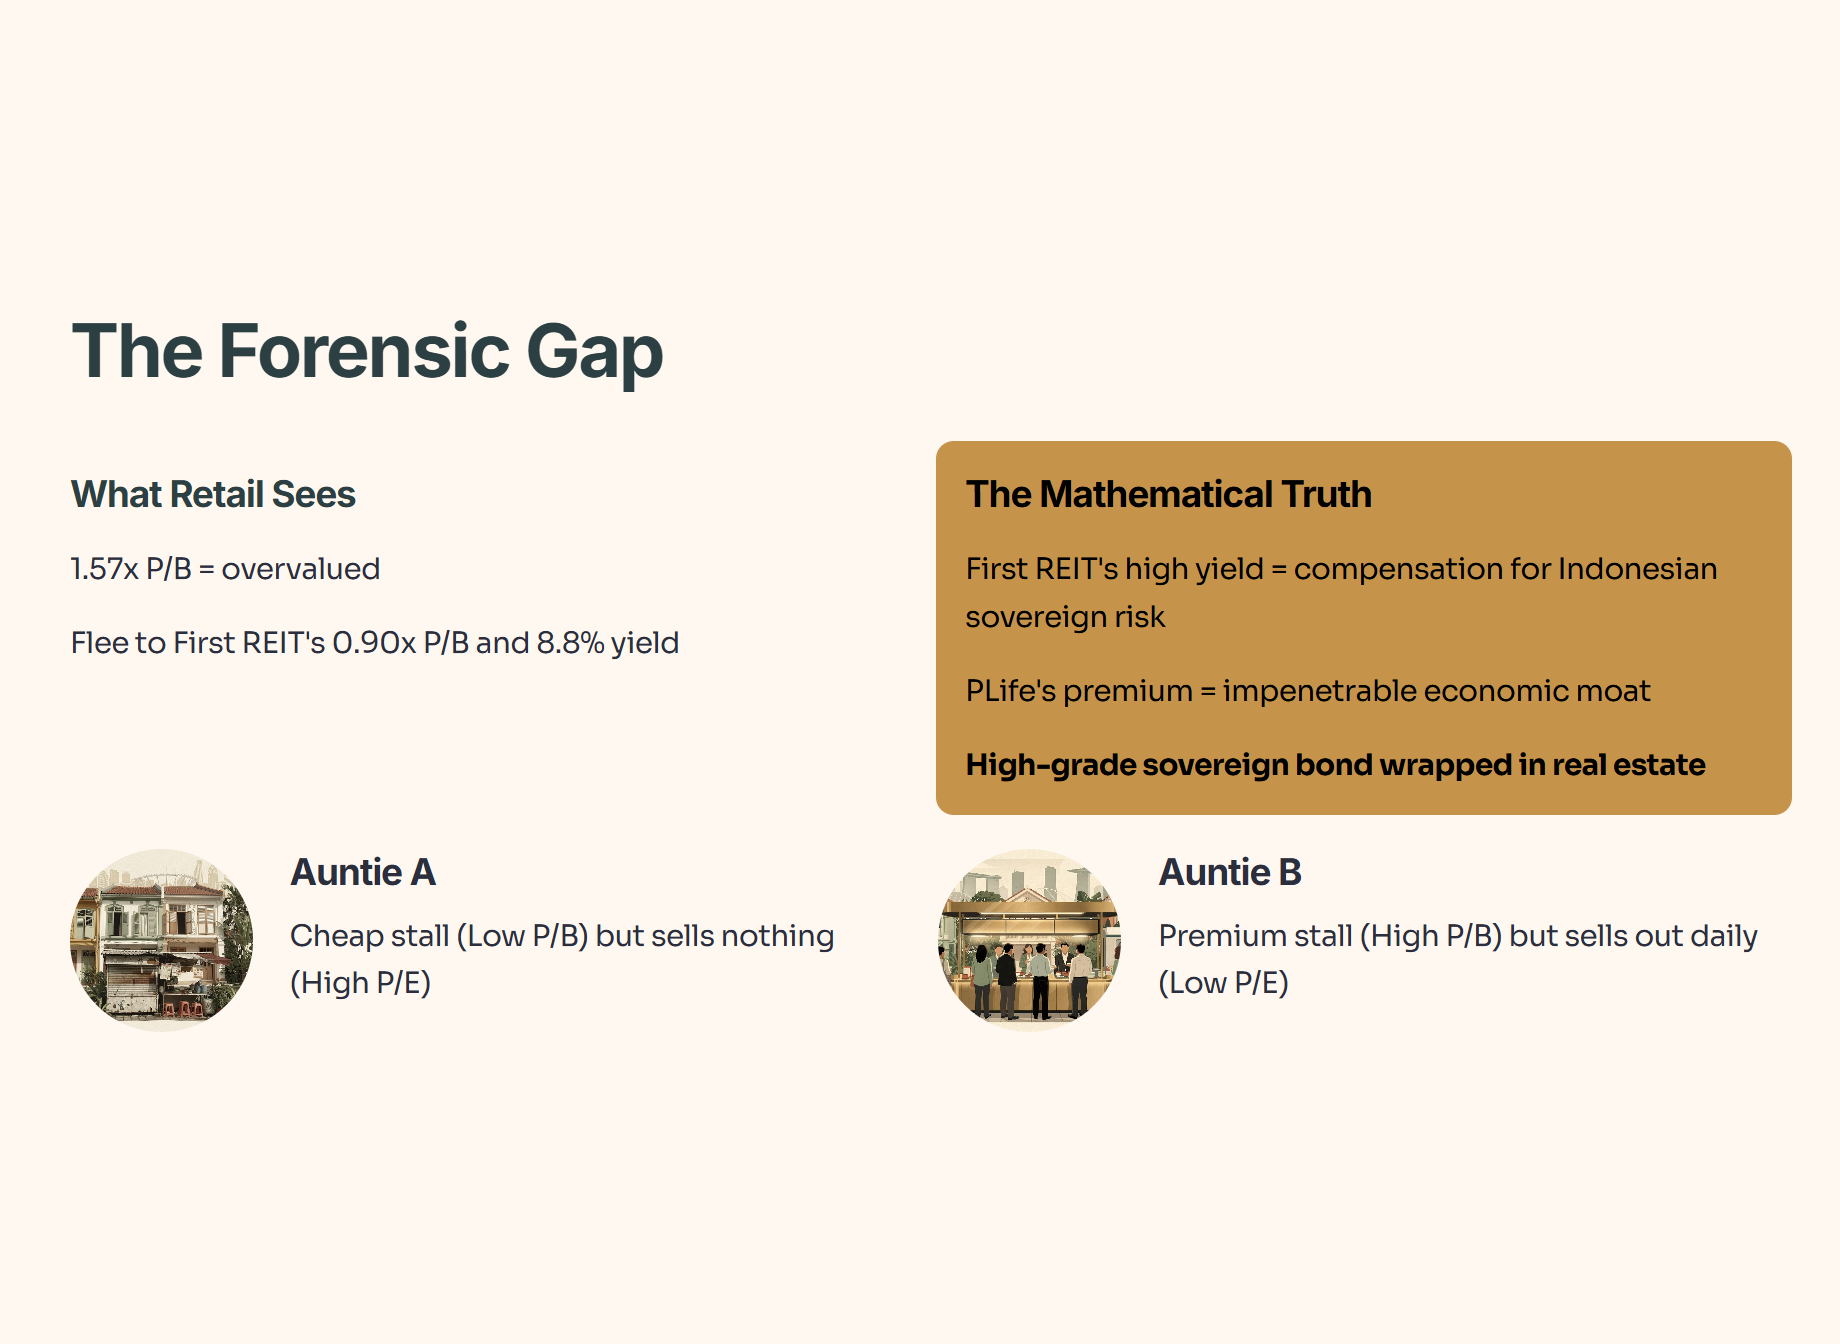
The Metaphor: Imagine two neighborhood aunties. Auntie A owns a cheap, rundown stall (Low P/B) but sells no noodles (High P/E). Auntie B paid a massive premium for a stall at a prime MRT station (High P/B), but she sells out her chicken rice by 11 AM every day, generating massive cash (Low P/E).
So what does this mean for you? Algorithms often punish PLife REIT for its High P/B, but as InvestingPro rightly points out, it is trading at a “low P/E ratio relative to near-term earnings growth”. You are paying a premium for the stall, but the earnings generated from it justify the price tag.
🦎 Iggy’s Insight:
Here is where we spot the Forensic Gap. Retail investors see a 1.57x P/B ratio and run away in terror, thinking it is severely overvalued. They flock to First REIT at a 0.90x P/B to chase an 8.8% yield illusion. But the mathematical Truth is different. First REIT’s high yield is merely mathematical compensation for Indonesian sovereign risk and high debt costs. PLife REIT’s valuation premium is the market correctly pricing in an impenetrable economic moat. It is a high-grade sovereign bond wrapped in a real estate vehicle.
5. Step 4: The Future Check (Scenarios & Fair Value)
How does this asset align with our “Safety First” pillar over the next decade? The most critical variable is the impending FY2026 rent reversion, and this is exactly where the algorithmic models are fundamentally breaking down.
The Five-Layer Audit: The FY2026 Rent Reversion Catalyst and Fair Value Divergence
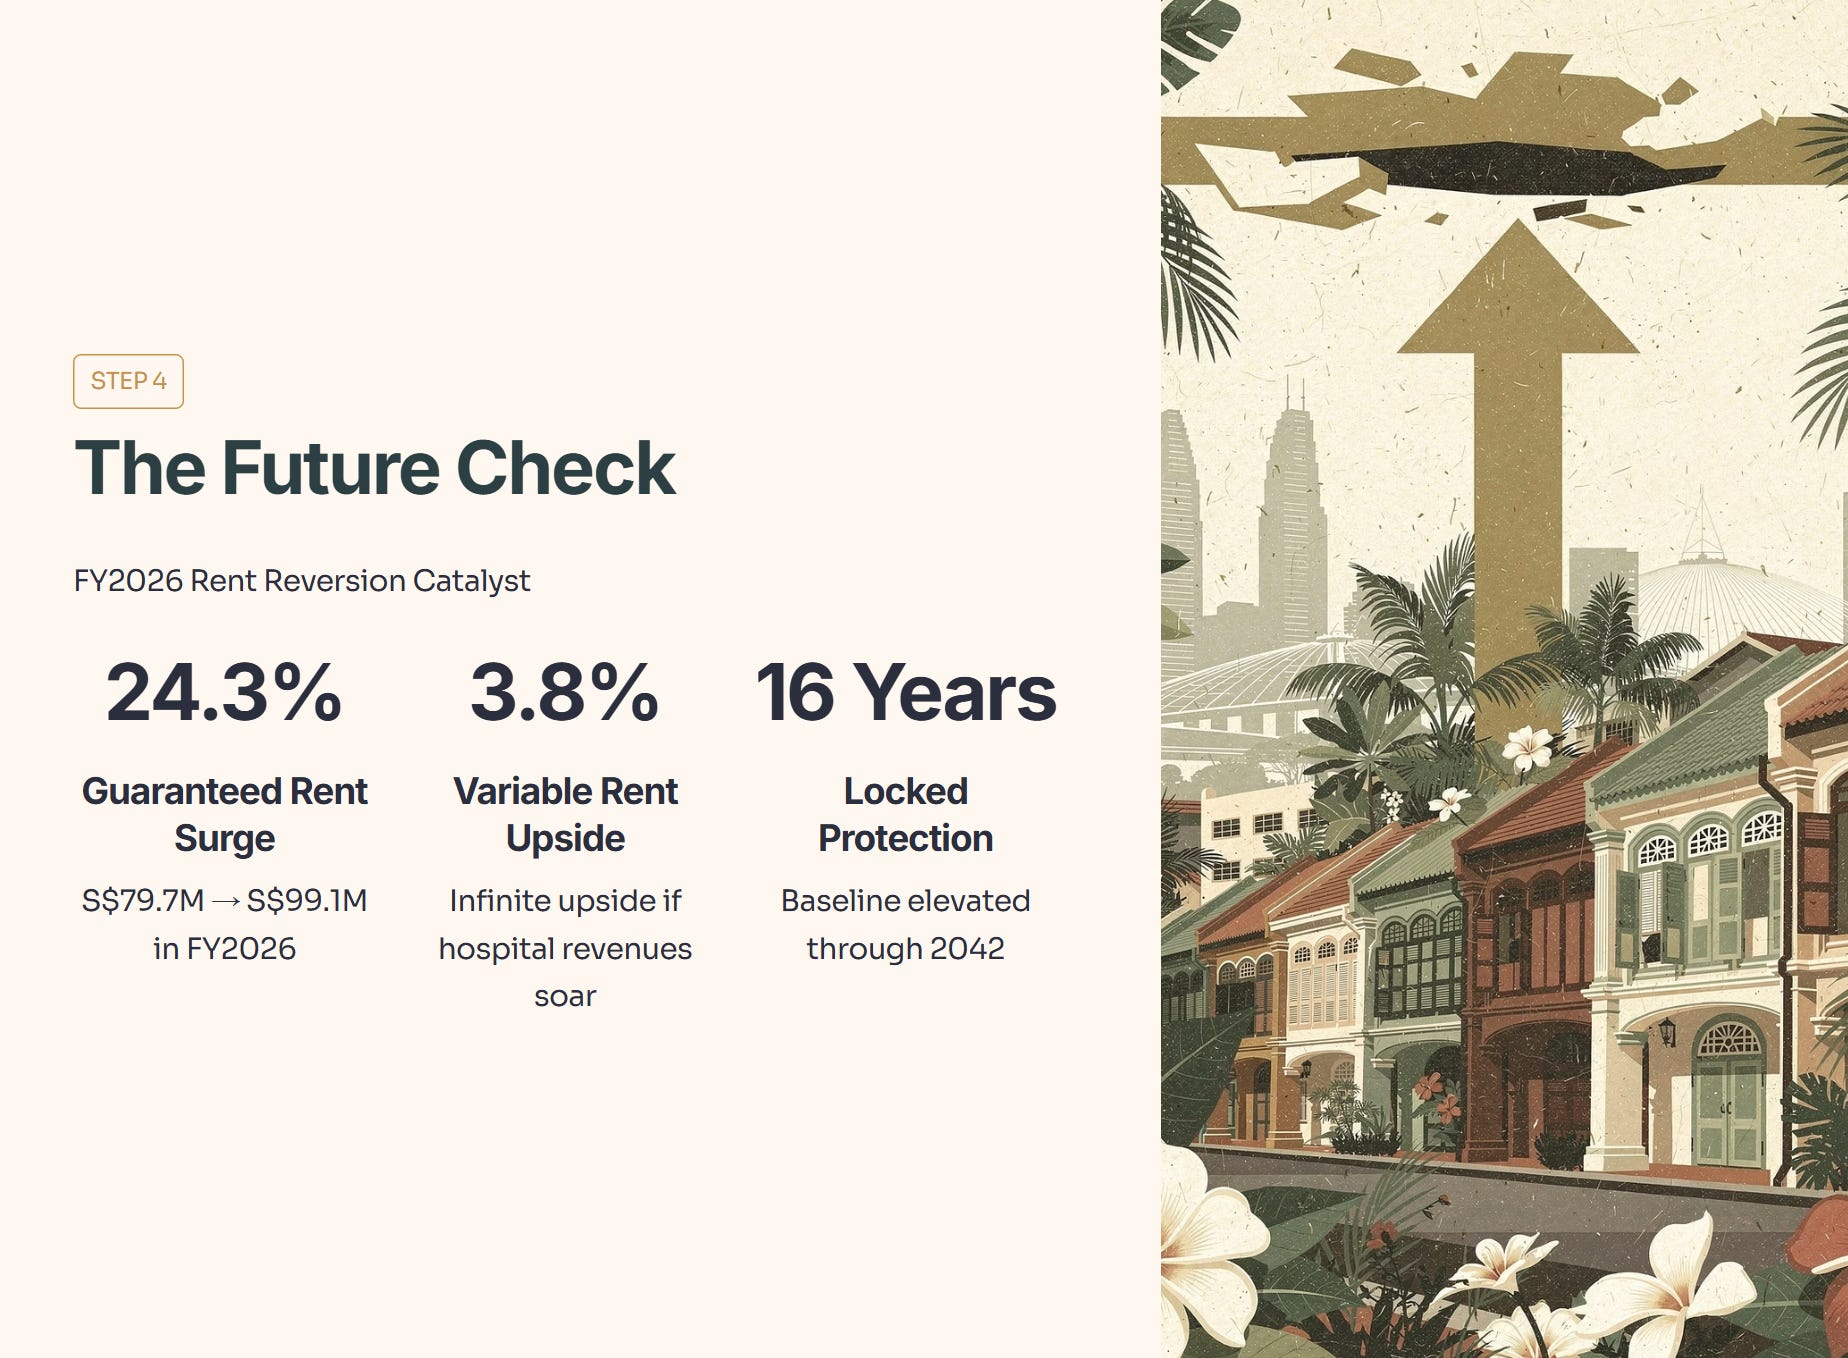
Raw Fact: Minimum guaranteed rent from the Singapore hospitals will surge ~24.3%, stepping up from S$79.7 million in FY2025 to S$99.1 million in FY2026.
Historical Benchmark: This is the single largest structural step-up in base revenue in the trust’s operational history since its 2007 IPO, completely dwarfing standard organic growth rates.
Peer Context: While traditional office and retail REITs are currently bleeding concessions and fighting to secure low single-digit rent reversions, PLife REIT has legally locked in a nearly 25% guaranteed absolute increase.
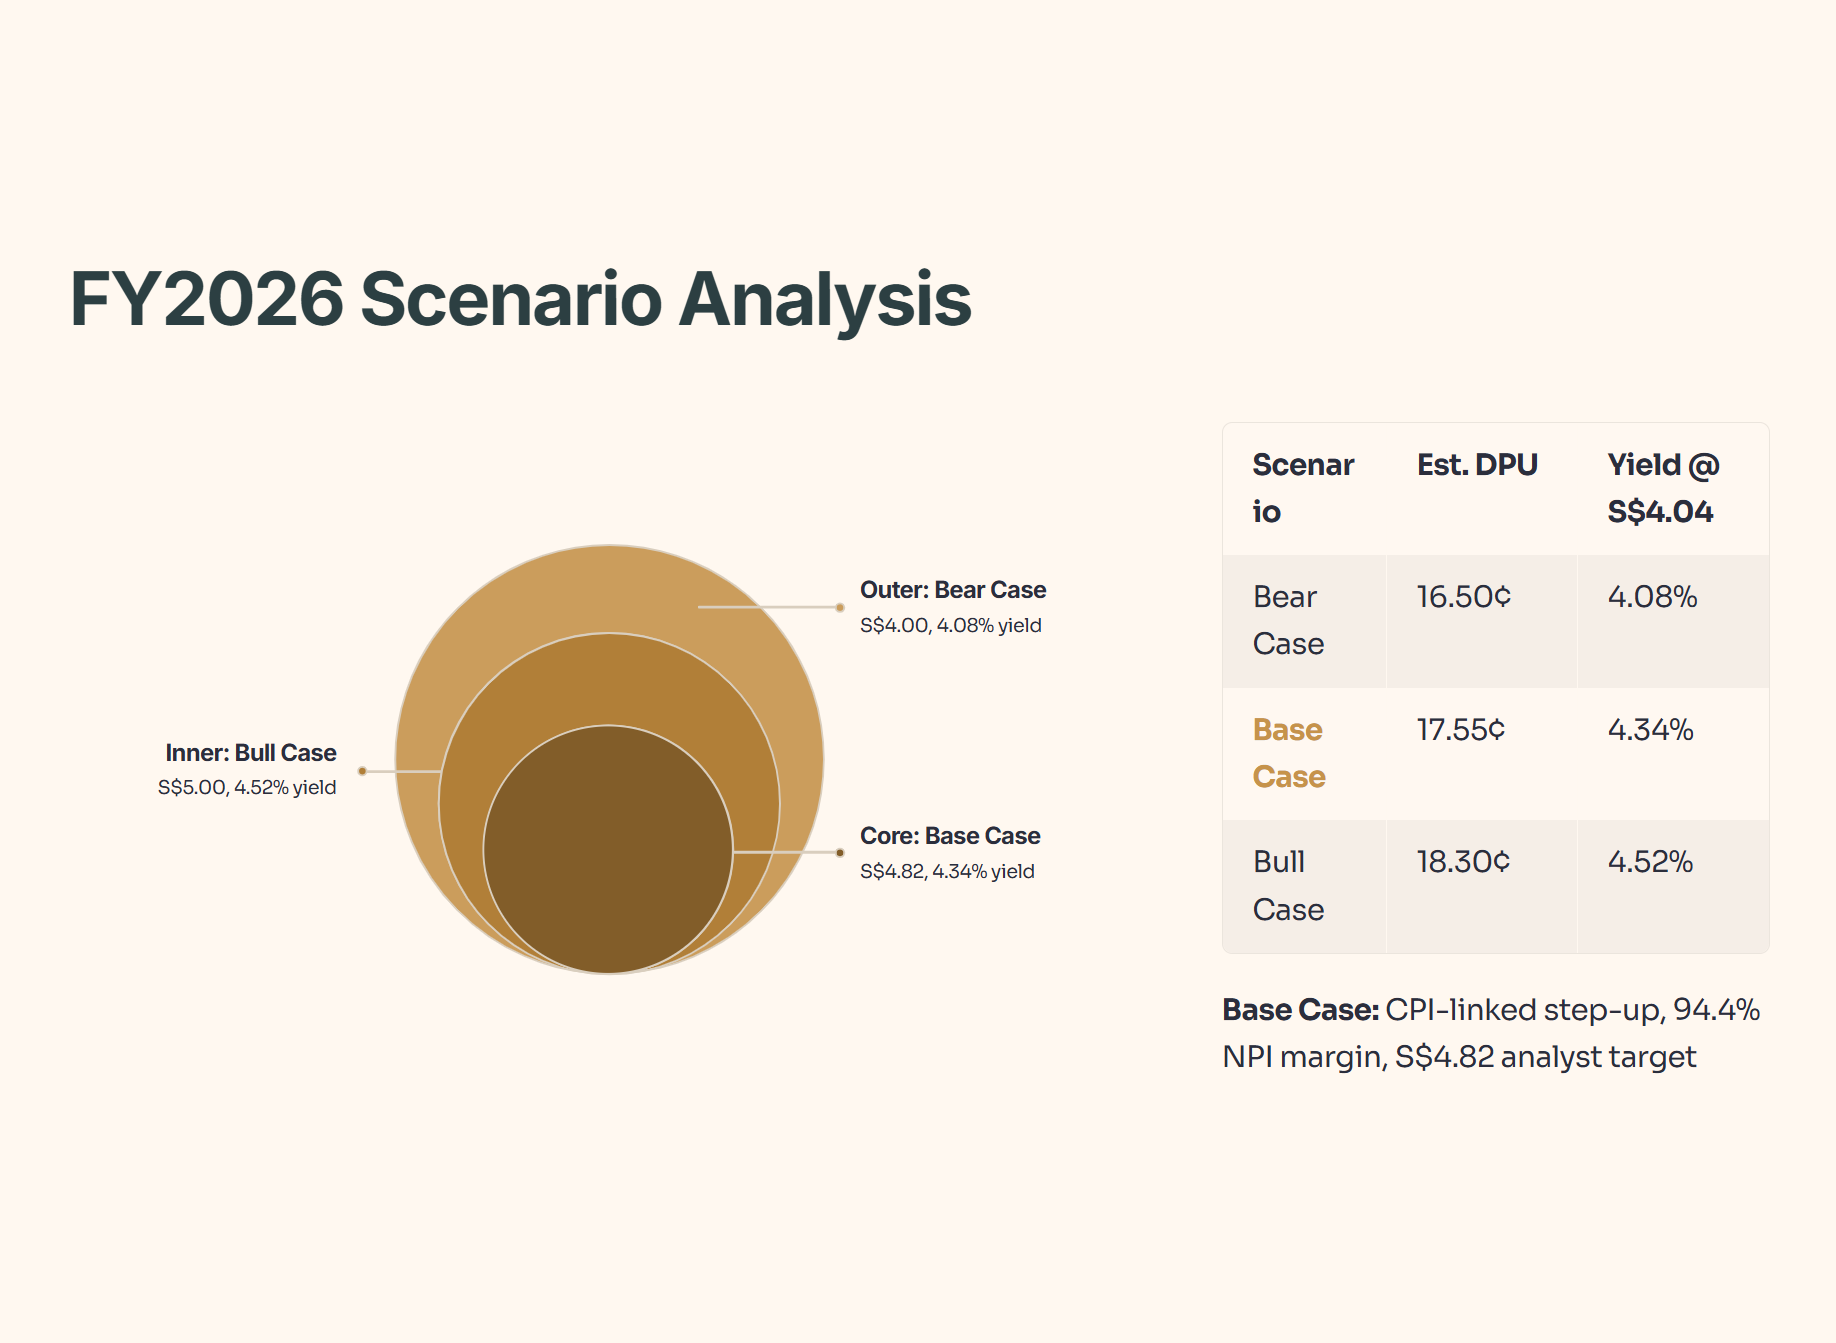
Forward Scenario: In a Bull scenario where Singapore hospital revenues soar due to medical tourism, the 3.8% variable rent kicks in, yielding infinite upside. In a Bear scenario of severe medical deflation, the new S$99.1 million baseline acts as an absolute, unbreakable floor.
Wallet Impact: For the retiree relying on predictable quarterly payouts, this singular event permanently elevates the baseline of your passive income for the next 16 years, heavily insulating your portfolio against domestic inflation and rising living costs.
Sensitivity Matrix (FY2026 Projections)
🎓 Educational Note: Rent Reversion
Rent reversion is the percentage change in rent when an old lease expires and a new one is signed.
The Metaphor: Imagine you are a landlord who rented out an apartment five years ago. Since then, a brand new MRT station opened right downstairs. When the lease is up, you hike the rent by 25%. That sudden, massive jump in your passive income is a positive rent reversion.
So what does this mean for you? A massive 24.3% positive rent reversion means the company’s core earnings are guaranteed to jump overnight, fundamentally increasing the pie from which your quarterly dividends are cut.
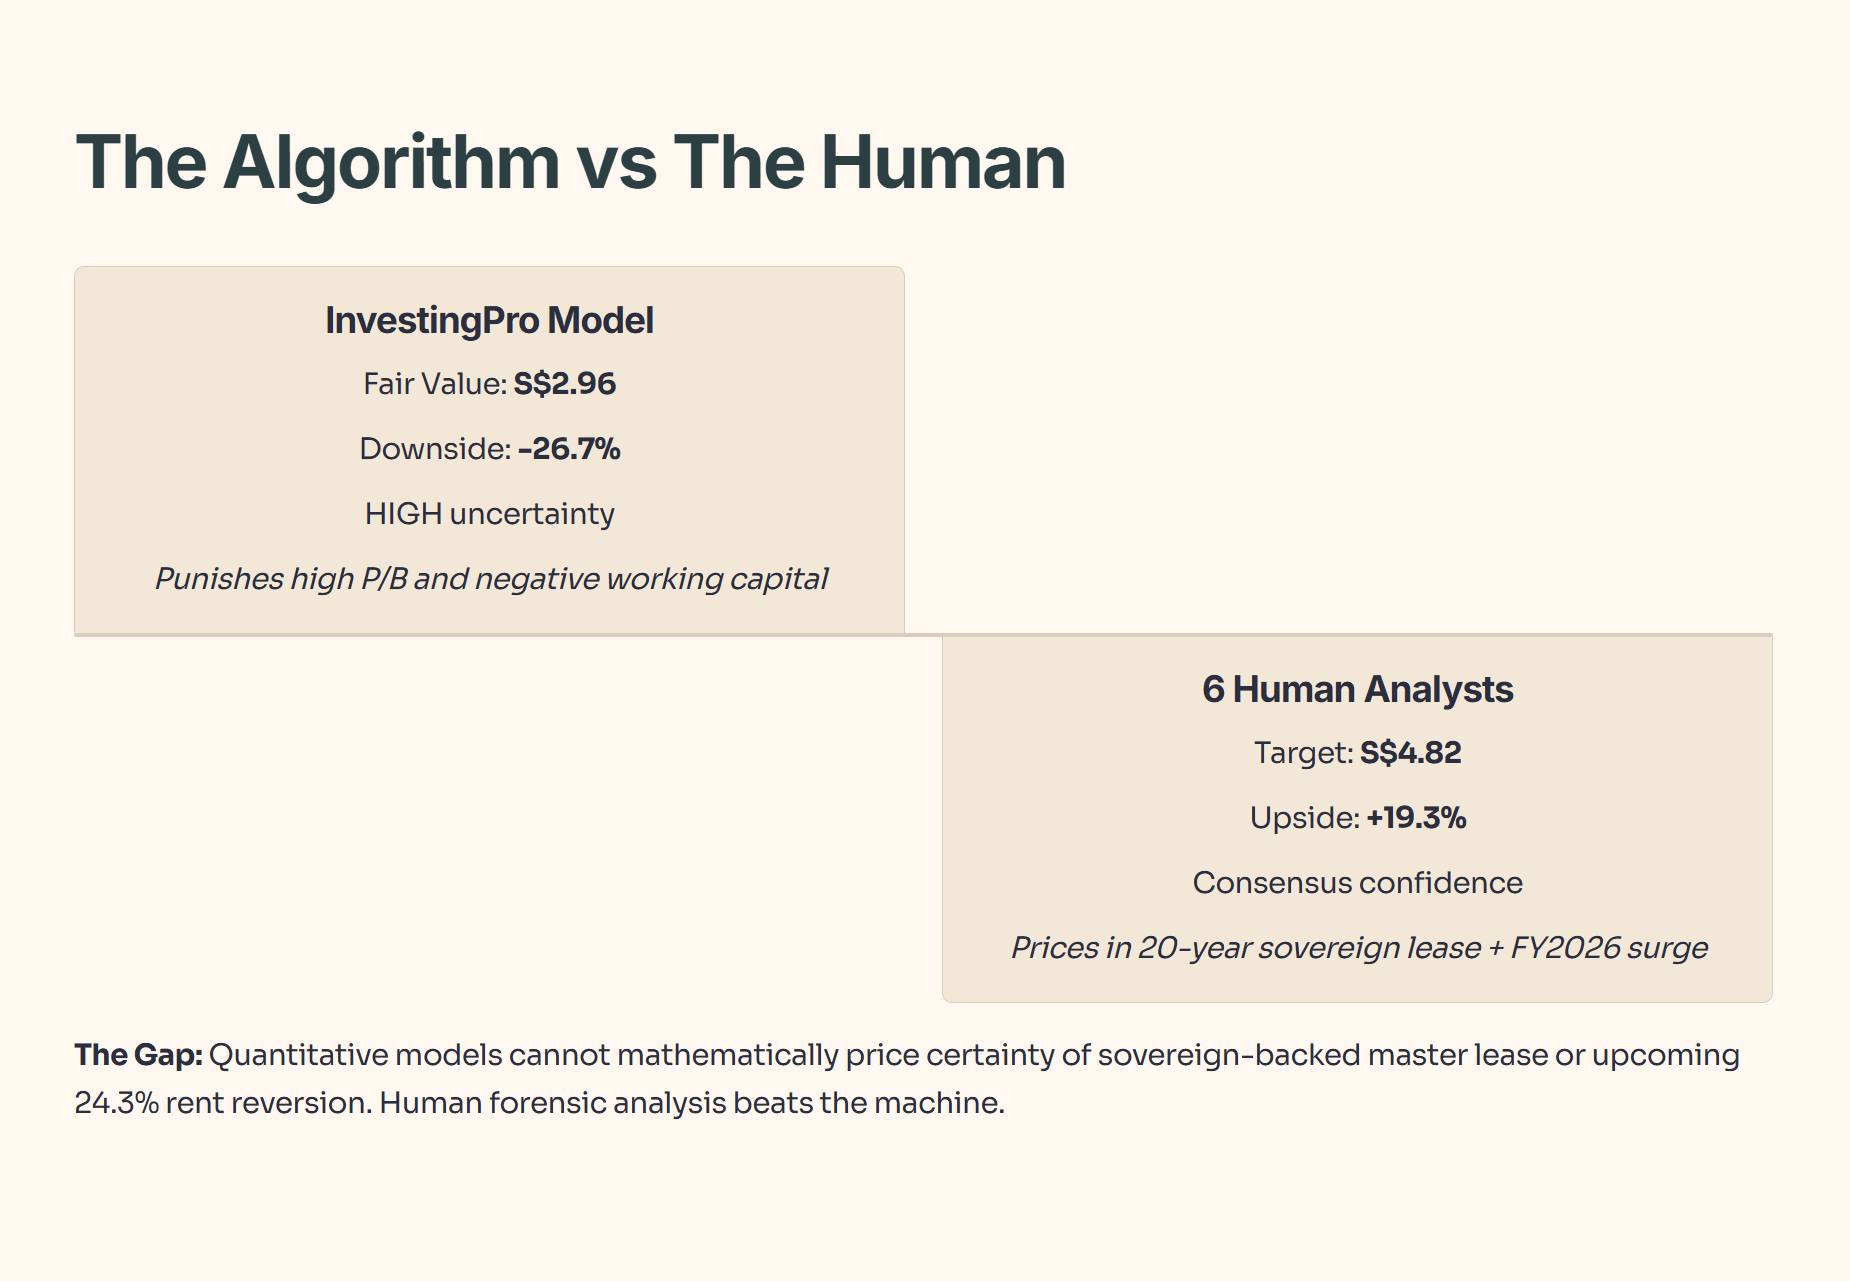
I checked the InvestingPro Fair Value model, which removes human bias by aggregating 10+ financial metrics. It currently shows an Average Fair Value of S$2.96, classifying the stock with a -26.7% Downside and “HIGH” uncertainty. Yet, right next to it, the consensus of 6 human analysts places the target at S$4.82. Why the massive gap? Because pure quantitative models are punishing the stock for its high P/B ratio and negative working capital. They cannot mathematically “price in” the 20-year certainty of the sovereign-backed master lease or the upcoming FY2026 24.3% rent surge. This is where human forensic analysis beats the machine.
“Next, I’ll show you the exact watchlist entry range and the one yield-spread trigger I’m waiting for—so you can act if the algorithm-driven dip actually shows up.”
