Only 5 SGX Stocks Survived My Q2 2026 Risk Filter
Designed for income investors who care more about capital survival than headline yield

A Note to My Readers — Why This Article Was Rewritten
When I first published this piece, I made a mistake I am not proud of.
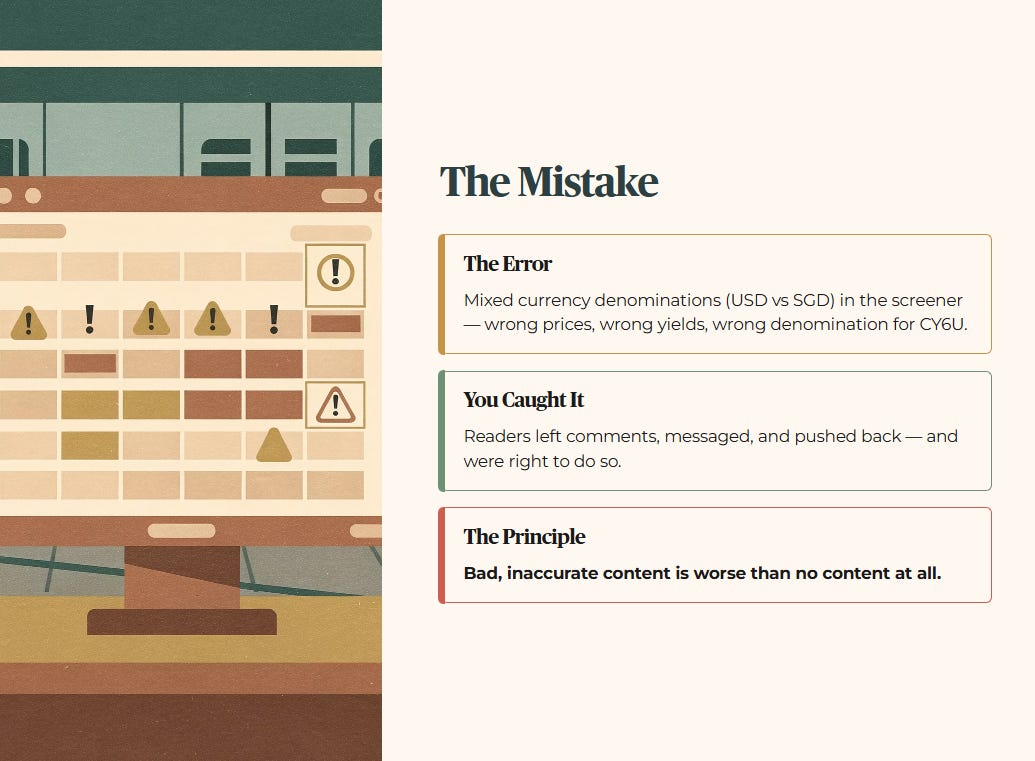
The InvestingPro screener I used to source the underlying data had mixed currency denominations across different tickers — some figures were quoted in USD, others in SGD — and I did not catch it during my review. That single oversight cascaded into multiple pricing errors across the article: wrong share prices, a misstated currency denomination for CapitaLandIndiaTrust, and yield figures that were calculated on the wrong base.
Several of you caught it. You left comments, you messaged, and you pushed back — and you were right to do so.
I want to say this clearly and without deflection: bad, inaccurate content is worse than no content at all.
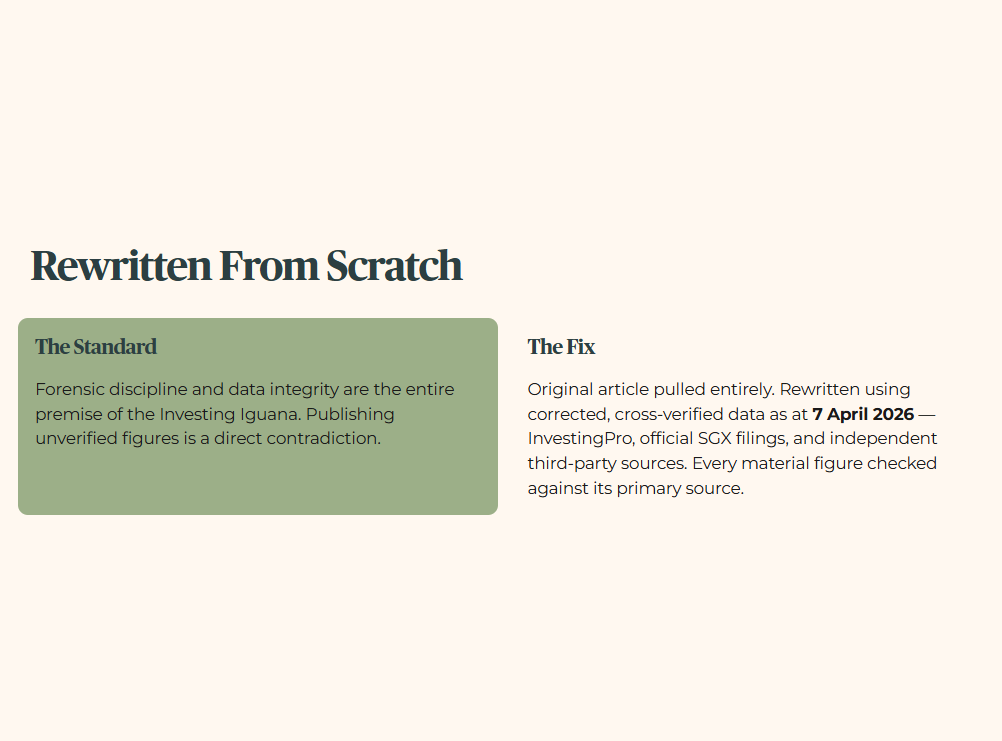
The entire premise of the Investing Iguana is forensic discipline and data integrity. Publishing figures I had not adequately verified is a direct contradiction of everything this platform stands for. There are no excuses for it, and I am not going to offer any.
I have pulled the original article entirely and rewritten it from scratch using corrected, cross-verified data as at 7 April 2026 — pulling from InvestingPro, official SGX filings, and independent third-party sources. Every material figure has been checked against its primary source before it appears on this page.
To every reader who flagged the errors: thank you. Genuinely. You are exactly the community this platform is built for — readers who are paying attention, who read carefully, and who hold me to the same forensic standard I claim to hold the market to. That accountability matters, and I do not take it lightly.
Now. Let’s do this properly.

In This Article:
A Note to My Readers
The Yield Trap Paradox
Step 1 The Health Check
Financial Health Checklist
Step 2 The Wealth Check
1 CapitaLand India Trust
2 Mapletree Industrial Trust
3 ComfortDelGro
Step 3 The Price Check
Peer Comparison Table
4 Jardine Cycle Carriage
5 Thai Beverage
Iggy’s Insights
Step 4 The Bottom Line
About Iggy & the Elite Investors
The Window Closes Fast. In this market, the difference between a “Sanctuary” and a “Yield Trap” is decided in a single trading session. By the time this analysis reaches you as a free subscriber, the entry window Iggy identified has already opened — and often closed.
Iggy’s Elite Investors don’t just get the report earlier. They get it when the numbers still matter — zero-day forensic breakdowns, the full “Red Zone” watchlist, and institutional-grade cheatsheets at the moment the setup is live, not after the market has already priced it in.
For S$9/month — less than a kopi and kaya toast set at Raffles Place — you stop being the Exit Liquidity and start being the Analyst.
THE YIELD TRAP PARADOX — Q2 2026 SCREENER
By Investing Iguana | All data as at 7 April 2026
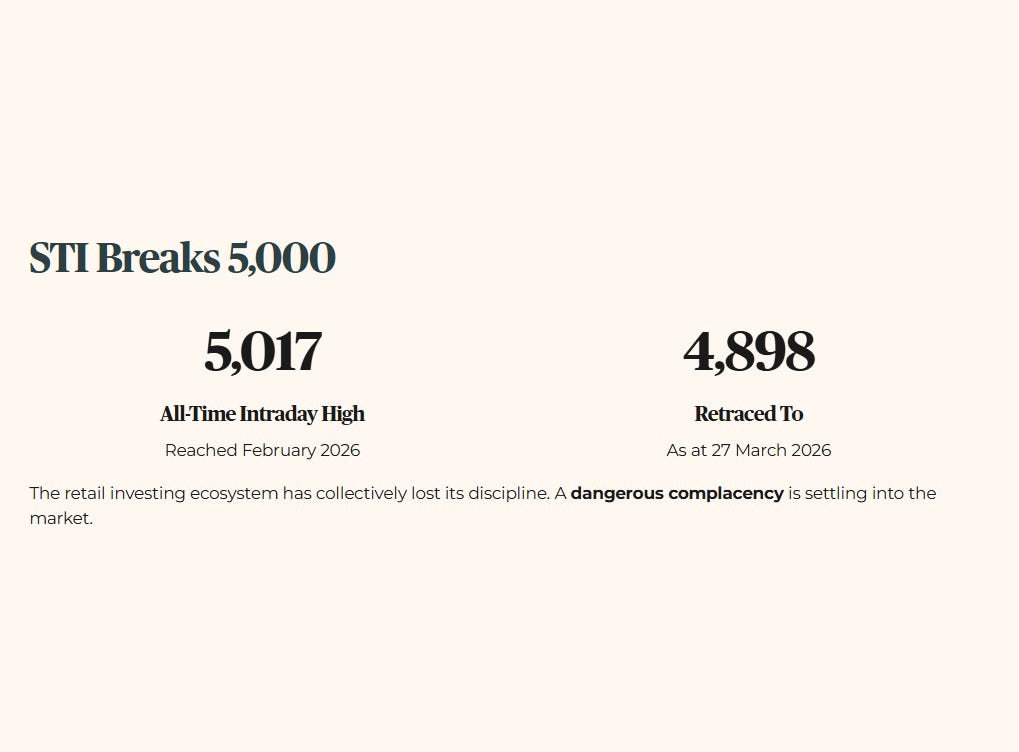
The Straits Times Index (STI) shattered the historic 5,000-point resistance level in February 2026, reaching an all-time intraday high of 5,017.60, before retracing to 4,898.18 as at 27 March 2026, and the retail investing ecosystem has collectively lost its discipline. Everywhere you look, there is a dangerous complacency settling into the market.
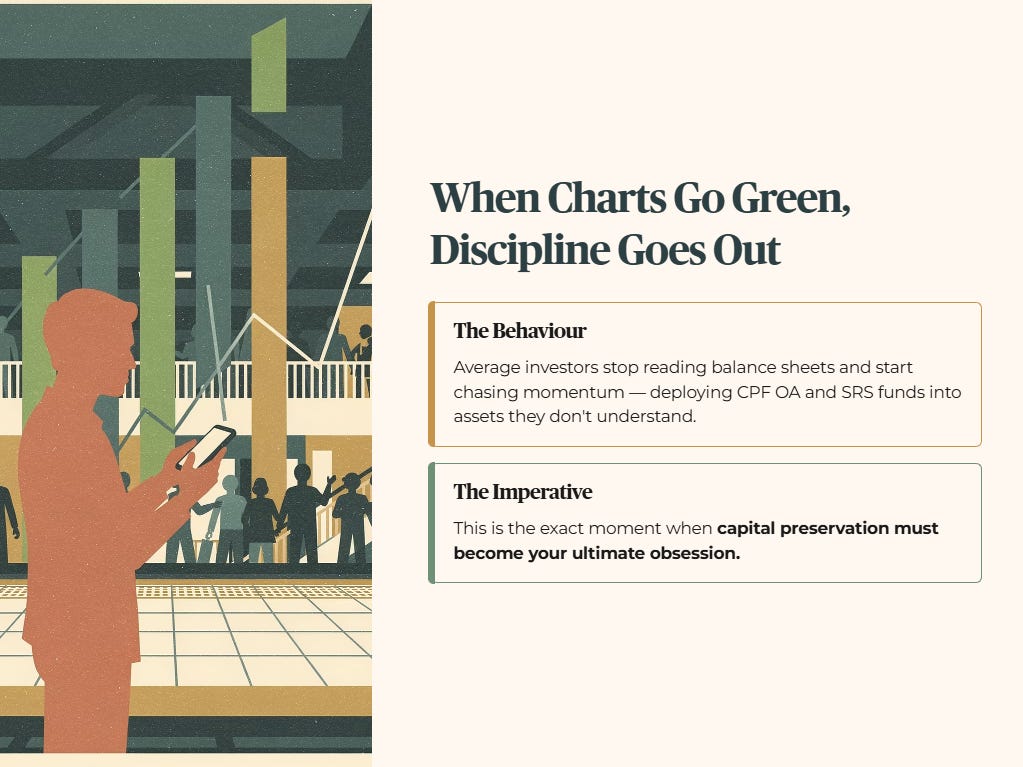
When the index charts are painting vertical green lines, the average investor stops reading balance sheets and starts chasing momentum. They see an engineered dividend yield or a brief surge in share price, and suddenly, they are deploying their hard-earned CPF Ordinary Account (OA) and Supplementary Retirement Scheme (SRS) funds into assets they fundamentally do not understand. This is the exact moment when capital preservation must become your ultimate obsession.
The Yield Trap Paradox
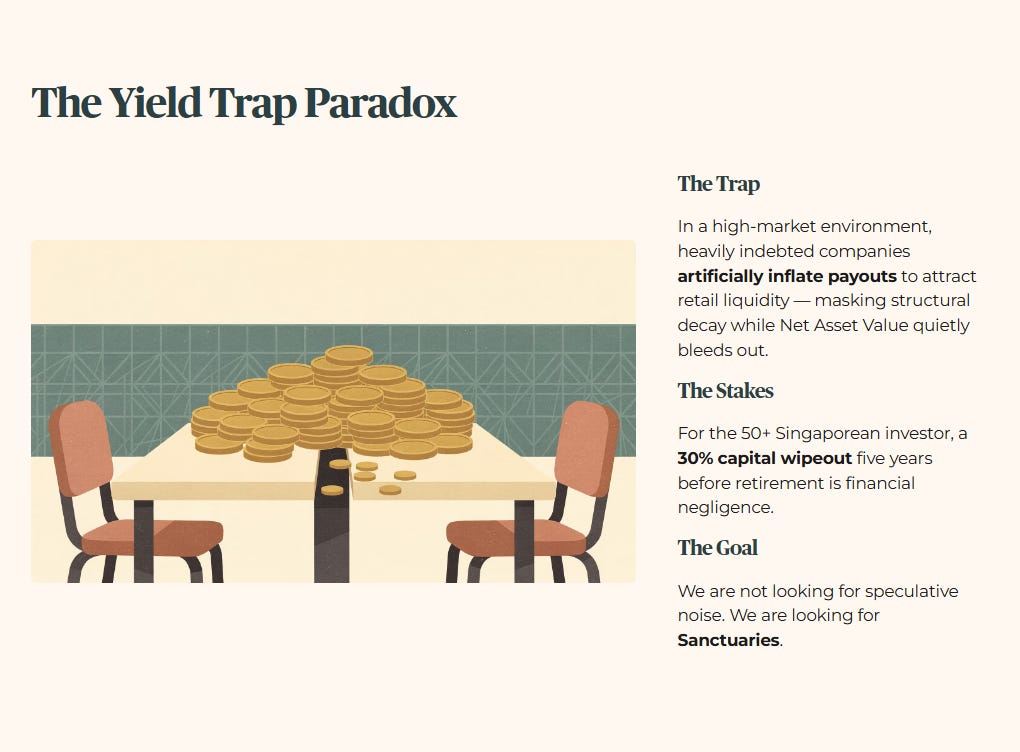
The problem we are solving today is the “Yield Trap Paradox.” In a high-market environment, heavily indebted companies will artificially inflate their payouts to attract retail liquidity, masking the structural decay of their underlying assets. They are selling you the illusion of wealth while their Net Asset Value quietly bleeds out. For the 50+ Singaporean investor who cannot afford to suffer a 30% capital wipeout five years before retirement, blindly buying the index or chasing the highest yield on a screener is nothing short of financial negligence.
We need a completely uncompromised, forensic methodology to separate the genuine wealth compounders from the toxic yield traps. We are not looking for speculative noise; we are looking for Sanctuaries — assets that offer genuine capital protection during macro volatility and rate shocks.
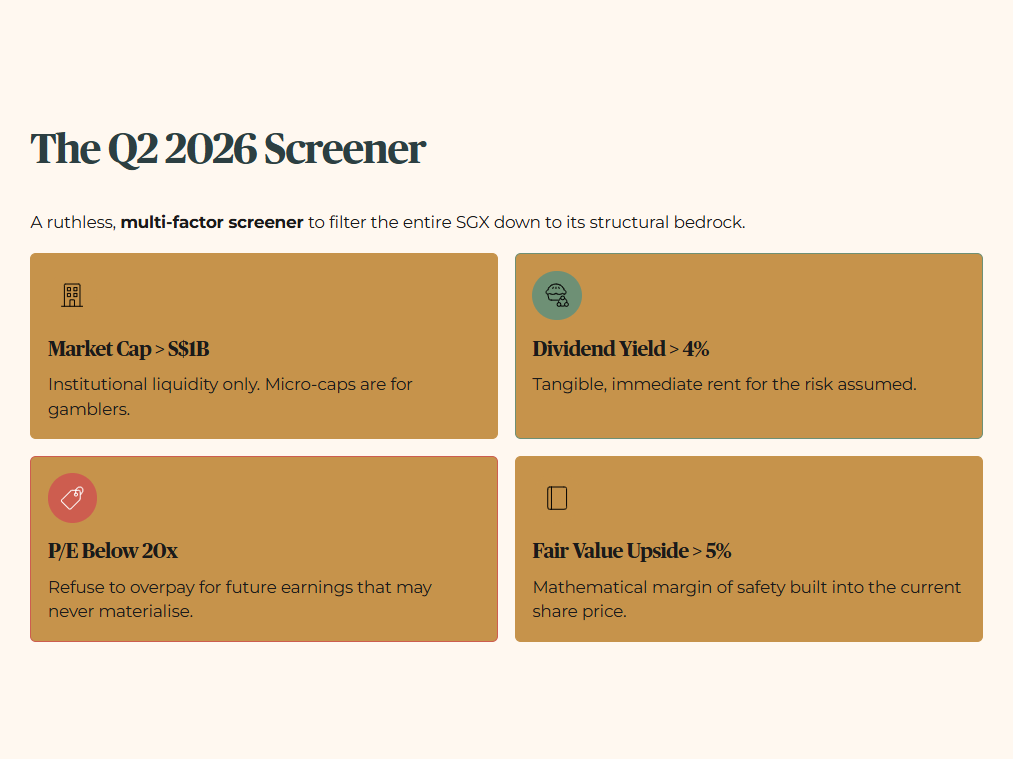
To solve this, I designed a ruthless, multi-factor Q2 2026 screener to filter the entire Singapore Exchange down to its absolute structural bedrock. The filters were deliberately draconian:
Market Capitalisation greater than S$1 Billion: We only audit heavyweights. Micro-caps are for gamblers; we need institutional liquidity.
Dividend Yield strictly above 4%: The asset must pay us a tangible, immediate rent for the risk we assume.
P/E Ratio below 20x: We refuse to overpay for future earnings that may never materialise.
InvestingPro Fair Value Upside greater than 5%: There must be a mathematical margin of safety built into the current share price.

Out of hundreds of listed entities, only eight survived. Today, we subject the top five candidates to the mandatory Five-Layer Analytical Floor. Every single metric will be cross-examined.
Step 1: The Health Check (Solvency)
Before we even acknowledge a company’s dividend yield, we must interrogate its debt. A high yield from a highly leveraged company is just an advance on a future rights issue. When evaluating solvency, a Fortress Balance Sheet is non-negotiable.
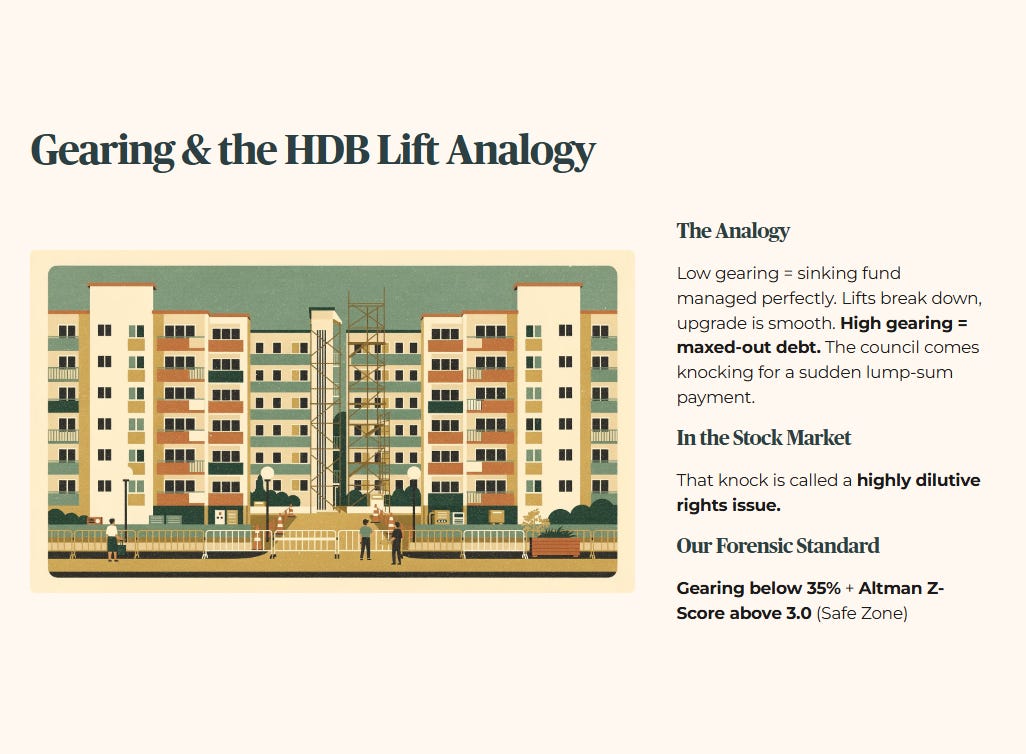
Educational Note: Gearing and the HDB Lift Upgrade
Think of a company’s Gearing limit exactly like an impending HDB Lift Upgrade program for an aging estate. If the town council has managed its sinking fund perfectly (low gearing), the upgrade is smooth, fully funded, and life continues. But if the council is completely maxed out on debt and the lifts break down, they have to come knocking on the residents’ doors demanding a sudden, massive lump-sum payment. In the stock market, that sudden knock on the door is called a highly dilutive rights issue. We strictly demand a Gearing ratio below 35% so that when structural upgrades or macro shocks hit, the company absorbs the cost — not you.
We also rigorously track the Altman Z-Score, a forensic accounting metric that predicts bankruptcy risk. Any score above 3.0 indicates a company is in the “Safe Zone.”
Financial Health Checklist
All equity data sourced from InvestingPro and official SGX filings, captured 7 April 2026. Gearing figures for REITs and Business Trusts sourced from most recent official quarterly disclosures.
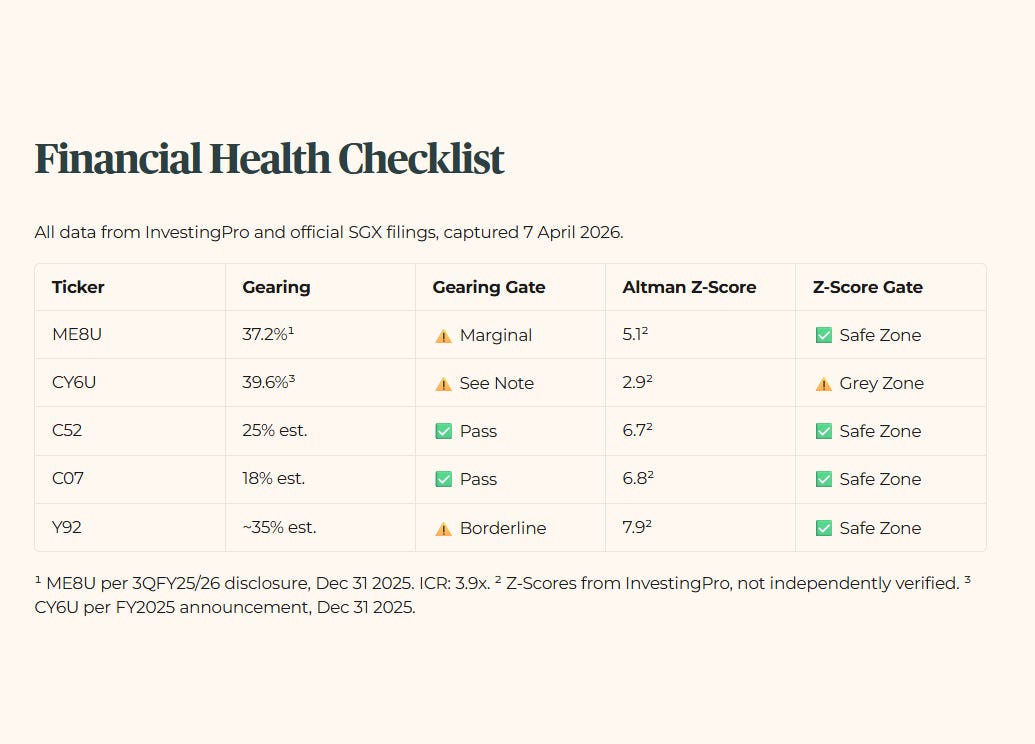
¹ ME8U aggregate leverage per 3QFY25/26 official disclosure, Dec 31 2025. ICR: 3.9x.
² Altman Z-Scores sourced from InvestingPro. Not independently verified from primary filings.
³ CY6U gearing per FY2025 official announcement, Dec 31 2025.
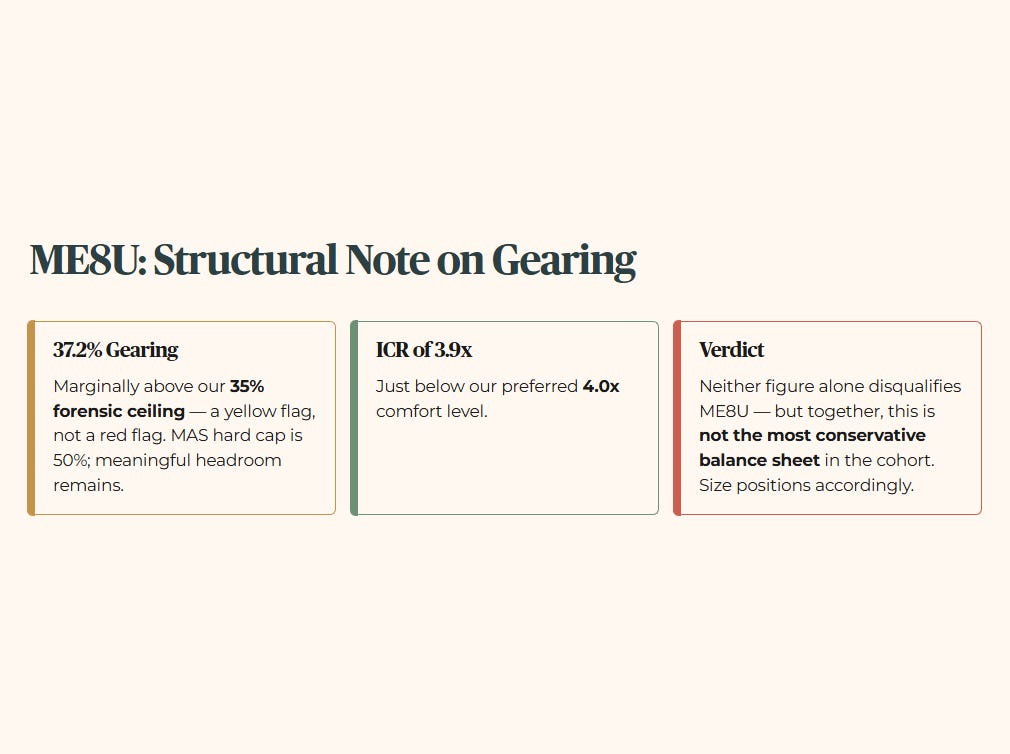
A structural note on ME8U’s gearing: At 37.2%, MapletreeIndustrialTrust sits marginally above our 35% forensic ceiling. This is not a red flag in absolute terms — MAS imposes a 50% hard cap on S-REITs, and 37.2% preserves meaningful headroom. However, it is a yellow flag. The interest coverage ratio of 3.9x also sits just below our preferred 4.0x comfort level. Neither figure alone disqualifies ME8U, but together they mean this is not the most conservative balance sheet in the cohort. Income investors should size positions accordingly.
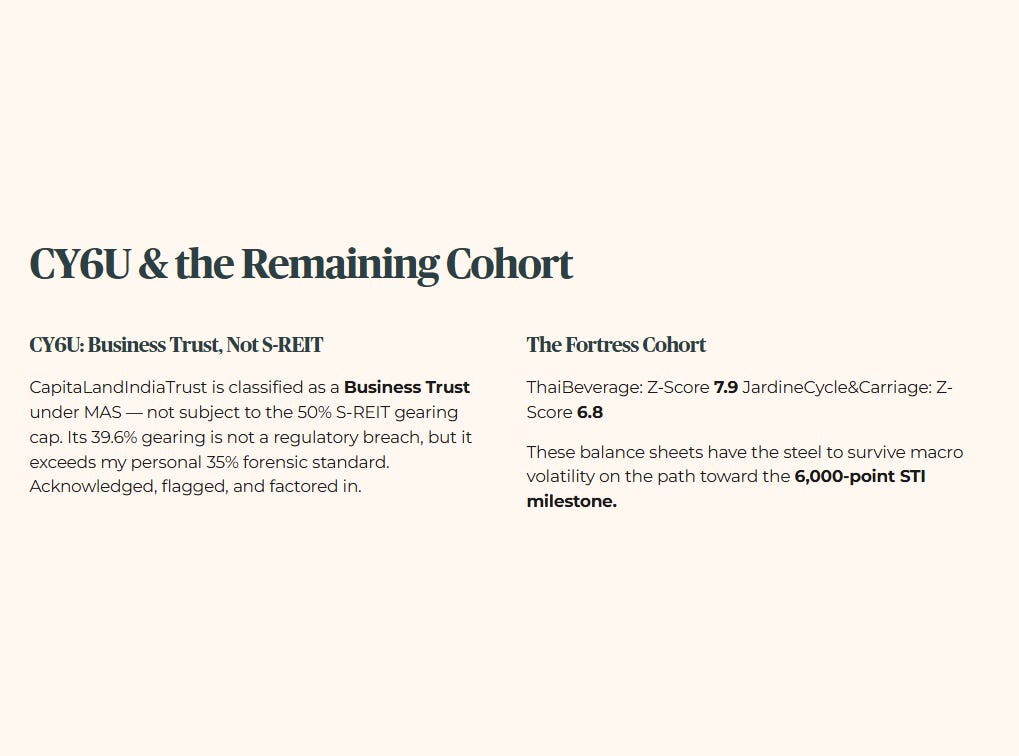
A structural note on CY6U’s gearing: CapitaLandIndiaTrust is classified as a Business Trust under MAS regulations, not an S-REIT. S-REITs operate under a hard statutory gearing cap of 50%. Business Trusts are not bound by the same MAS-mandated ceiling. CY6U’s 39.6% gearing is therefore not a regulatory breach — it operates in a fundamentally different leverage framework. That said, my personal forensic standard remains 35%. The elevated gearing is acknowledged, flagged, and factored into the yield analysis in Step 2.
The remaining balance sheets provide stronger structural comfort. ThaiBeverage commands a fortress-like Z-Score of 7.9, while JardineCycle&Carriage operates at 6.8. These balance sheets have the necessary steel to survive ongoing macro volatility on the path toward the 6,000-point STI milestone.
Step 2: The Wealth Check (Yield & Cash Flow)
Now that we have verified they will not go bankrupt tomorrow, we calculate the compensation they offer for our capital today.
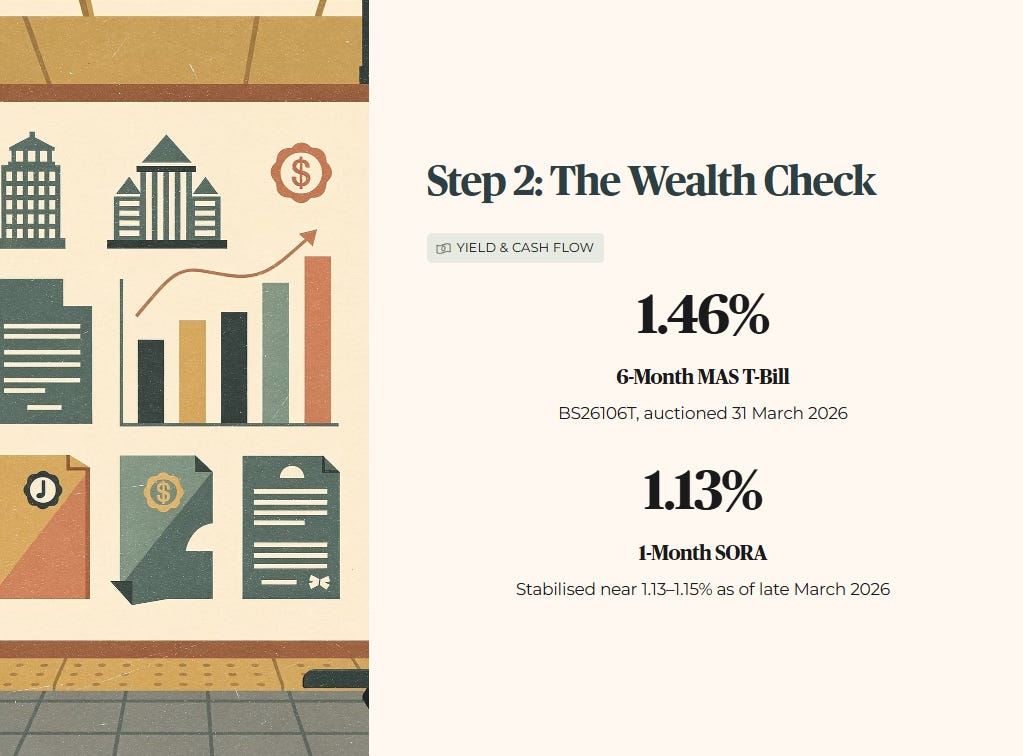
The latest 6-Month MAS T-Bill (BS26106T, auctioned 31 March 2026) cleared at 1.46%, while the 1-Month Compounded SORA has stabilised near 1.13%–1.15% as of late March 2026. However, in forensic analysis, we do not price assets based on today’s calm weather.
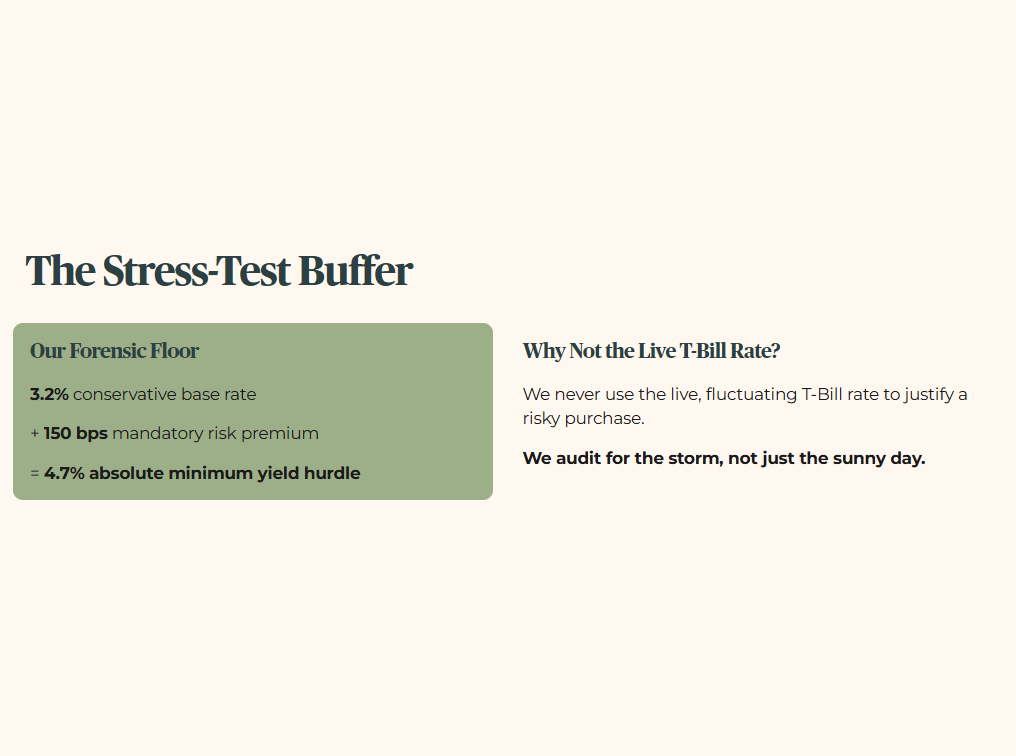
Note on the Stress-Test Buffer: For this audit, I apply a conservative floor of 3.2%. We never use the live, fluctuating T-Bill rate to justify a risky purchase. We audit for the storm, not just the sunny day. To survive this layer of the audit, an asset’s dividend yield must clear the 3.2% floor plus a mandatory 150 basis points of risk premium, creating an absolute minimum yield hurdle of 4.7%.
1. CapitaLand India Trust (SGX: CY6U)
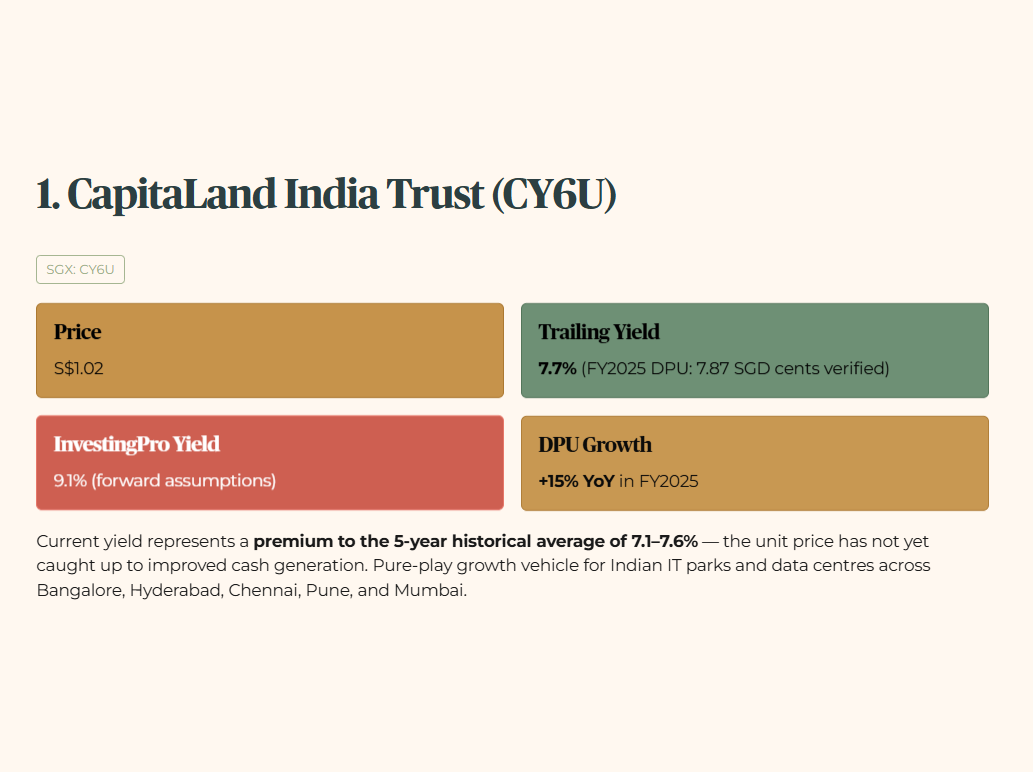
Layer 1 — Raw Fact: CapitaLandIndiaTrust is currently priced at S$1.02 (all prices in Singapore Dollars — CY6U is an SGD-denominated trust listed on SGX), carrying a trailing dividend yield of 7.7% on a verified FY2025 DPU basis of 7.87 Singapore cents — confirmed in the official full-year results announcement. InvestingPro’s multi-model composite quotes a higher figure of 9.1%, incorporating forward distribution assumptions; for forensic purposes, we anchor to the DPU-verified 7.7% as the more conservative and auditable number. On a trailing FY2025 DPU basis of 7.87 Singapore cents, the yield at current price computes to approximately 7.7%. The two figures differ because InvestingPro’s model incorporates forward distribution assumptions; the FY2025 DPU-based yield of 7.7% is the more conservative and verifiable number.
Layer 2 — Benchmark: CY6U’s 5-year average yield sits at approximately 7.1–7.6% historically. The current yield represents a premium to that long-run average, indicating that the unit price has not yet caught up to the trust’s improved cash generation capacity following its strong FY2025 results, where full-year DPU grew 15% year-on-year.
Layer 3 — Peer Context: Unlike domestic giants like CapitaLandIntegratedCommercialTrust or MapletreeLogisticsTrust which fight for yield in a compressed Singaporean landscape, CY6U operates as a pure-play growth vehicle for Indian IT parks and data centres across Bangalore, Hyderabad, Chennai, Pune, and Mumbai — markets that are structurally undersupplied relative to corporate demand
.
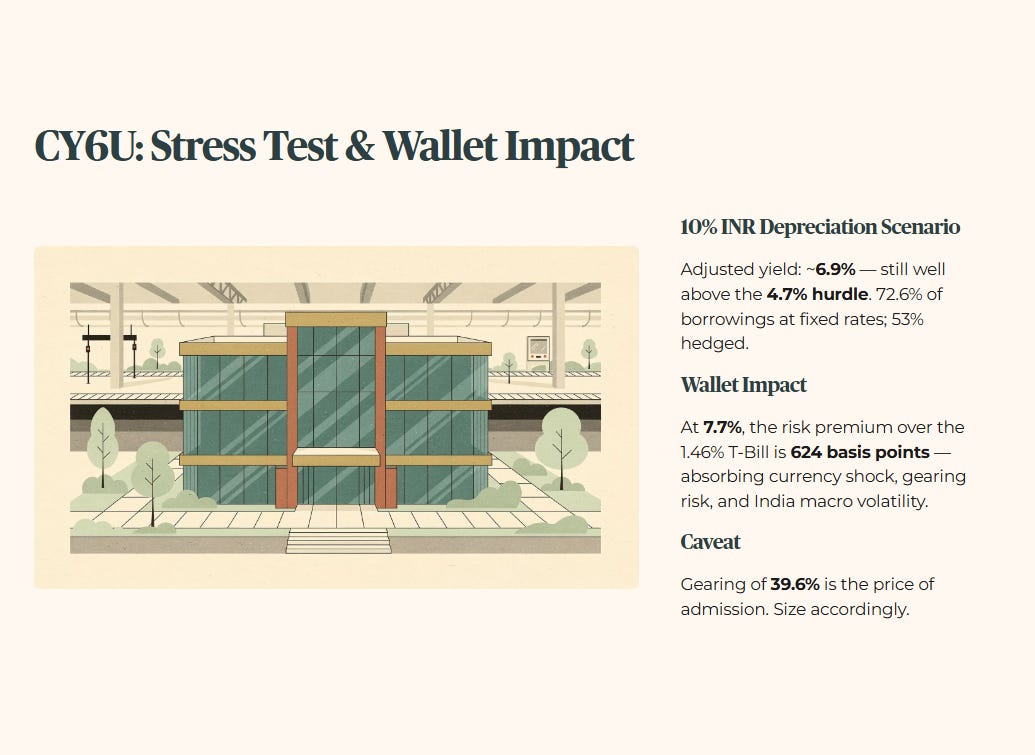
Layer 4 — Forward Scenario: If we inject a severe stress-test scenario — a 10% sudden depreciation of the Indian Rupee (INR) against the Singapore Dollar (SGD) — the repatriated distribution yield would compress. However, starting from a 7.7% base, even a 10% currency haircut leaves an adjusted yield near 6.9%, maintaining a formidable buffer above our 4.7% minimum hurdle. Notably, 72.6% of CLINT’s total borrowings are at fixed rates, and 53% are hedged — providing meaningful protection against the rising cost-of-debt scenario that haunts many Asia-Pacific REITs.
Layer 5 — Wallet Impact: For a 55-year-old Singaporean transitioning from accumulation to income generation, a 7.7–9.1% yield substantially eclipses the CPF Special Account 4.0% benchmark, providing aggressive, inflation-resistant cash flow. At a 7.7% base, the risk premium over the 1.46% T-Bill stands at approximately 624 basis points — a margin that simultaneously absorbs currency shock, gearing risk, and India-specific macro volatility. The elevated gearing of 39.6% is the price of admission for this level of income. Size accordingly.
2. Mapletree Industrial Trust (SGX: ME8U)
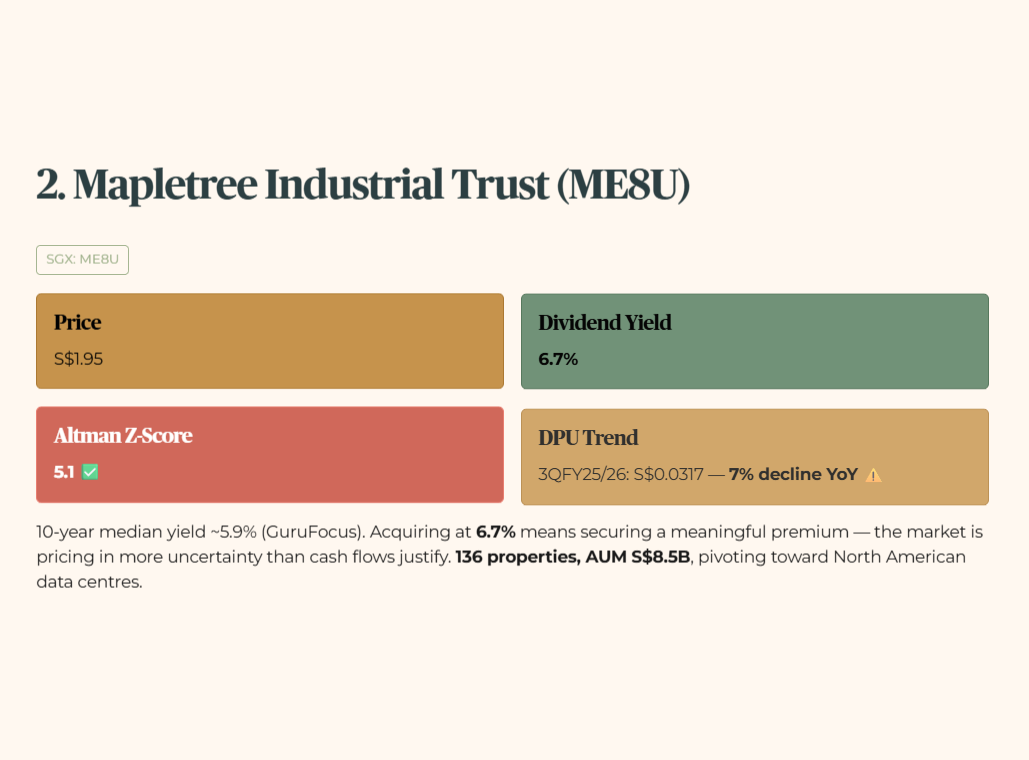
Layer 1 — Raw Fact: MapletreeIndustrialTrust is trading at S$1.95 with a dividend yield of 6.7% and an Altman Z-Score of 5.1 per InvestingPro. The trust’s most recent quarterly DPU was S$0.0317 for 3QFY2025/26 ended December 2025 — a 7% decline year-on-year, flagging a headwind that investors must not overlook.
Layer 2 — Benchmark: MIT’s 10-year median yield sits at approximately 5.9% per GuruFocus. Acquiring ME8U at a 6.7% yield today means securing a meaningful premium over its long-term operational average — the market is, in effect, pricing in more uncertainty than the underlying cash flows justify.
Layer 3 — Peer Context: When placed alongside its immediate industrial peer CapitaLandAscendasREIT, ME8U distinguishes itself through a targeted pivot toward data centres across North America. It is no longer just a flatted factory landlord; it is increasingly an AI infrastructure proxy with 136 properties and an AUM of S$8.5 billion.
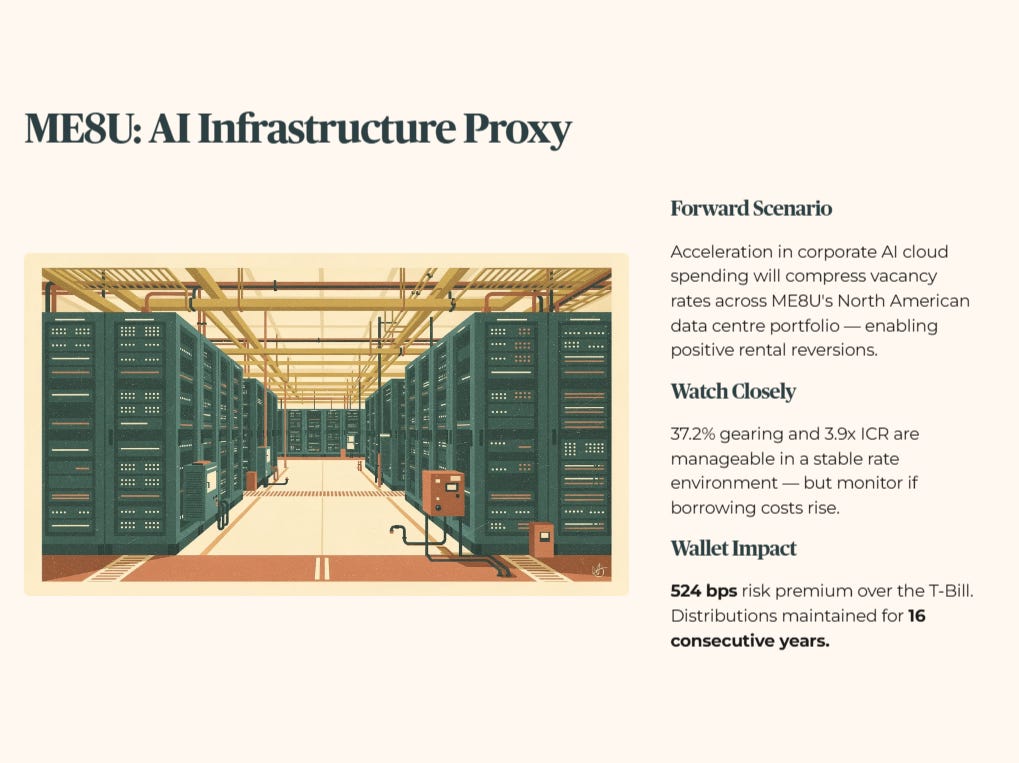
Layer 4 — Forward Scenario: A sustained acceleration in corporate AI cloud infrastructure spending in 2026 will directly compress vacancy rates across ME8U’s North American data centre portfolio, enabling positive rental reversions upon lease renewals. The trust’s 37.2% gearing and 3.9x ICR sit at the tighter end of our forensic floor — manageable in a stable rate environment but watch closely if borrowing costs rise further.
Layer 5 — Wallet Impact: Capturing a 6.7% yield creates a 524-basis-point risk premium over the 1.46% T-Bill. For retirees relying on CPF Life payouts, adding ME8U to a cash portfolio provides a secondary income engine that keeps pace with medical and consumer inflation — anchored by a real asset base that has maintained distributions for 16 consecutive years.
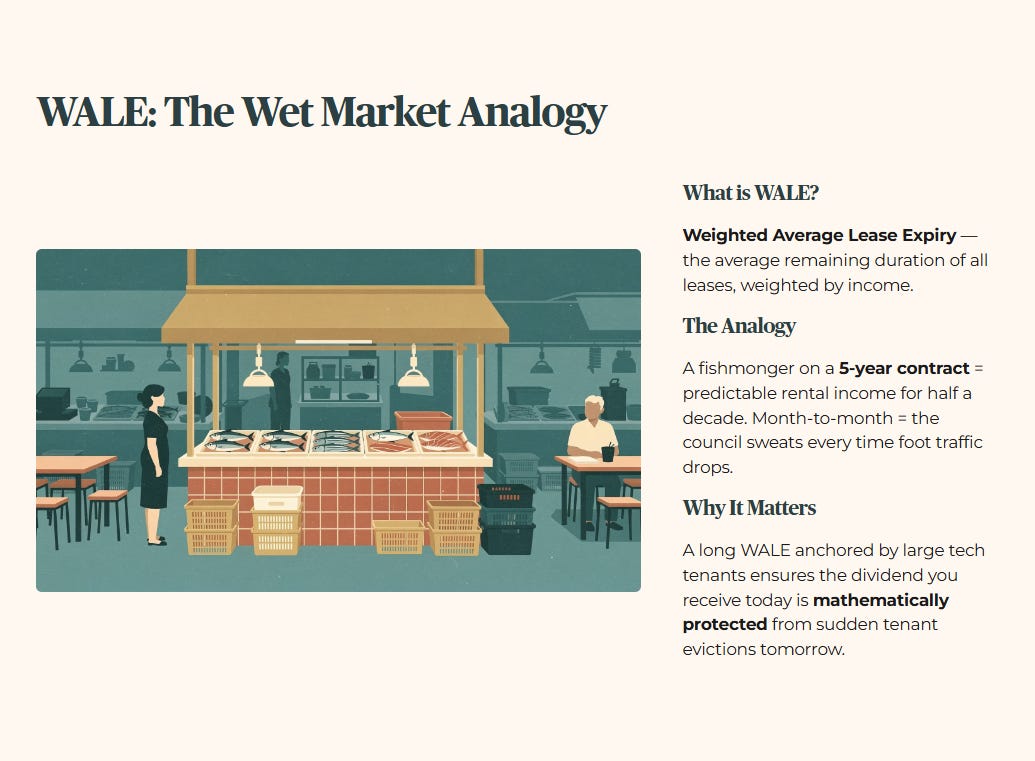
Educational Note: WALE (Weighted Average Lease Expiry)
Think of WALE exactly like a long-term wet market stall lease. If a fishmonger signs a secure 5-year contract with the town council (a long WALE), the council can comfortably predict its rental income for half a decade. But if the fishmonger is renting month-to-month, the council sweats every time foot traffic drops. For industrial REITs like ME8U, a long WALE anchored by large tech tenants ensures that the dividend you receive today is mathematically protected from sudden tenant evictions tomorrow.
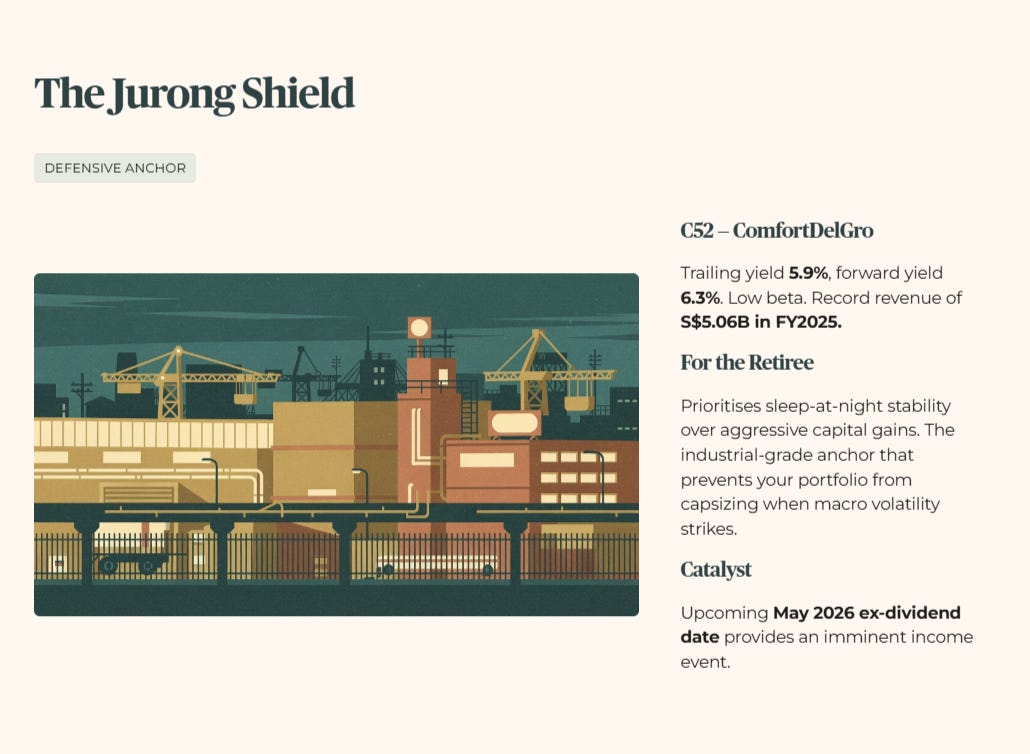
3. ComfortDelGro (SGX: C52)
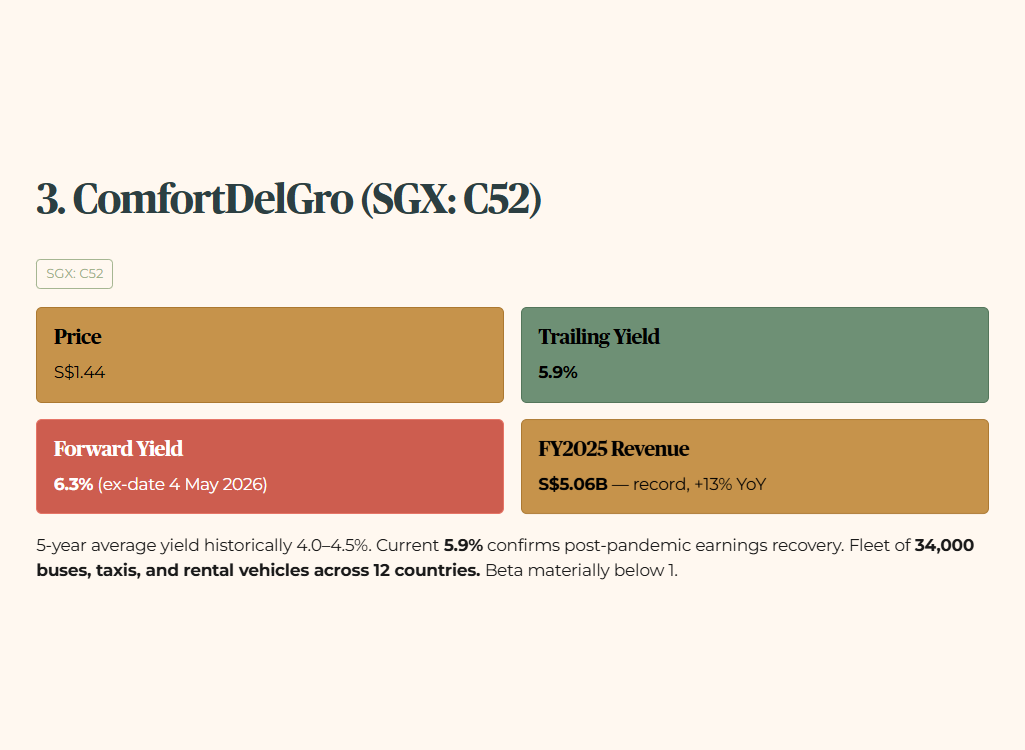
Layer 1 — Raw Fact: The transport giant is currently priced at S$1.44, delivering a trailing dividend yield of 5.9%, supported by a Z-Score of 6.7. An upcoming dividend of S$0.0459 per share (ex-date 4 May 2026) implies a forward yield of approximately 6.3% at current price — providing an imminent income catalyst.
Layer 2 — Benchmark: [stock ComfortDelGro]’s 5-year average yield has historically tracked the 4.0–4.5% range. The current 5.9% trailing yield confirms that the post-pandemic earnings recovery has firmly taken root, translating directly into a meaningfully higher shareholder payout. FY2025 revenue crossed S$5 billion for the first time, rising 13% year-on-year to a record S$5.06 billion.
Layer 3 — Peer Context: In the domestic transport sector, C52 is the apex operator. With a fleet of 34,000 buses, taxis, and rental vehicles across 12 countries, it operates with a business model that is genuinely uncorrelated to equity market sentiment. Its beta is materially below 1 — when the market panics, ComfortDelGro barely flinches.
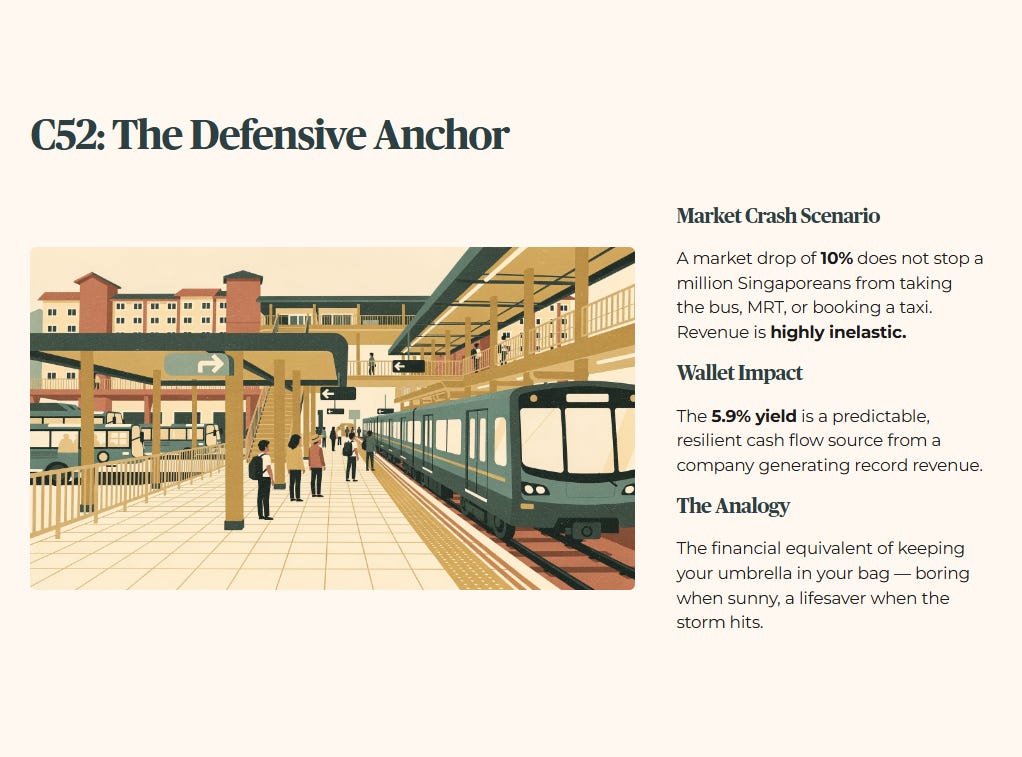
Layer 4 — Forward Scenario: If broad market sentiment drops 10% due to global interest rate fears or geopolitical escalation, C52’s revenue remains largely insulated. A market crash does not stop a million Singaporeans from taking the bus, the MRT, or booking a taxi. Its utility is highly inelastic.
Layer 5 — Wallet Impact: C52 serves as the defensive anchor in a retirement portfolio. While it may not offer the hyper-growth of an overseas tech-adjacent asset, its 5.9% yield is a predictable, resilient cash flow source from a company generating record revenue and growing its dividend track record. It is the financial equivalent of keeping your umbrella in your bag — boring when it is sunny, but a lifesaver when the storm hits.
Step 3: The Price Check (Valuation)
We have verified solvency and confirmed the cash flow. But none of that matters if you overpay for the asset. Buying a phenomenal company at a terrible price makes it a terrible investment. We must hunt for the Forensic Gap: the mathematical discrepancy between a company’s fundamental Fair Value and the emotional price quoted on the exchange today.
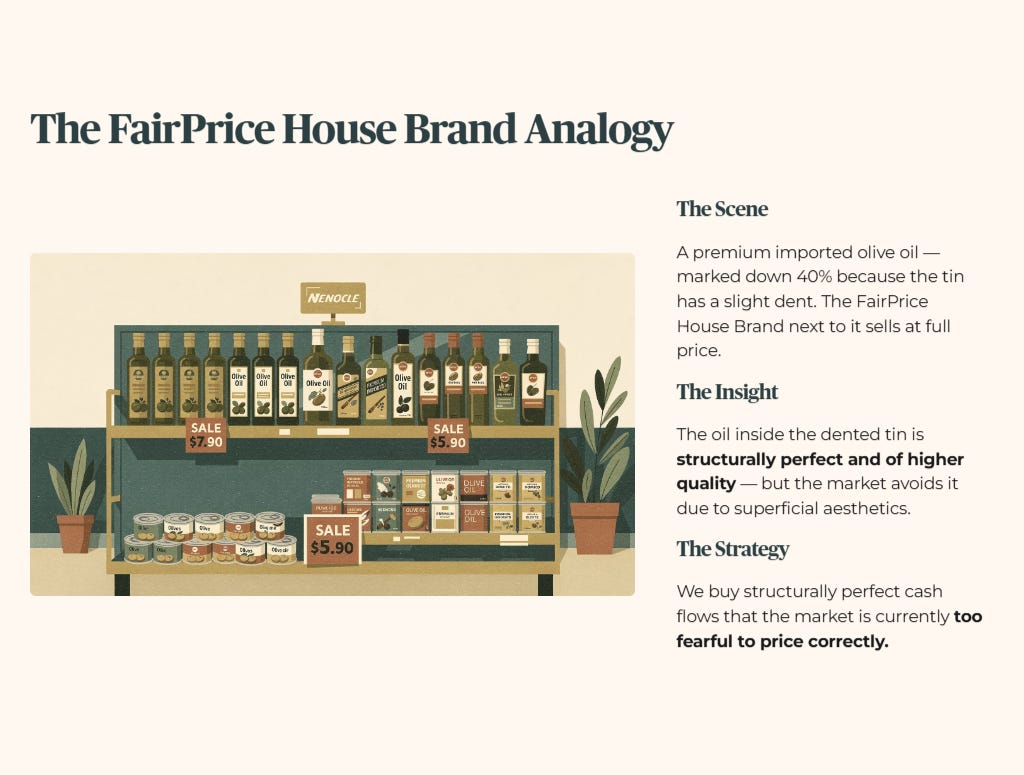
Educational Note: The FairPrice House Brand Mispricing
Valuation is exactly like walking down the aisle at NTUC FairPrice. You see a premium, imported bottle of olive oil marked down by 40% simply because the exterior tin has a slight dent, while the standard FairPrice House Brand next to it is selling at full retail price. The oil inside the dented tin is structurally perfect and of higher quality, but the market is avoiding it due to superficial aesthetics. Buying that dented premium tin is exactly how we capture Fair Value upside in the stock market. We buy structurally perfect cash flows that the market is currently too fearful to price correctly.
Peer Comparison Table
All equity data sourced from InvestingPro and verified public filings, as at 7 April 2026. Fair Value figures represent InvestingPro’s multi-model average. Analyst consensus targets are sourced separately and may differ materially from InvestingPro model fair values.
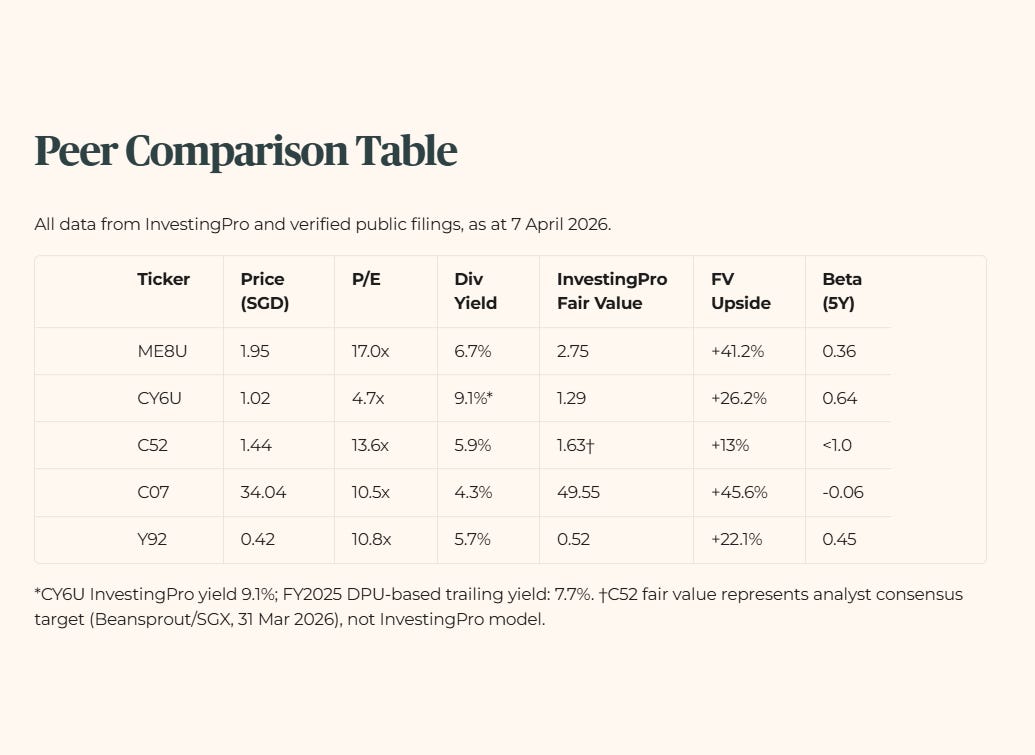
*CY6U InvestingPro yield 9.1%. FY2025 DPU-based trailing yield: 7.7%. See Layer 1 analysis above.
†C52 fair value represents analyst consensus target (Beansprout/SGX, 31 Mar 2026), not InvestingPro model.
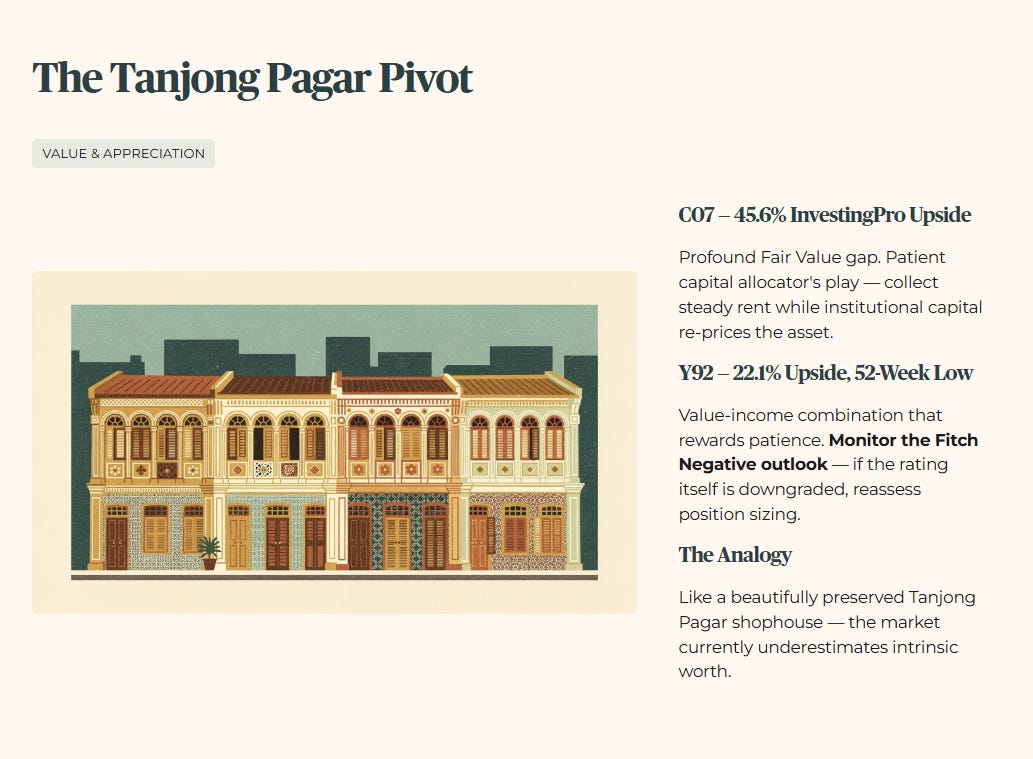
A critical note on C07’s fair value: JardineCycle&Carriage’s 45.6% upside of S$49.55 comes entirely from InvestingPro’s 15-model composite, which captures intrinsic value across discounted cash flow, multiples, and asset-based methodologies. The 5-analyst consensus target, by contrast, sits at S$33.73 — marginally below the current price. The divergence reflects genuine disagreement about how to value a complex conglomerate with deep Southeast Asian exposure. The InvestingPro model upside is real but requires a longer time horizon to materialise than analyst 12-month targets suggest.
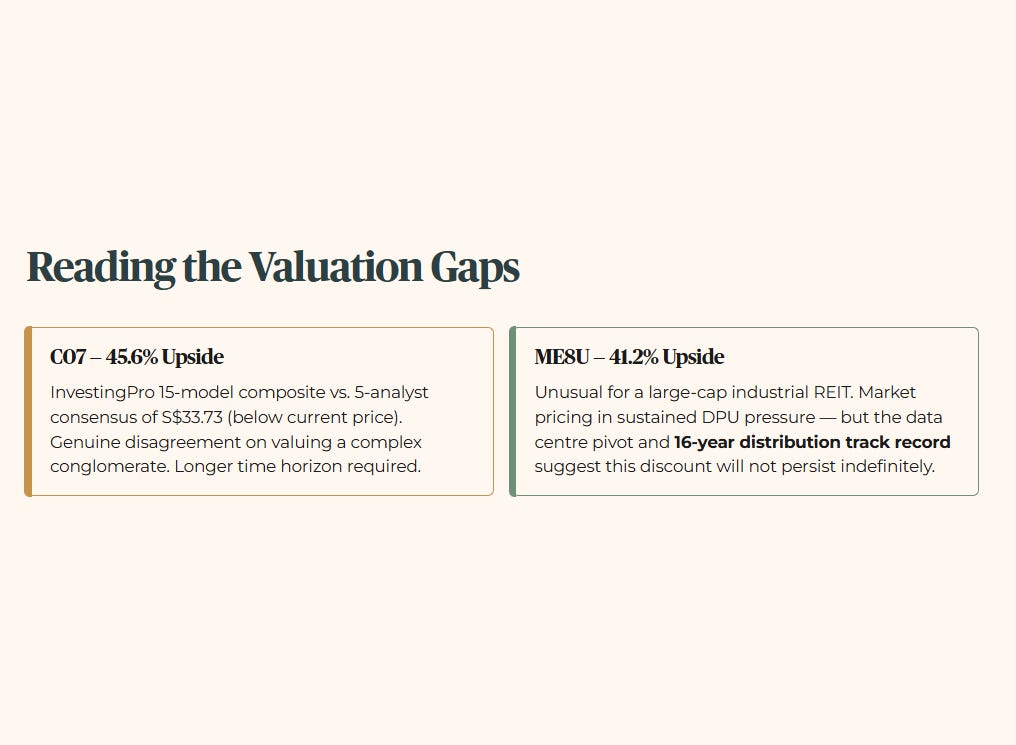
Seeing MapletreeIndustrialTrust command a 41.2% InvestingPro Fair Value Upside at S$2.75 is unusual for a large-cap industrial REIT. At S$1.95, the market is pricing in sustained DPU pressure and elevated interest costs — but the trust’s data centre pivot and 16-year distribution track record suggest this discount will not persist indefinitely.
4. Jardine Cycle & Carriage (SGX: C07)
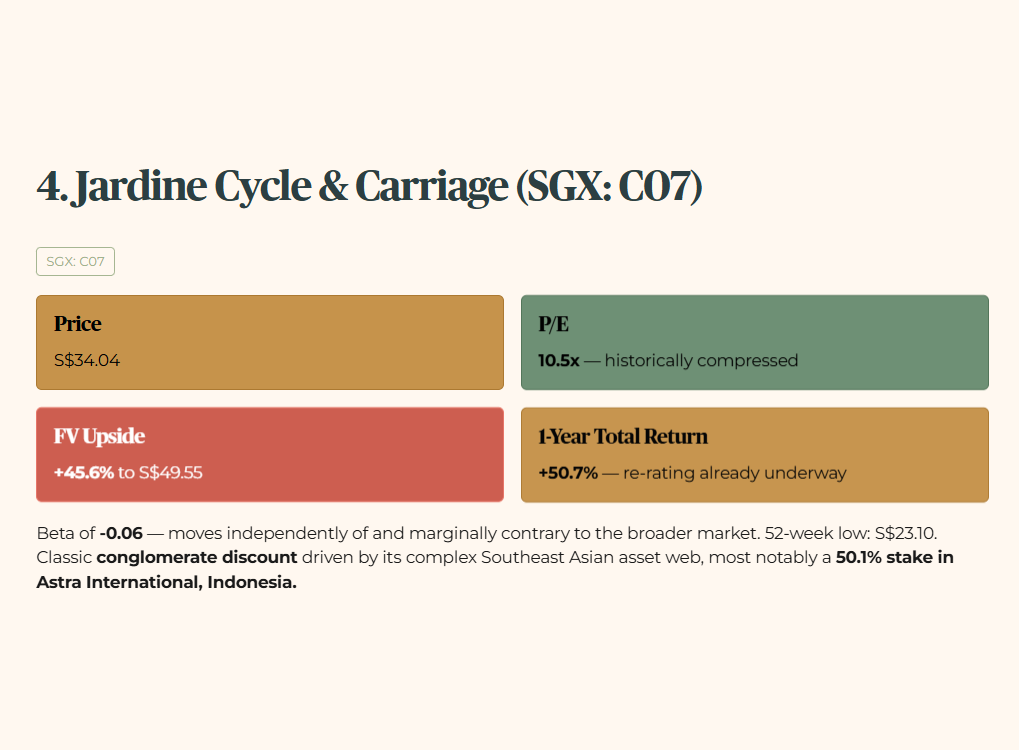
Layer 1 — Raw Fact: JardineCycle&Carriage is currently trading at S$34.04 with a P/E of 10.5x and an InvestingPro Fair Value Upside of 45.6%. Its 5-year beta is -0.06 — statistically, it moves independently of and marginally contrary to the broader market. Notably, C07 has delivered a 1-year total return of +50.7% as at 7 April 2026, meaning the re-rating thesis has already begun to play out.
Layer 2 — Benchmark: A P/E of 10.5x is historically compressed for this conglomerate, still trading below its long-run intrinsic multiples, even after the significant rally from its 52-week low of S$23.10.
Layer 3 — Peer Context: As a holding company, C07 suffers from the classic “conglomerate discount.” The market struggles to accurately price its complex web of Southeast Asian assets — most notably its 50.1% stake in Astra International in Indonesia — leading it to trade at a persistent discount compared to focused single-industry peers.
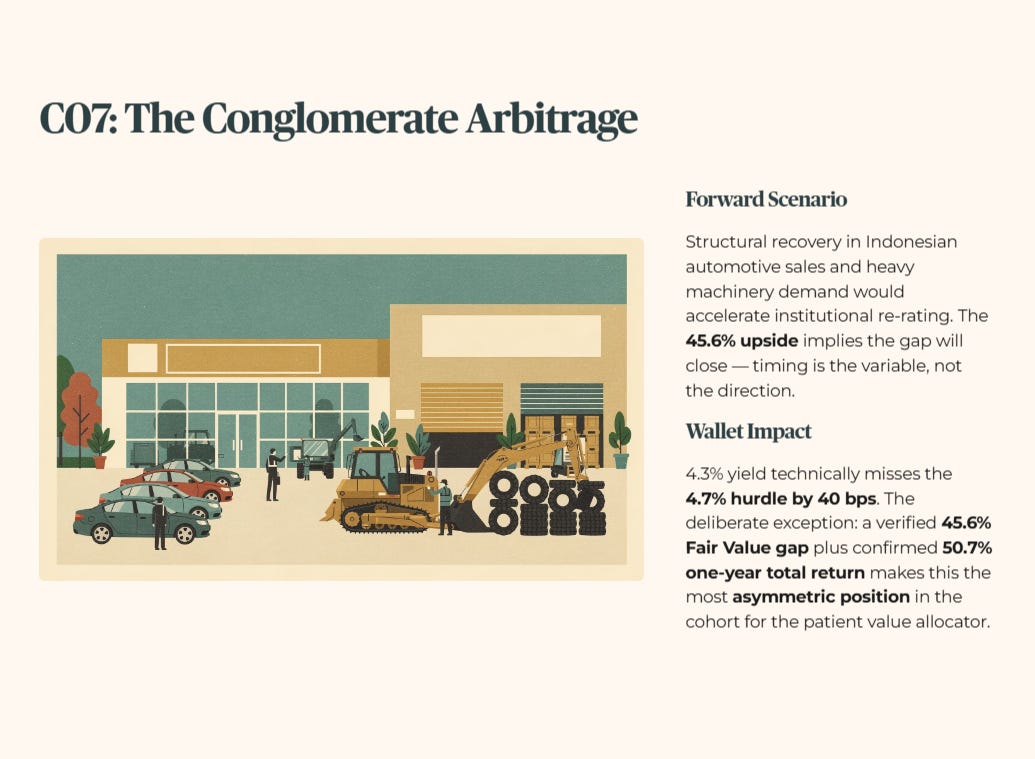
Layer 4— Forward Scenario: C07’s core asset is its exposure to Astra International in Indonesia. A structural recovery in Indonesian automotive sales and heavy machinery demand would accelerate the institutional re-rating of this stock. The 45.6% InvestingPro upside already implies this gap will close; the timing is the variable, not the direction.
Layer 5 — Wallet Impact: The 4.3% dividend yield technically misses our strict 4.7% absolute minimum yield hurdle by 40 basis points. The deliberate exception here is capital structure arbitrage: when a verified 45.6% InvestingPro Fair Value gap exists alongside a confirmed 50.7% one-year total return that signals an ongoing re-rating, the mathematical compounding of capital appreciation over a five-to-ten year horizon structurally outweighs a 40-basis-point yield shortfall. For the income investor, this is a judgment call. For the patient value allocator with a decade of runway, it is arguably the most asymmetric position in this cohort.
5. Thai Beverage (SGX: Y92)
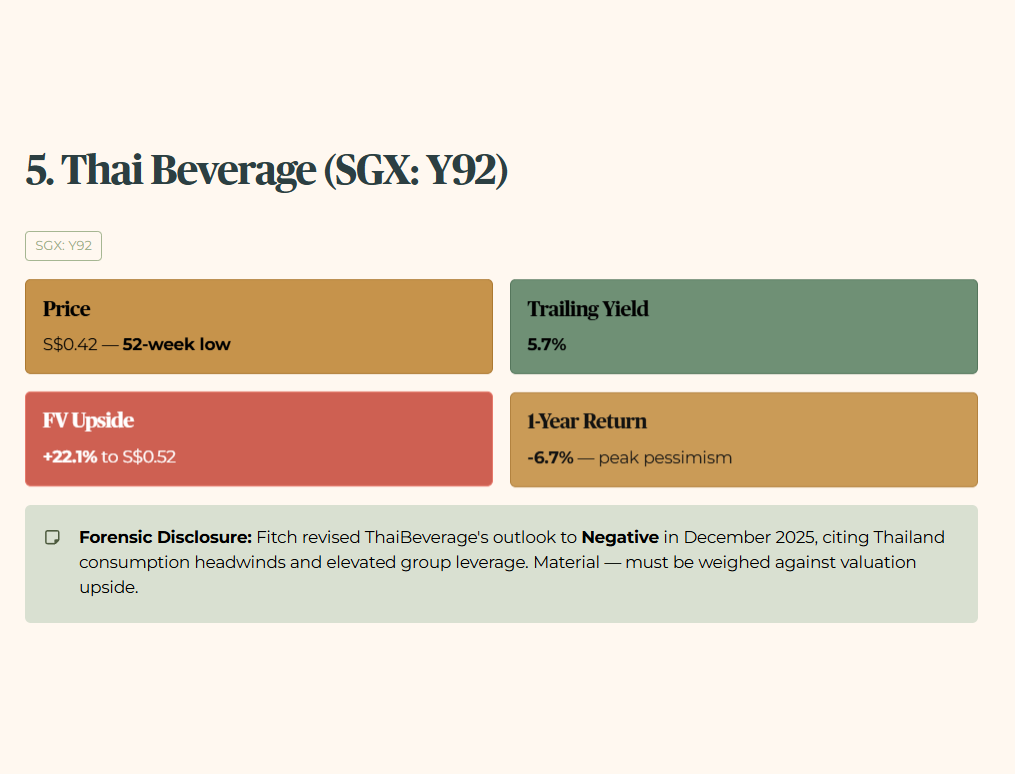
Layer 1 — Raw Fact: The beverage giant is sitting at S$0.42 per share — the very bottom of its 52-week range of S$0.42–S$0.52 — carrying a P/E of 10.8x, a trailing yield of 5.7%, and a 22.1% InvestingPro Fair Value Upside to S$0.52. The stock has returned -6.7% over the past year, meaning you are buying structural value at a moment of peak pessimism.
Forensic disclosure: Fitch revised ThaiBeverage’s outlook to Negative in December 2025, citing consumption headwinds in Thailand and elevated leverage at the group level. This is a material disclosure that must be weighed against the valuation upside. The Fitch action does not invalidate the income thesis — the Z-Score of 7.9 and operating cash generation remain formidable — but it does mean the path to re-rating carries more macro dependency than the valuation alone implies.
Layer 2 — Benchmark: The current 5.7% yield is outperforming its historical long-run average. You are getting more cash flow per dollar invested today than at almost any point in the past half-decade, precisely because the market has derated the stock on Thailand consumption concerns.
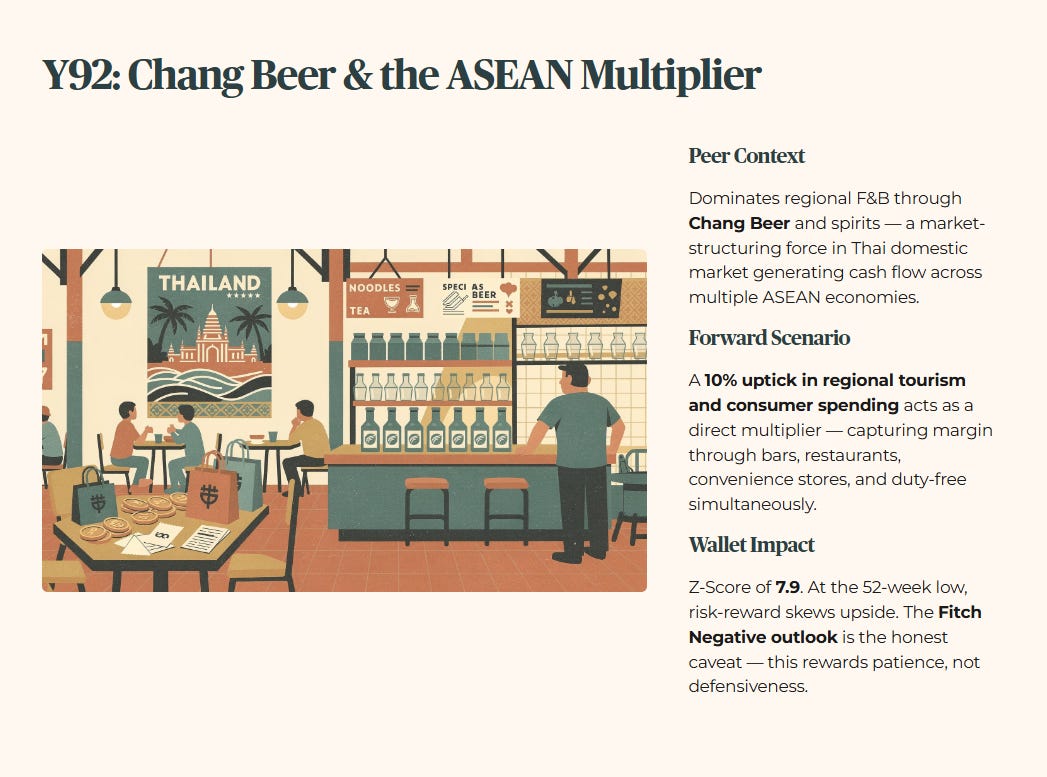
Layer 3 — Peer Context: Thai Bev dominates the regional Food & Beverage space through the Chang Beer brand and its spirits division — a regional consumer franchise that generates cash flow across multiple ASEAN economies and effectively operates as a market-structuring force in the Thai domestic market.
Layer 4 — Forward Scenario: A 10% uptick in broader regional tourism and domestic consumer spending acts as a direct multiplier to top-line revenue. When ASEAN tourism rebounds fully, Thai Bev captures the margin at the ground level — through bars, restaurants, convenience stores, and duty-free channels simultaneously.
Layer 5 — Wallet Impact: Backed by a Z-Score of 7.9, Y92 provides a resilient dividend stream that turns regional consumption directly into SGD cash flow for your retirement accounts. At the 52-week low, the risk-reward is skewed toward the upside for a patient income investor. The Fitch Negative outlook is the honest caveat — this is not a defensive anchor in the same class as C52, but a value-income combination that rewards patience.
Iggy’s Insights: The MRT Door Paradox
Have you ever watched the frantic rush when the MRT doors open at Jurong East during peak hour? People will violently shove their way onto a train that is completely packed, ignoring the empty, perfectly functional train arriving directly behind it two minutes later.
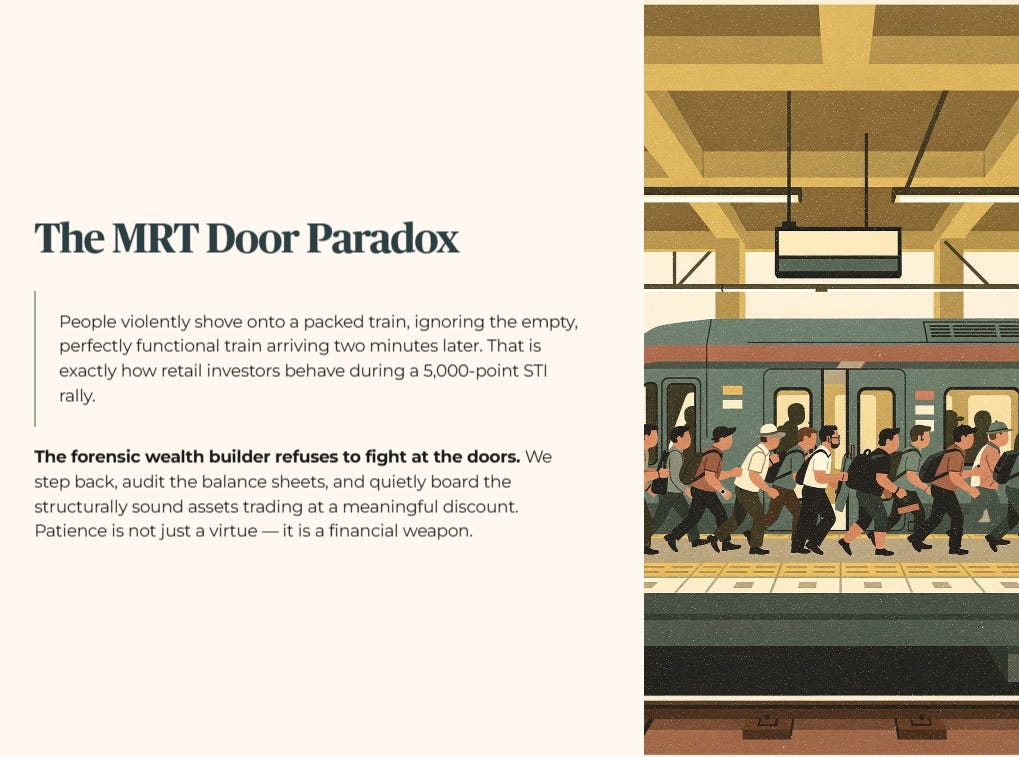
That is exactly how retail investors behave during a 5,000-point STI rally. They chase the crowded, engineered yields of over-leveraged companies, terrified of missing out. The forensic wealth builder refuses to fight at the doors.
We step back, audit the balance sheets, and quietly board the structurally sound assets trading at a meaningful discount. Patience is not just a virtue; it is a financial weapon.
Step 4: The Bottom Line (Strategic Stance)
We do not deal in hype, and we strictly do not issue blind buy, sell, or hold directives. The market changes daily, but a forensic methodology remains static. Based on this Q2 2026 audit as at 7 April 2026, here is the Strategic Stance for these five assets.
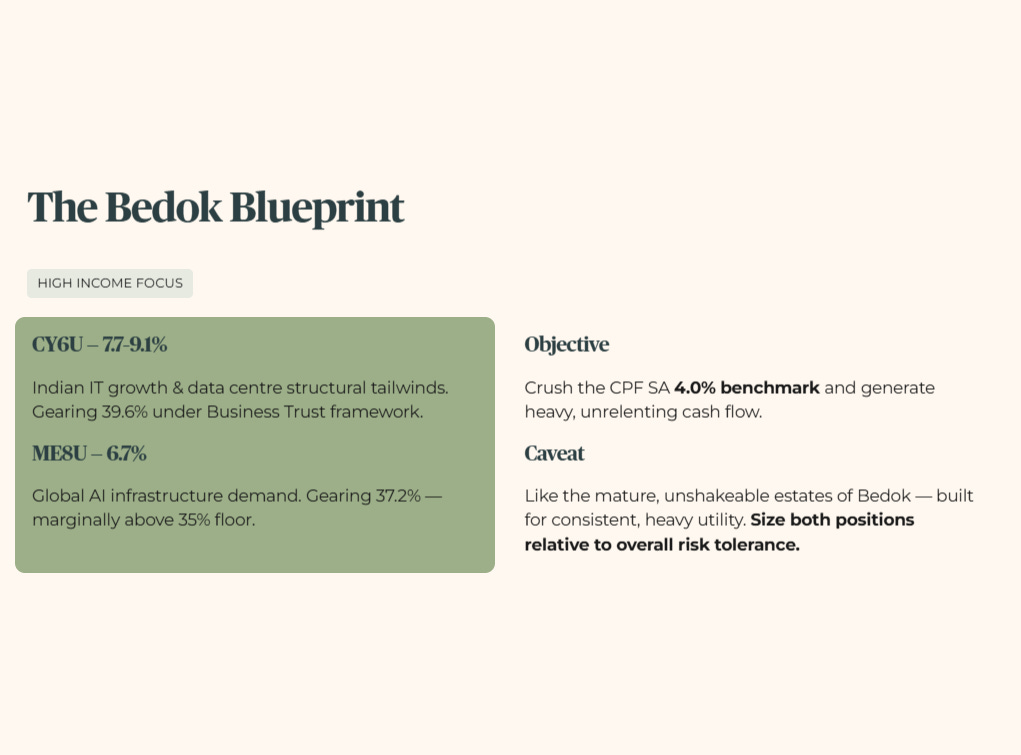
The Bedok Blueprint (High Income Focus): For the investor whose sole objective is to crush the CPF SA 4.0% benchmark and generate heavy, unrelenting cash flow, CapitaLandIndiaTrust (7.7–9.1%) and MapletreeIndustrialTrust (6.7%) fit the profile. Like the mature, unshakeable estates of Bedok, these assets are built to deliver consistent, heavy utility year after year — backed by the structural tailwinds of Indian IT growth and global AI infrastructure demand. Note that CY6U carries gearing of 39.6% under its Business Trust framework, and ME8U’s gearing of 37.2% is marginally above our 35% floor; income investors should size both positions relative to their overall risk tolerance.
The Jurong Shield (Defensive Anchor): For the retiree who prioritises sleep-at-night stability over aggressive capital gains, [stock ComfortDelGro] (5.9% trailing, 6.3% forward) serves as the ultimate Jurong Shield. Armed with a low beta and record revenue of S$5.06 billion in FY2025, it is the industrial-grade anchor that prevents your portfolio from capsizing when macro volatility strikes. The upcoming May 2026 ex-dividend date provides an imminent income catalyst.
The Tanjong Pagar Pivot (Value & Appreciation): For the patient capital allocator willing to exploit market inefficiencies, JardineCycle&Carriage (45.6% InvestingPro upside) and ThaiBeverage (22.1% upside, at 52-week low) offer profound Fair Value gaps. Like a beautifully preserved Tanjong Pagar shophouse, the market currently underestimates their intrinsic worth. You collect a steady rent while waiting for institutional capital to inevitably re-price the asset to its true historical value. Thai Bev investors should monitor the Fitch Negative outlook as a risk signal; if the rating itself is downgraded, reassess position sizing.
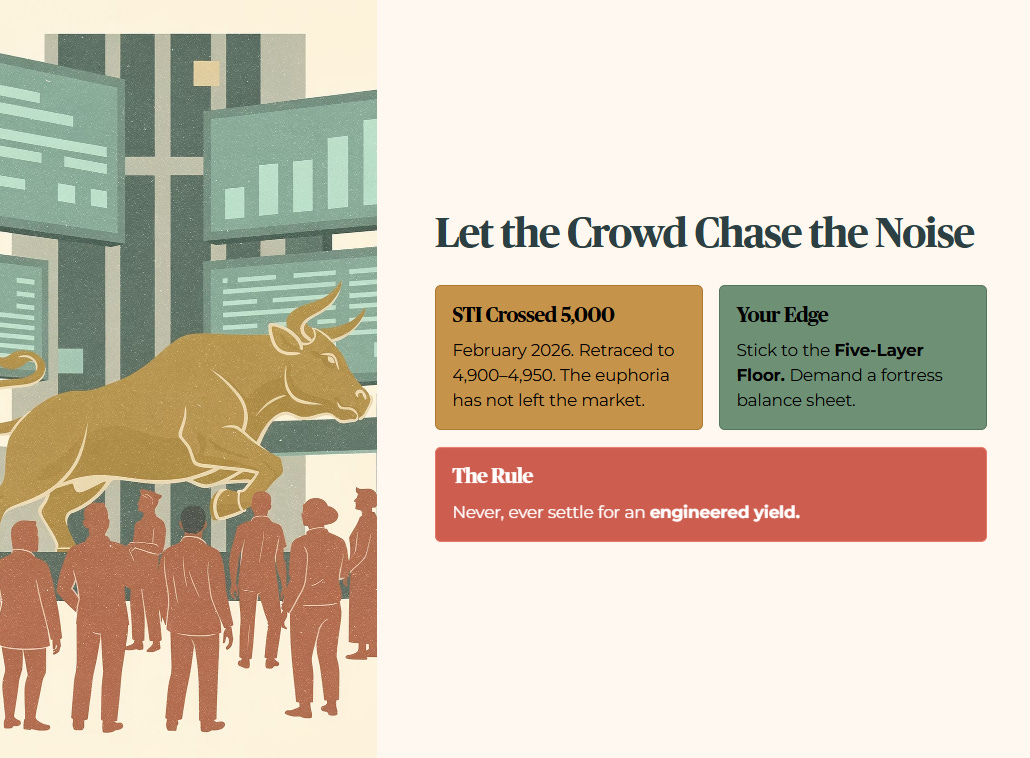
The STI crossed 5,000 in February 2026 and has since retraced to the 4,900–4,950 range. The euphoria it unleashed has not left the market. Let the crowd chase the noise. You stick to the Five-Layer Floor, you demand a fortress balance sheet, and you never, ever settle for an engineered yield.

This content is produced for educational and informational purposes only. I am not a financial advisor — I am a retail investor who applies forensic analysis to my own portfolio and shares that process publicly. Nothing here constitutes a recommendation to buy, sell, or hold any security, and no specific target prices or personalised financial advice are offered. All data is sourced from InvestingPro, public SGX filings, and verified third-party sources as at 7 April 2026; where data could not be independently verified from primary filings it is explicitly attributed to its source. Altman Z-Scores are sourced from InvestingPro and have not been independently recalculated from primary financial statements. All investments carry risk, including the potential loss of principal, and past performance is not indicative of future results. If you are making investment decisions involving CPF, SRS, or personal capital, please conduct your own due diligence or consult a MAS-licensed financial adviser before committing funds.