

The Hidden Numbers in CDL Hospitality Trusts 2H FY 2025: Decoding the 0.32¢ Distribution
The market popped +3% because NPI finally stopped bleeding. But does a 0.4% dividend hike justify the risk? We look under the hood.

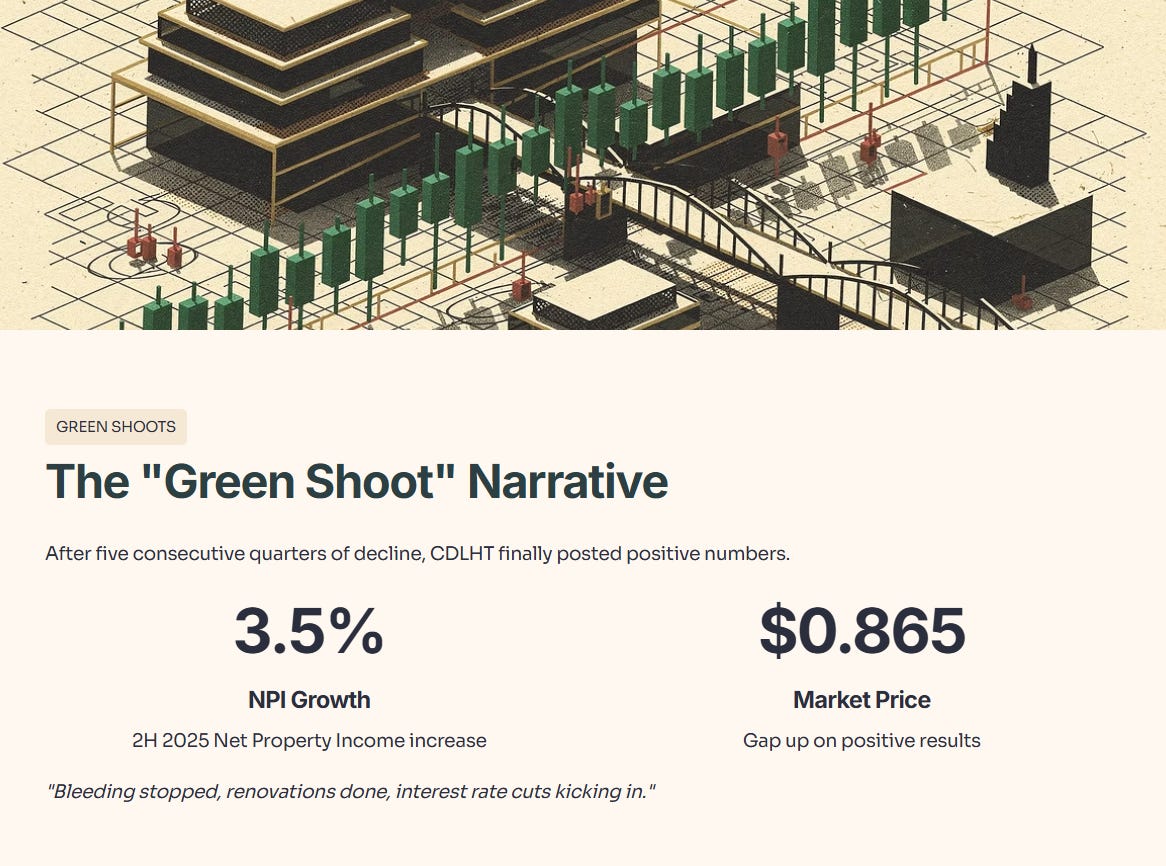
1. The “Green Shoot” Narrative
After five consecutive quarters of grinding our teeth, CDLHT finally posted a positive number where it counts. Net Property Income (NPI) for 2H 2025 is up 3.5%.
Download the Results Presentation Here:
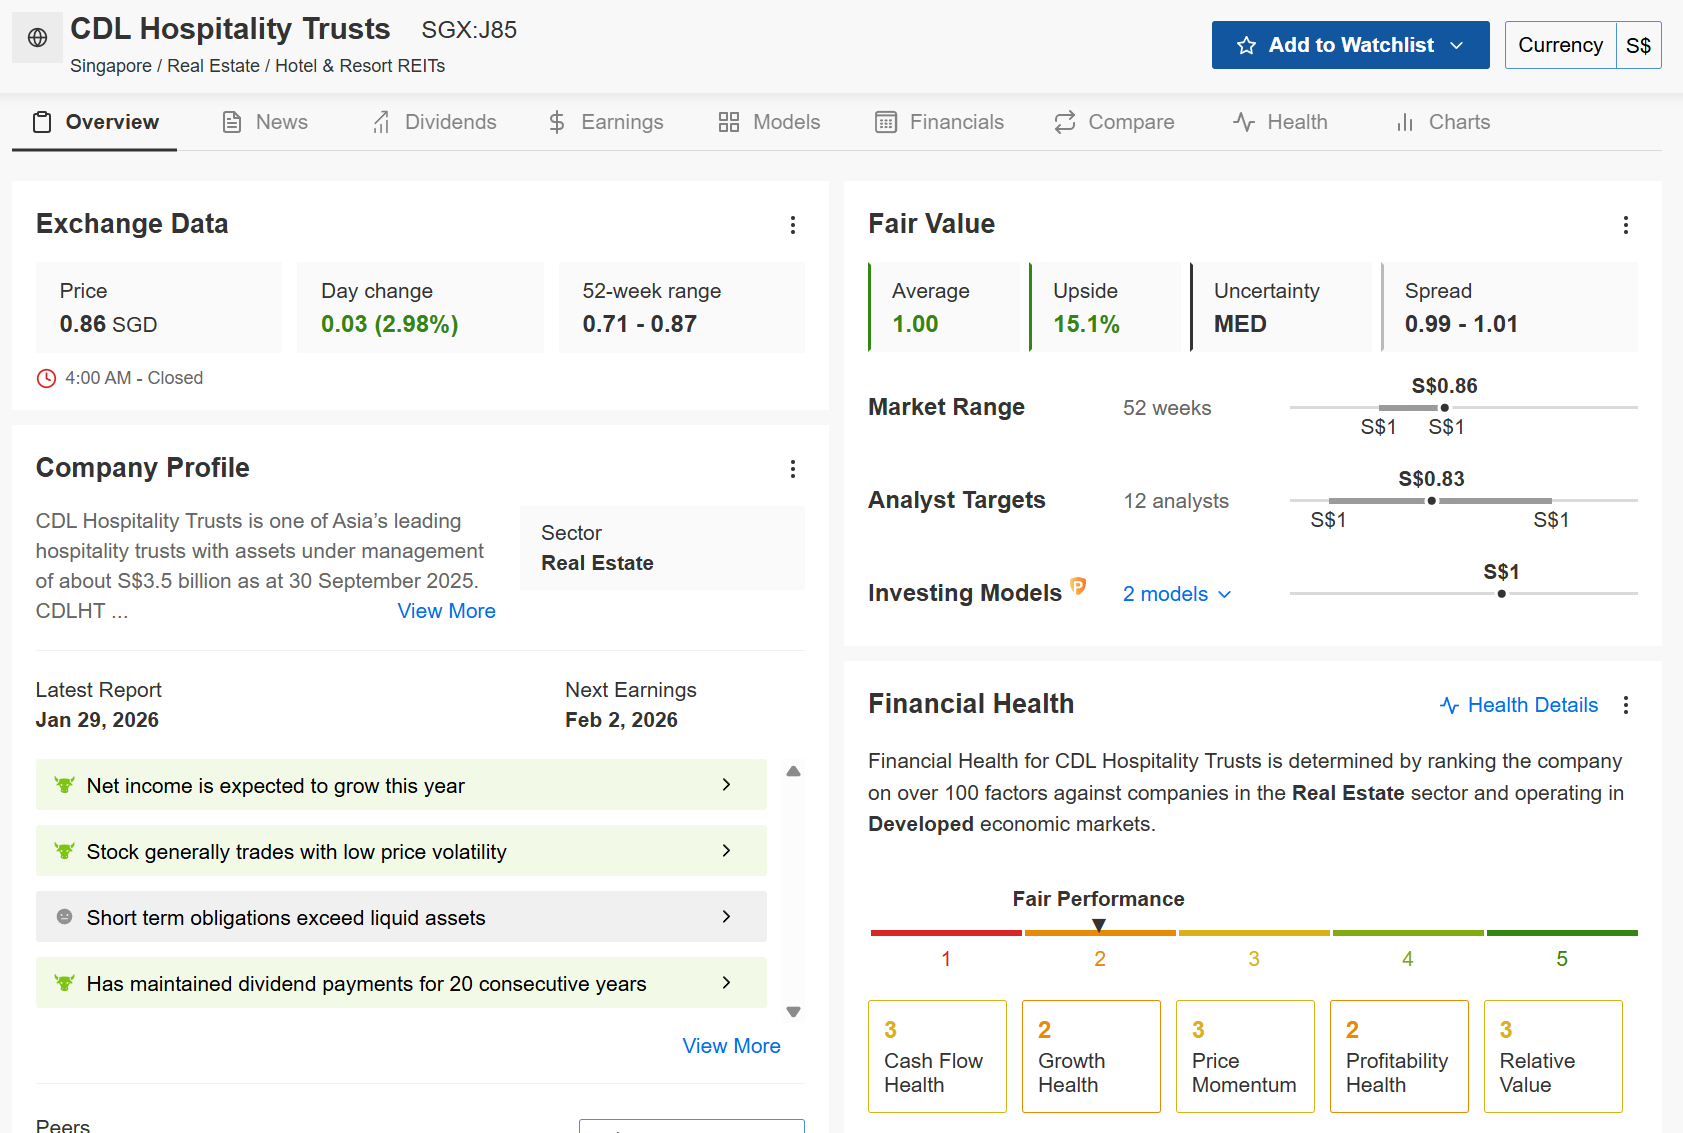
The market reaction? A gap up to S$0.865. The narrative on the street is simple: “The bleeding has stopped, the renovations are done, and interest rate cuts are finally kicking in.”
But I don’t pay my bills with narratives; I pay them with dividends. When looking at the dashboard, we see a Fair Value assessment of S$1.00 (representing a 15% discount to the model) clashing with a Financial Health score of 2/5 on Growth.

Is this a value trap or a genuine turnaround? Let’s strip the paint off the walls.
In This Article:
The Reality Check (InvestingPro Analysis)
The Deep Dive (Slide-by-Slide)
The Analysis Summary (Scorecard)
The Strategic Outlook
The Verdict (Cigar Butt or Compounder)
Iggy’s Bottom Line
InvestingPro Reality Check
Iggy's Verdict
🦎 About Iggy the Investing Iguana
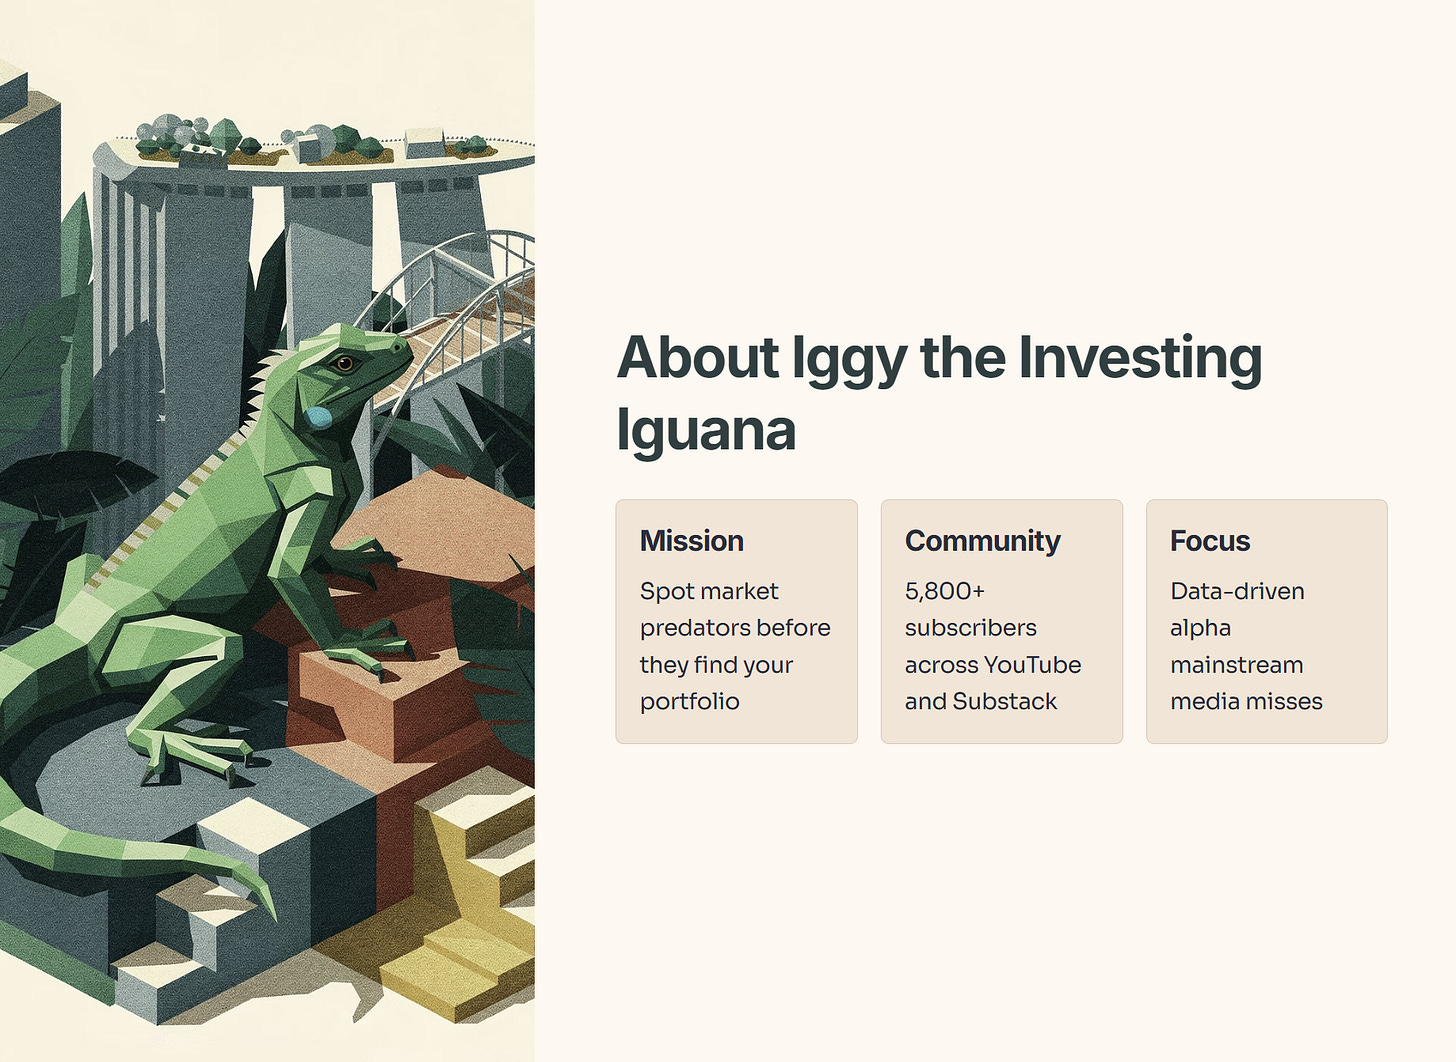
Welcome to the Iguana Pit! If you’re new here, I’m Iggy: your guide through the dense jungle of the Singapore markets. My mission is simple: to spot the predators before they spot your portfolio.
We are now 5,800+ subscribers strong across YouTube and Substack, focusing purely on the data-driven alpha that mainstream media misses.
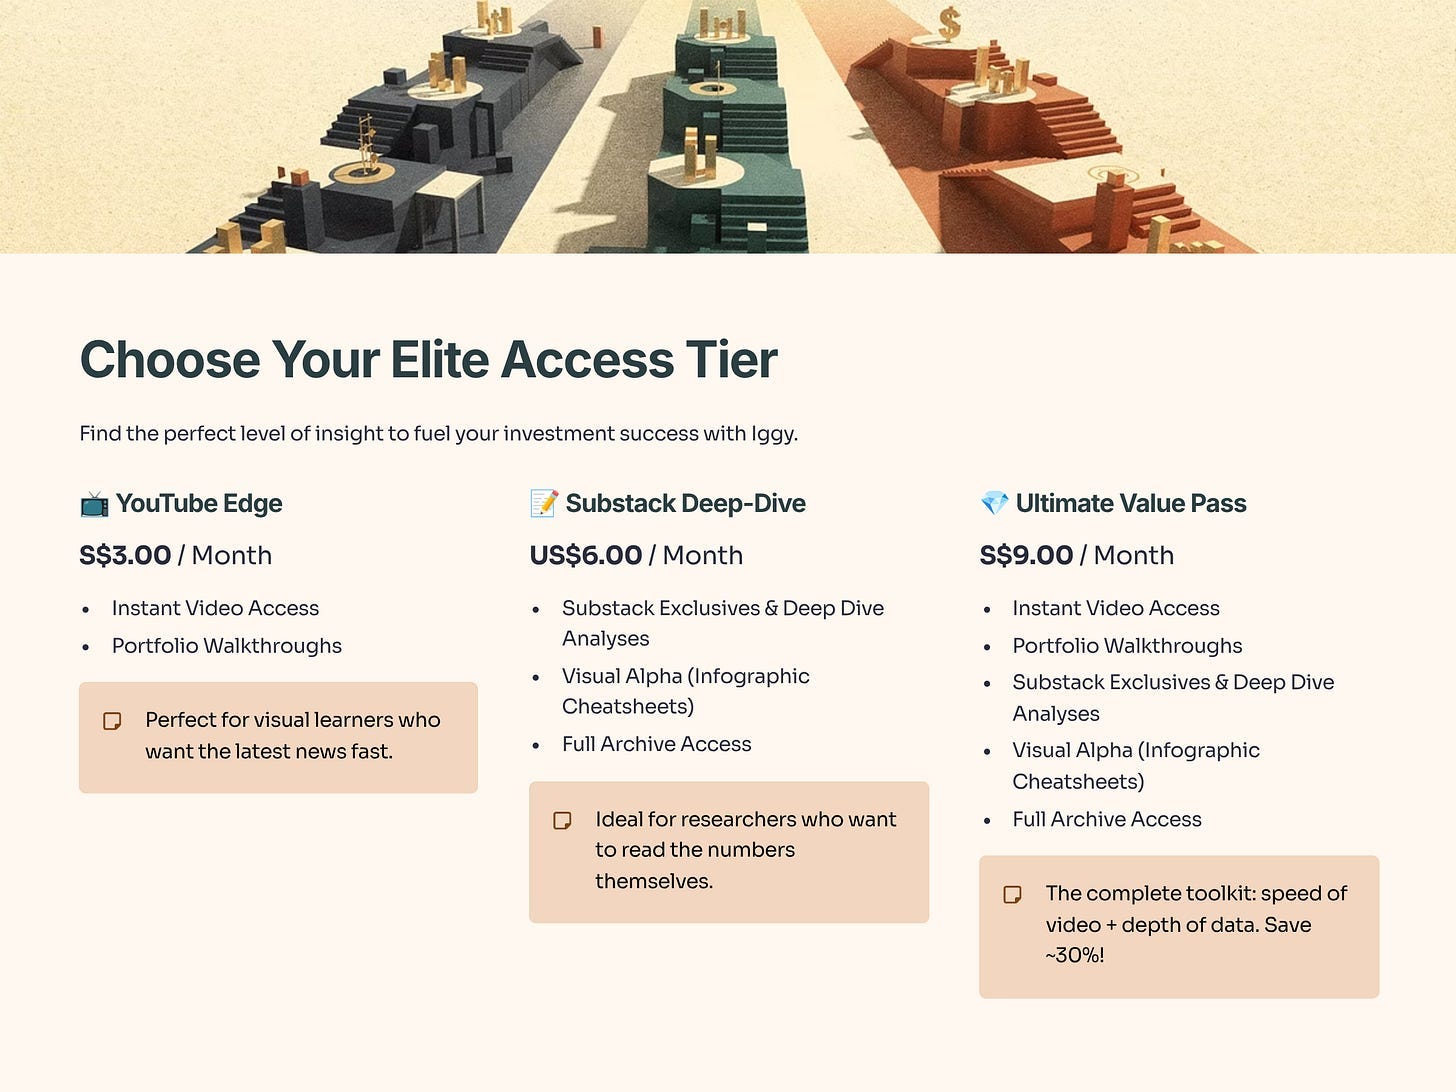
🚀 Join the “Elite 150” Inner Circle
Real alpha is found behind the velvet rope. Stop following the herd and start following the data with our 150+ paid members.
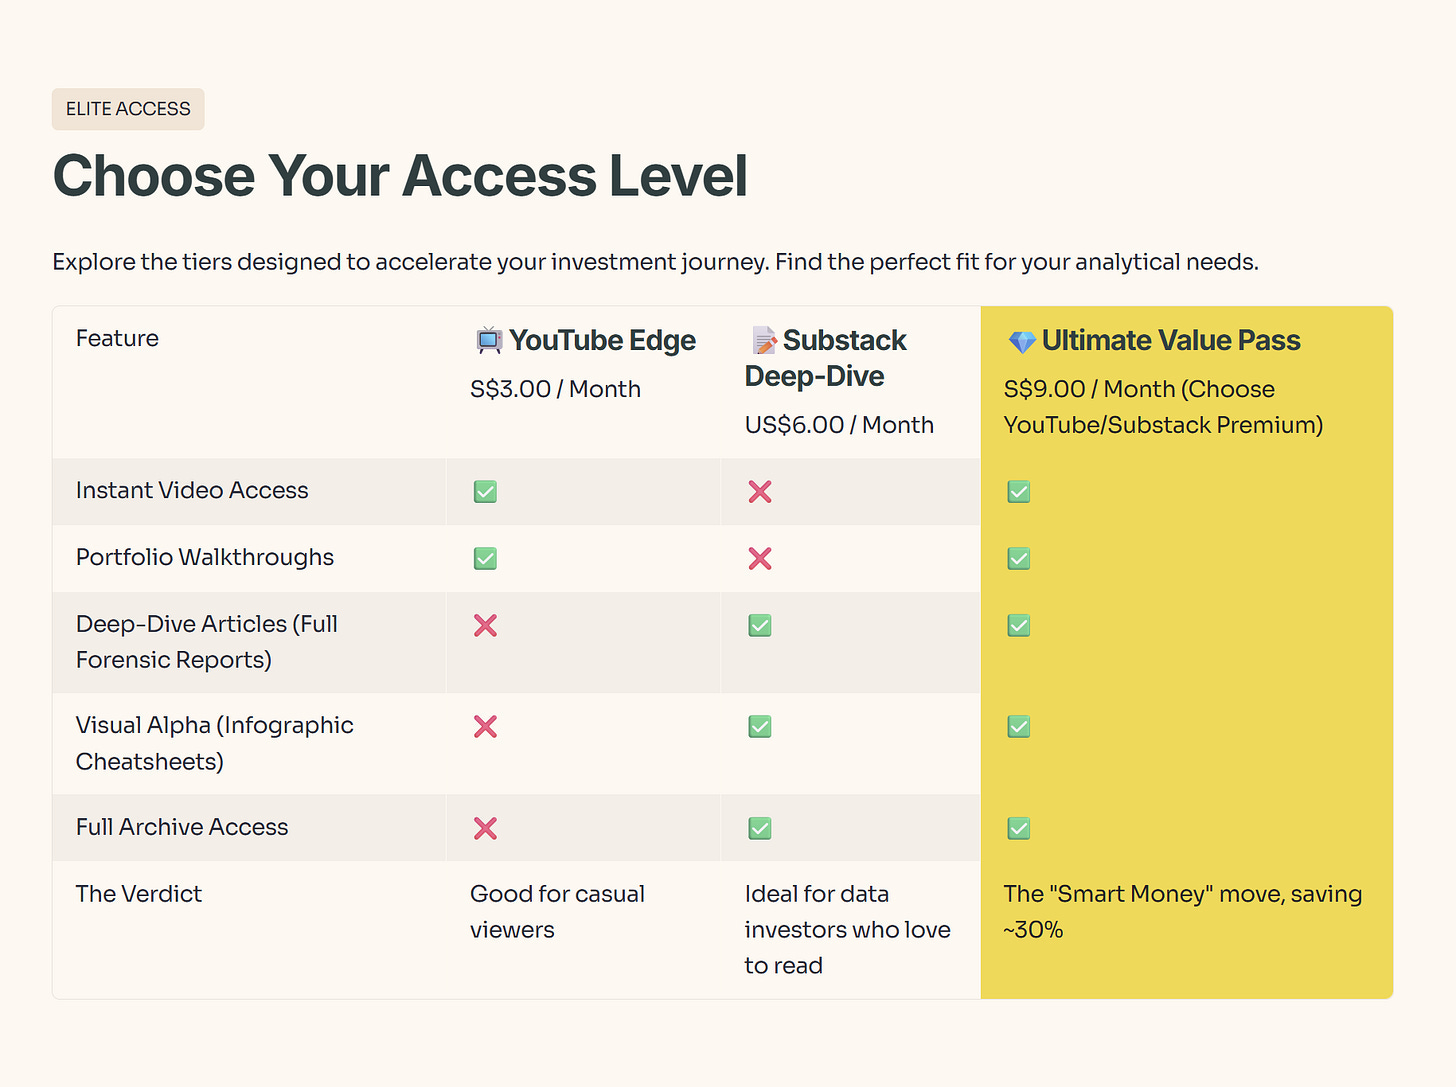
📺 The YouTube Edge (S$3/mo): Beat the Delay.
Instant Access: Watch new videos the moment they drop.
The Free Tier Trap: Free subscribers wait up to 14 days to see the same video. (By then, the news is old and the trade is gone).
📝 The Substack Deep-Dive (US$6/mo): Unlock the Vault.
Zero Paywalls: Read the full “Deep Dive” articles and “Substack Exclusive” articles found only on Substack.
Visual Alpha: Download exclusive Infographic Cheatsheets not available to free readers.
💎 The Ultimate Value Pass (S$9/mo): (BEST VALUE)
Get It All: Paid via YouTube, this bundle grants you Instant Video Access AND Full Substack Access.
The Math: You save ~30% compared to buying them separately. It’s the “Smart Money” move.
Why wait 2 weeks for old news? Get the data while it’s fresh. 👉 Join Here: https://www.youtube.com/@InvestingIguana/membership
Concept Corner: RevPAR Unpacked
Before we dig into CDL’s specific numbers, let’s pause for a masterclass on one of the most misunderstood metrics in hospitality REITs: RevPAR (Revenue Per Available Room).
You’ll hear management throw this around like it’s gospel on every earnings call, but here’s why it matters more than raw revenue: a hotel isn’t a factory that can simply run longer or build another unit. CDLHT has exactly 4,924 rooms—that’s the hard ceiling. Their production is capped by pillows available, not ambition.
RevPAR = Total room revenue ÷ Total rooms available (occupied or not)
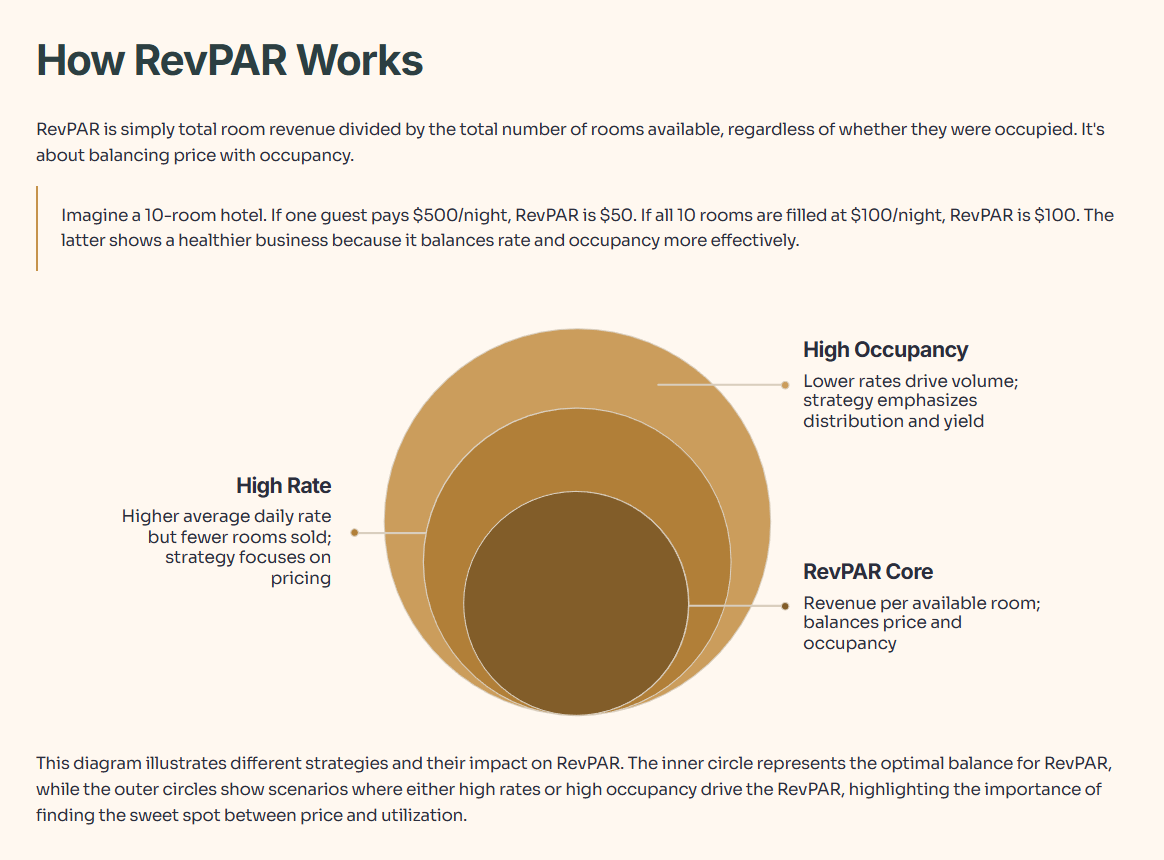
Here’s the gut-check: Imagine a 10-room boutique charging $500/night. If only one guest shows up, your RevPAR is $50 (nine empty rooms dragging you down). Now flip it: charge $100/night but fill all 10 rooms, and you’re at $100 RevPAR—double the first scenario. Same rooms, different story.
RevPAR tells you the real health because it captures both pricing power AND demand.
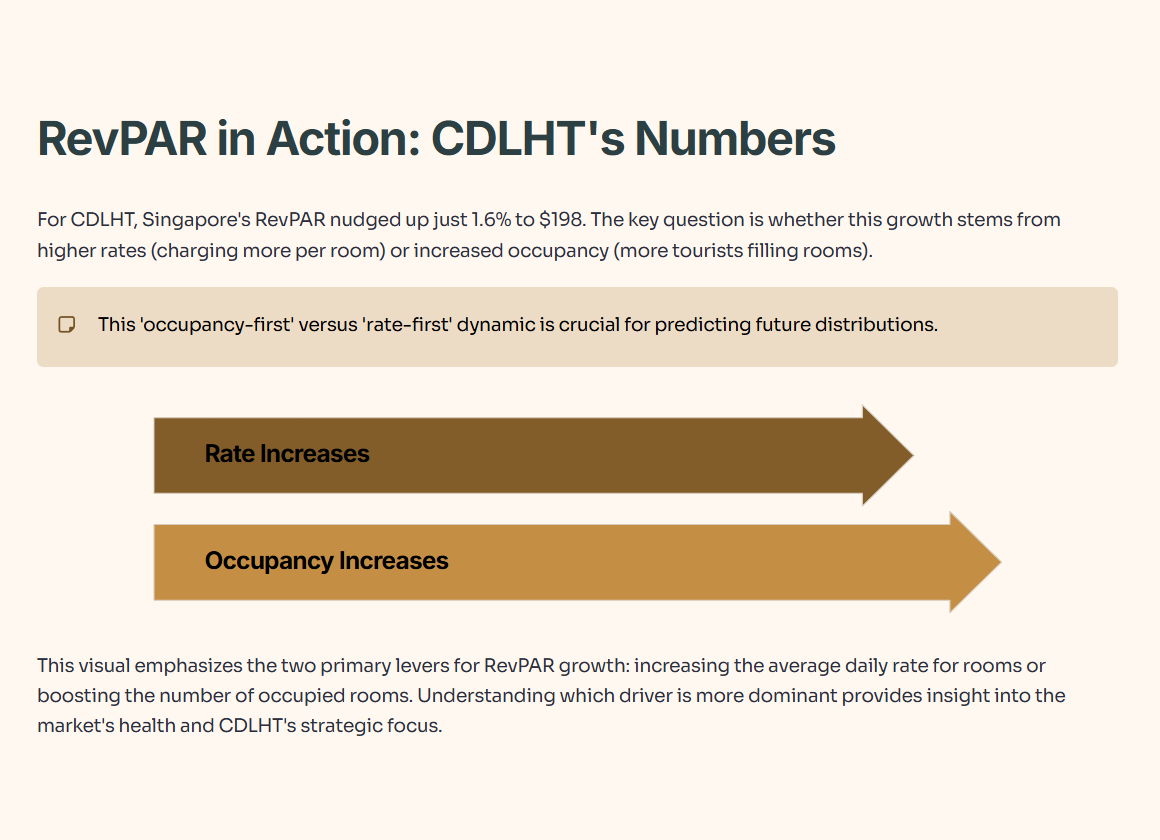
The CDLHT Question: Singapore RevPAR is up just 1.6% to $198. But ask yourself—is that from higher room rates or more tourists actually flying back to Changi? This occupancy-first vs. rate-first tension is the invisible hand controlling distribution sustainability over the next 24 months.
2. The Reality Check (InvestingPro Analysis)
The slides say “Poised for Recovery,” but what do the institutional models say?
The “Cyborg” Verdict:
I plugged the data into the InvestingPro Fair Value model (which aggregates 10+ metrics like DCF and P/E to remove human bias).
Source: InvestingPro data. Unlock these institutional tools for yourself: Use code INVESTINGIGUANA for an exclusive 55% discount to kickstart 2026.
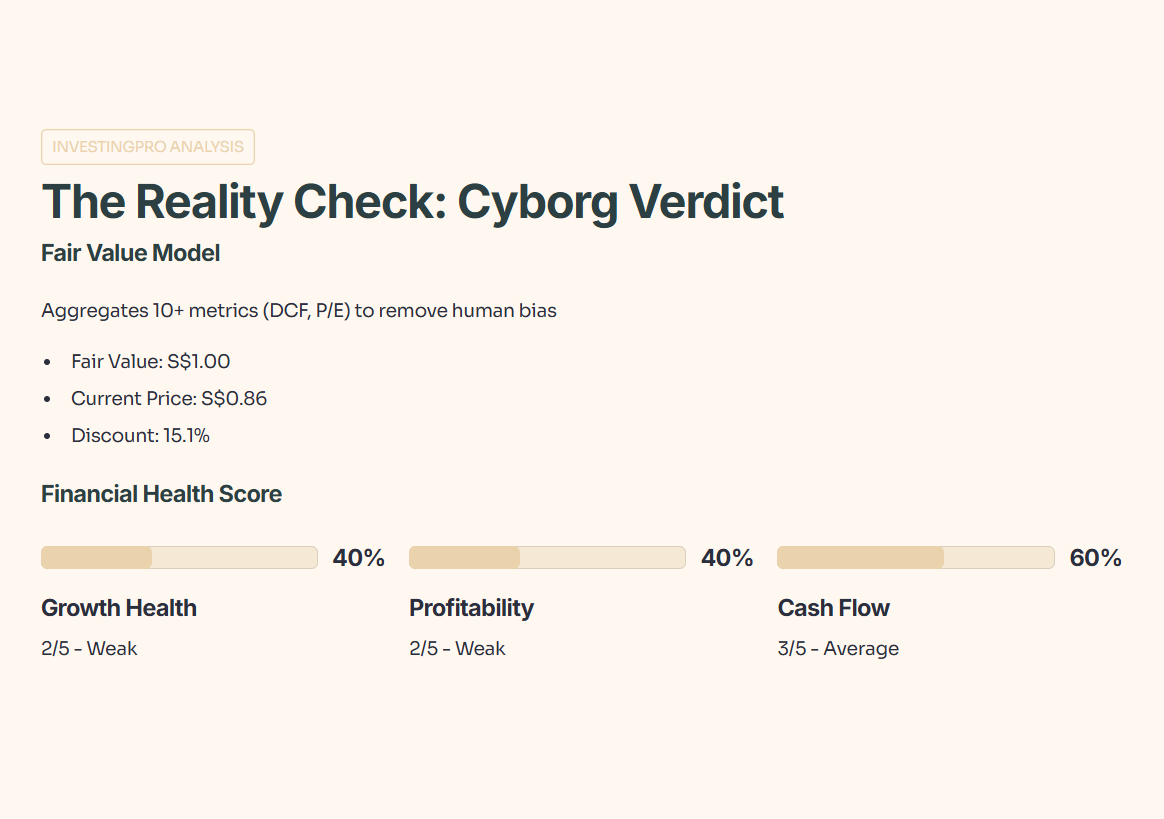
The Valuation: The model calculates a Fair Value of S$1.00. At the current price of S$0.86, the stock is trading at a 15.1% discount to its mathematically derived value.
The Health Check: Look at the Financial Health Score:
Growth Health: 2/5 (Weak)
Profitability Health: 2/5 (Weak)
Cash Flow Health: 3/5 (Average)
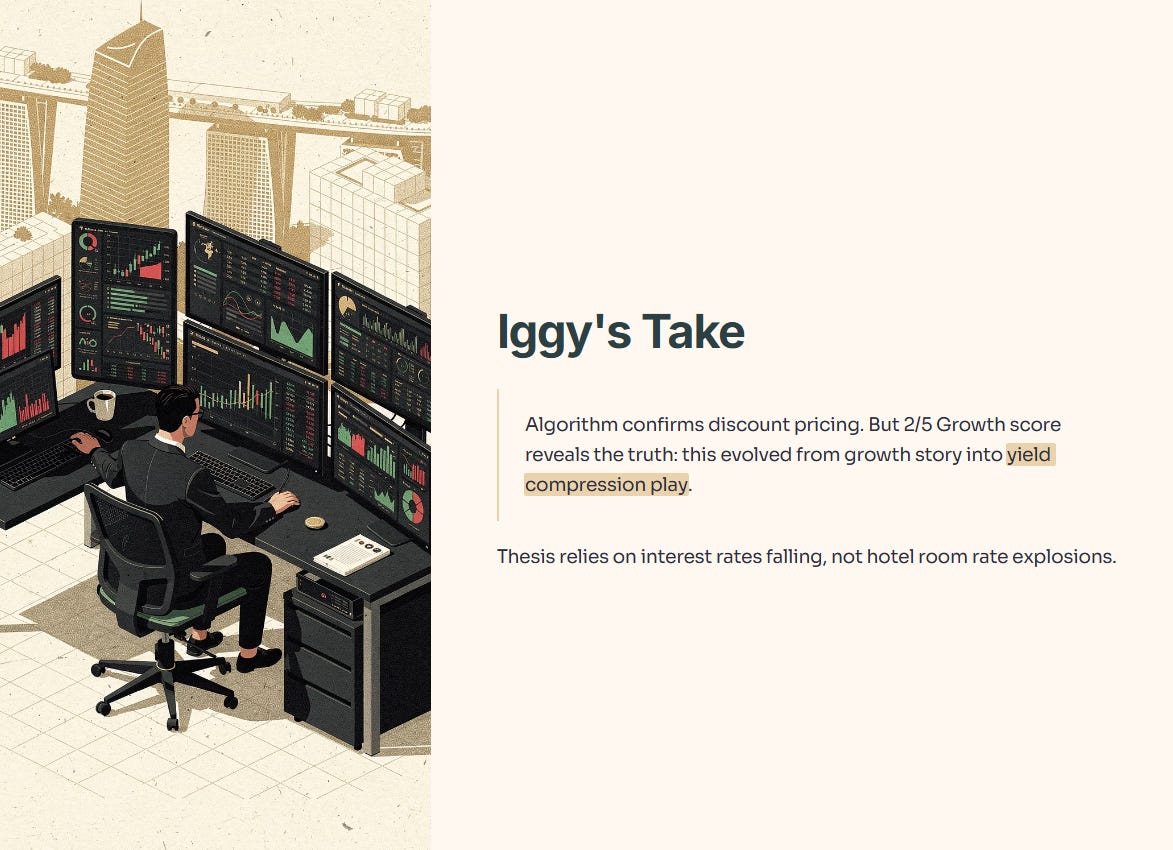
Iggy’s Take: The algorithm agrees with the value investors—it’s priced at a discount. But the “2/5” on Growth confirms my suspicion: this has evolved from a growth story into a “yield compression” play. The thesis relies heavily on interest rates falling rather than a sudden explosion in hotel room rates.
3. The Deep Dive (The “Slide-by-Slide” Breakdown)
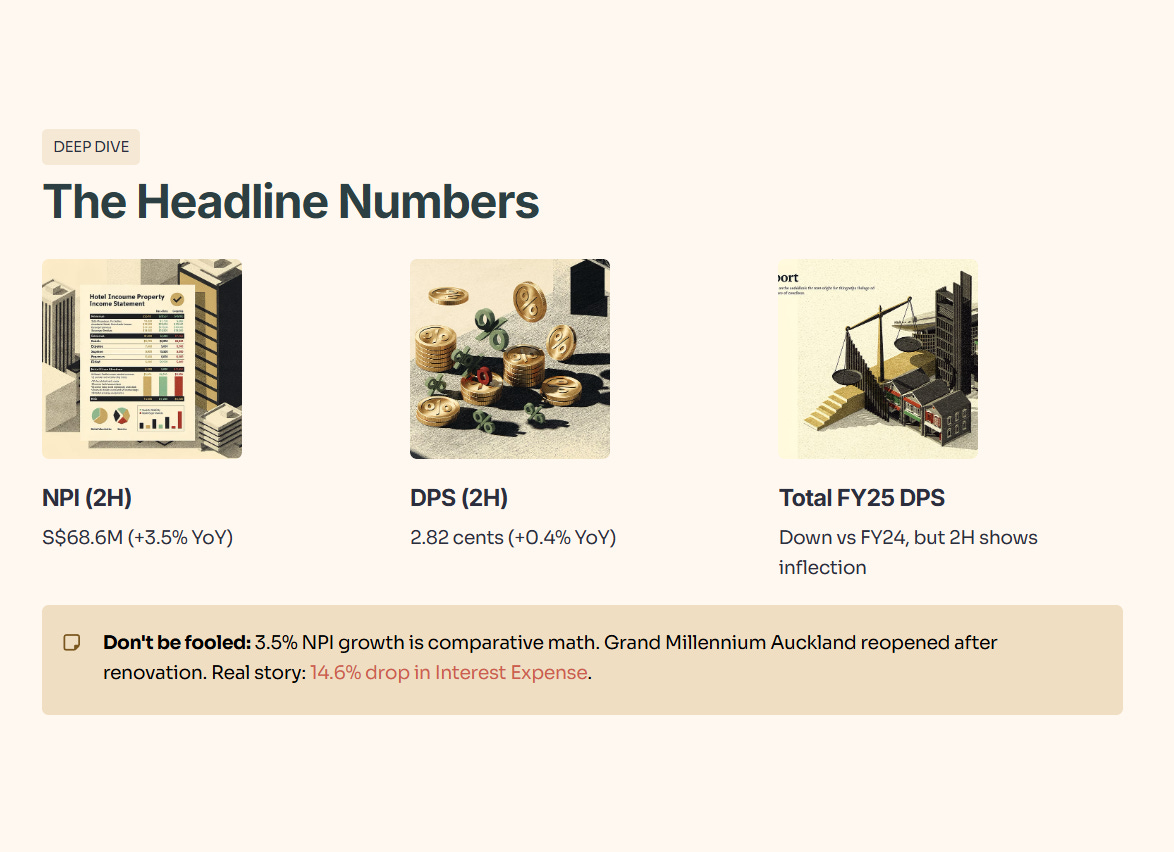
The “Headline” Numbers
NPI (2H): S$68.6M (+3.5% YoY)
DPS (2H): 2.82 cents (+0.4% YoY)
Total FY25 DPS: Down overall vs FY24, but the 2H acts as the potential inflection point.
Interpretation:
Don’t let the “3.5% NPI Growth” suggest business is booming. A significant portion of this is comparative math. Last year, assets like the Grand Millennium Auckland were closed for renovation. This year, they are operational. The real story isn’t revenue—it’s the 14.6% drop in Interest Expense.
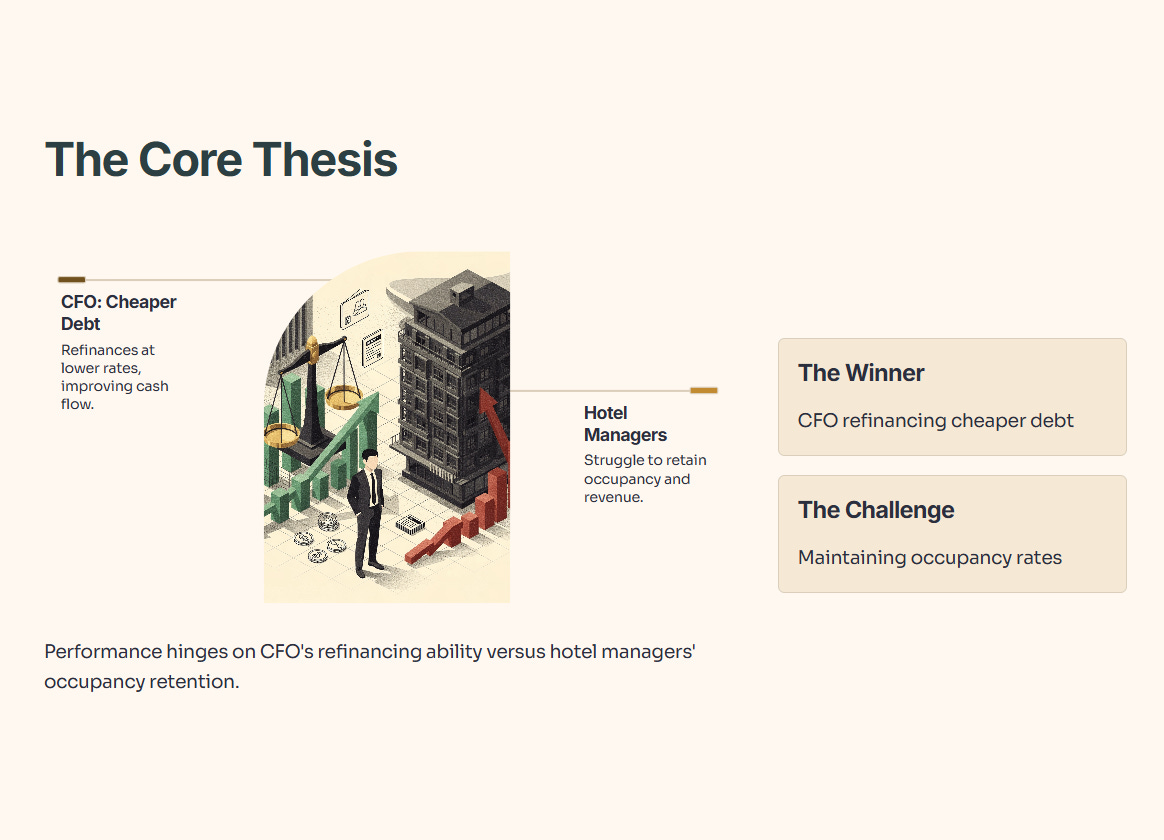
The Insight: This is the core thesis. The performance currently hinges on the CFO’s ability to refinance debt cheaper than the hotel managers can lose occupancy. So far, the CFO is winning.
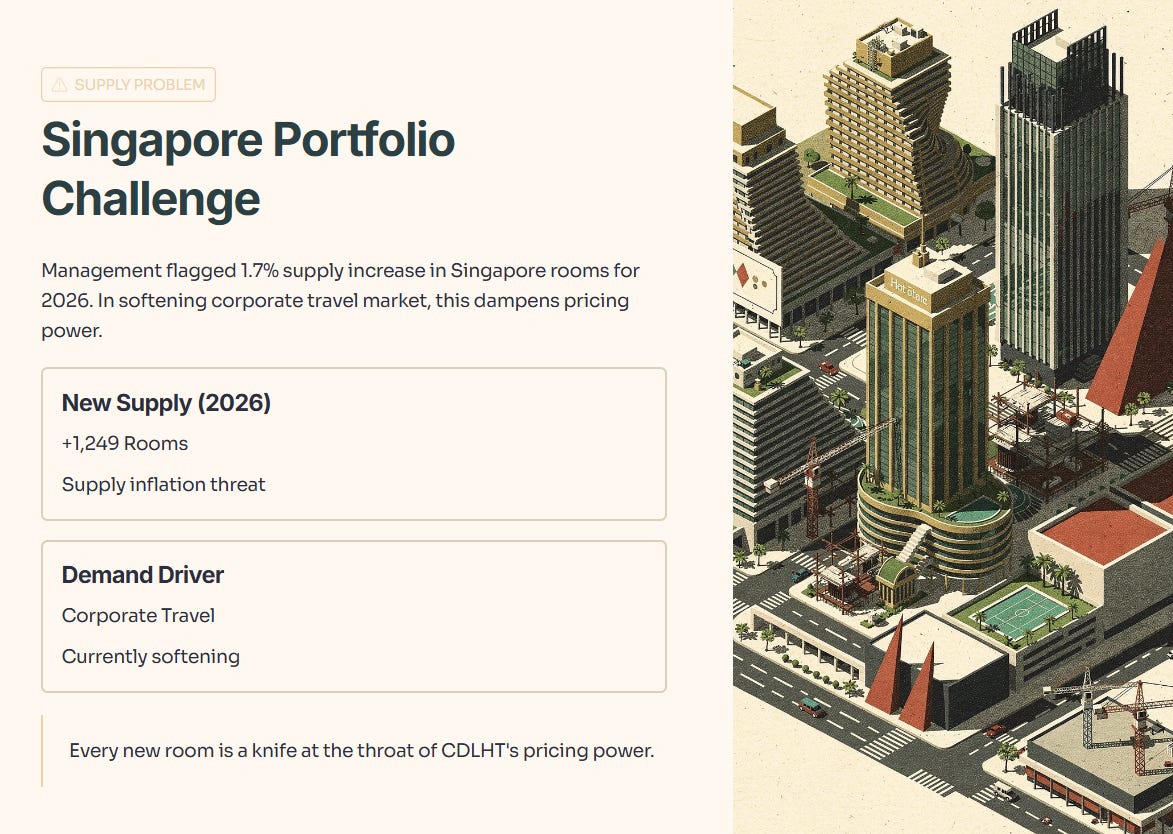
The Singapore Portfolio (The “Supply” Problem)
Management flagged a 1.7% supply increase in Singapore rooms for 2026. In a softening corporate travel market, that can dampen pricing power. A 1.7% supply increase sounds small until you realize every new room is a knife at the throat of CDLHT's pricing power.
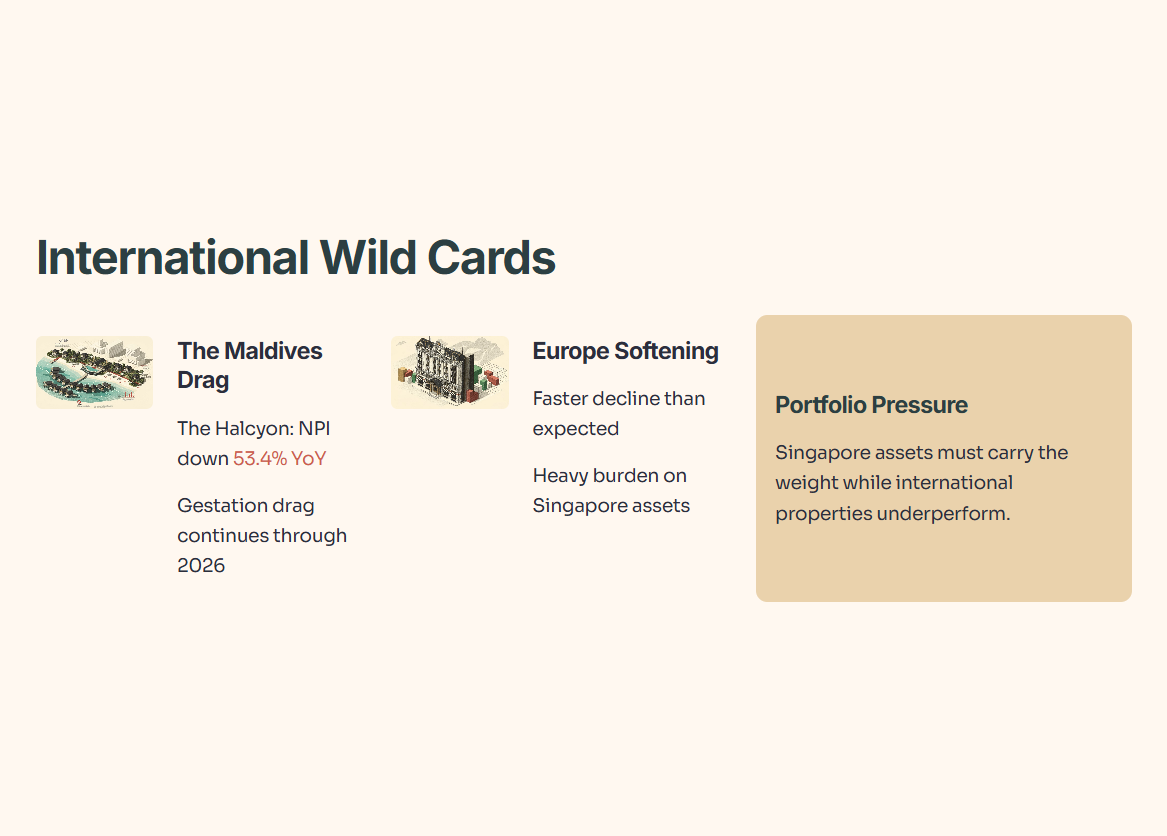
The International “Wild Cards”
The Maldives asset (The Halcyon) remains a “gestation” drag, with NPI down 53.4% YoY. Management expects this to continue through 2026. Meanwhile, Europe is softening faster than expected. This places a heavy burden on Singapore assets to carry the portfolio’s weight.
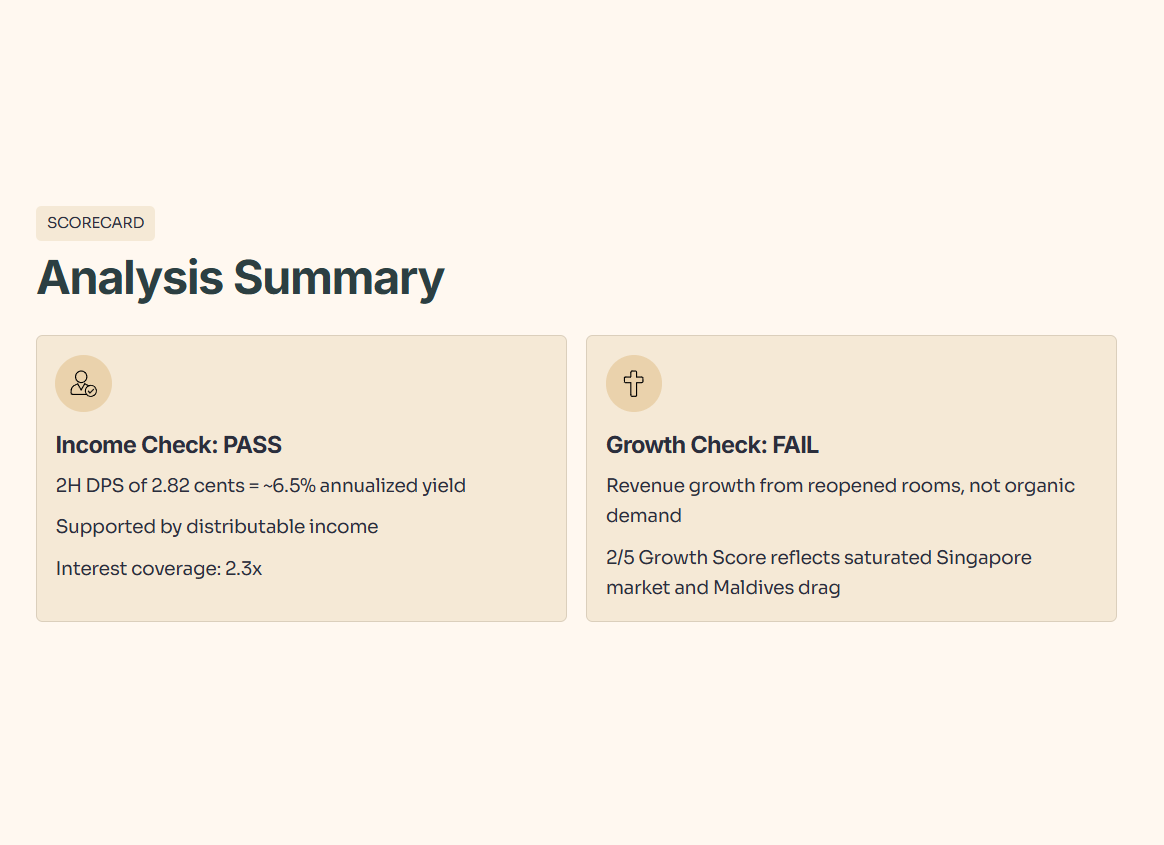
4. The Analysis Summary (The Scorecard)
Income Check: ✅ (PASS)
The 2H DPS of 2.82 cents implies an annualized yield of roughly 6.5% at current levels. The payout is supported by distributable income, and the interest coverage ratio is a functional 2.3x.
Growth Check: ❌ (FAIL)
Revenue growth is driven by reopening renovated rooms, not organic demand. The “2/5” Growth Score reflects the saturated Singapore market and the Maldives drag.
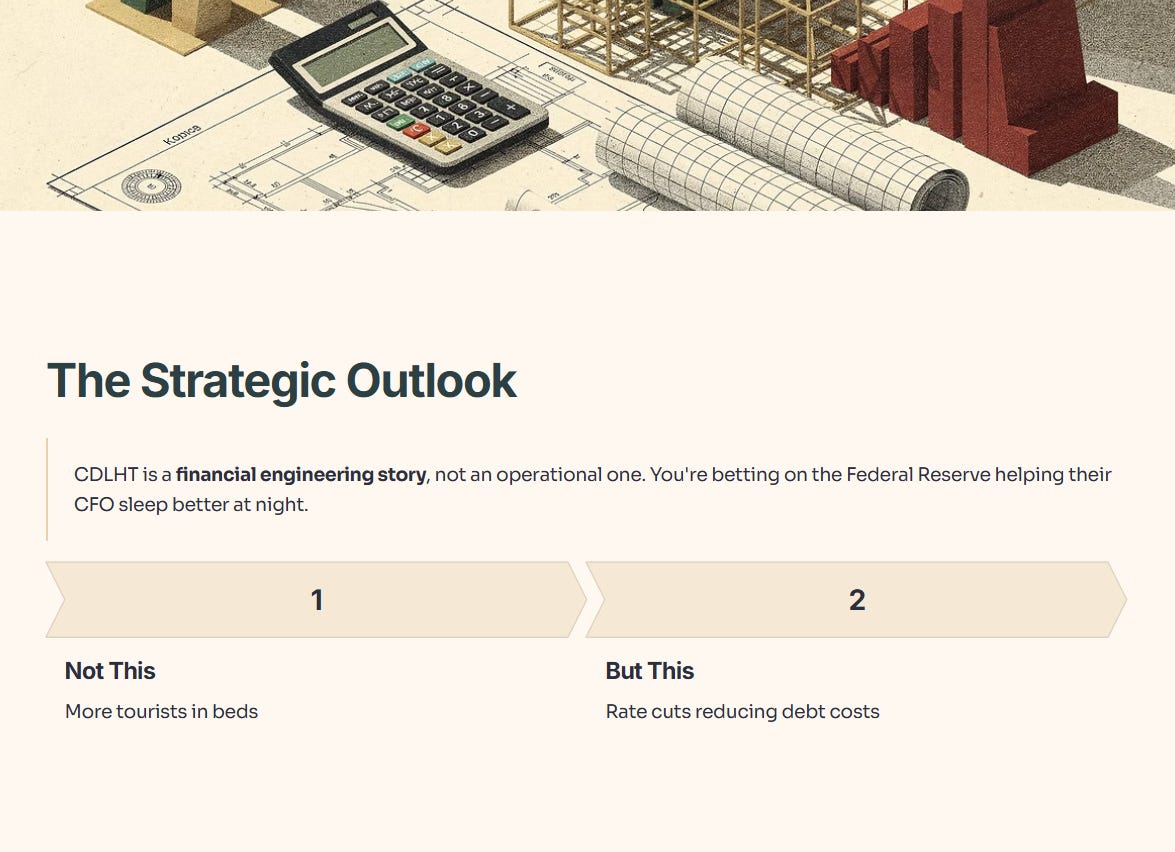
5. The Strategic Outlook
Here’s the unfiltered reality: CDLHT is currently a financial engineering story, not an operational one. You aren’t betting on more tourists sleeping in their beds; you’re betting on the Federal Reserve helping their CFO sleep better at night.
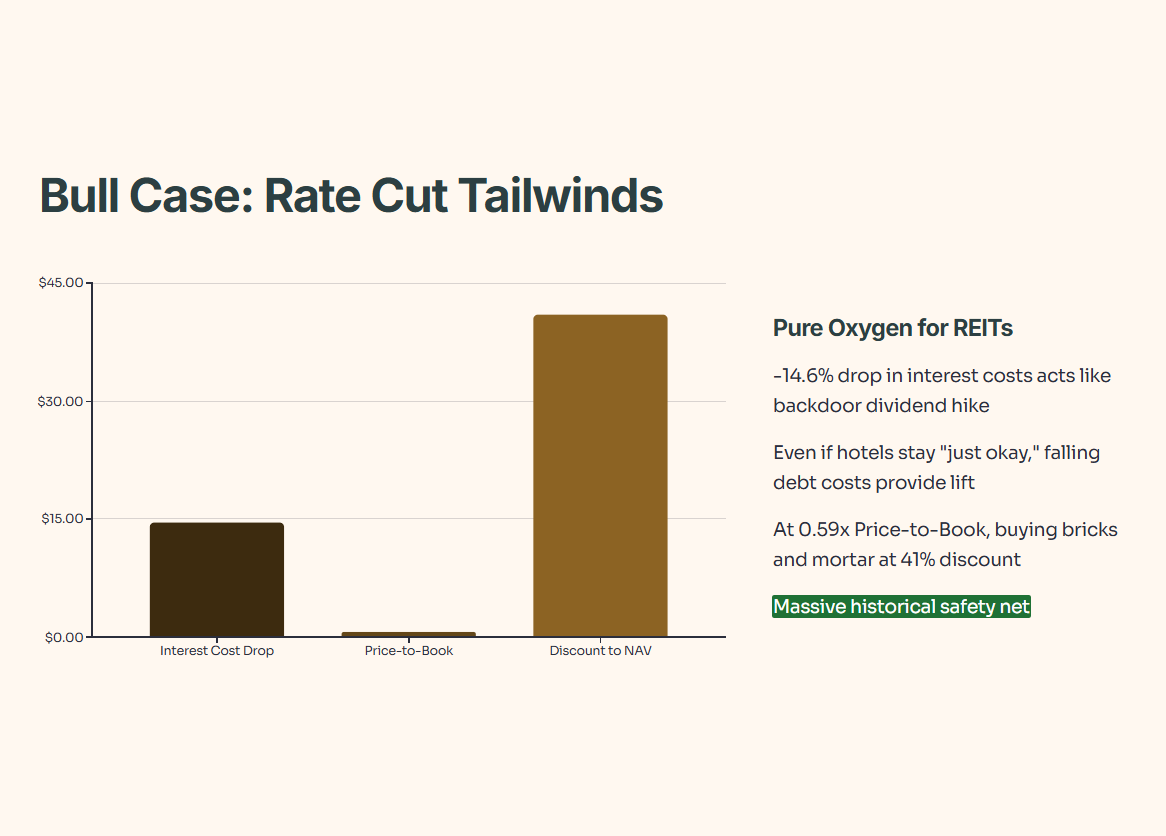
The Bull Case: The “Rate Cut” Tailwinds
The primary engine here is the -14.6% drop in interest costs. In the REIT world, that is pure, unadulterated oxygen. Even if the hotels stay “just okay,” the falling cost of debt acts like a backdoor dividend hike. Plus, at 0.59x Price-to-Book, you’re buying the bricks and mortar at a 41% discount. That is a massive historical safety net for those who like to buy dollars for sixty cents.
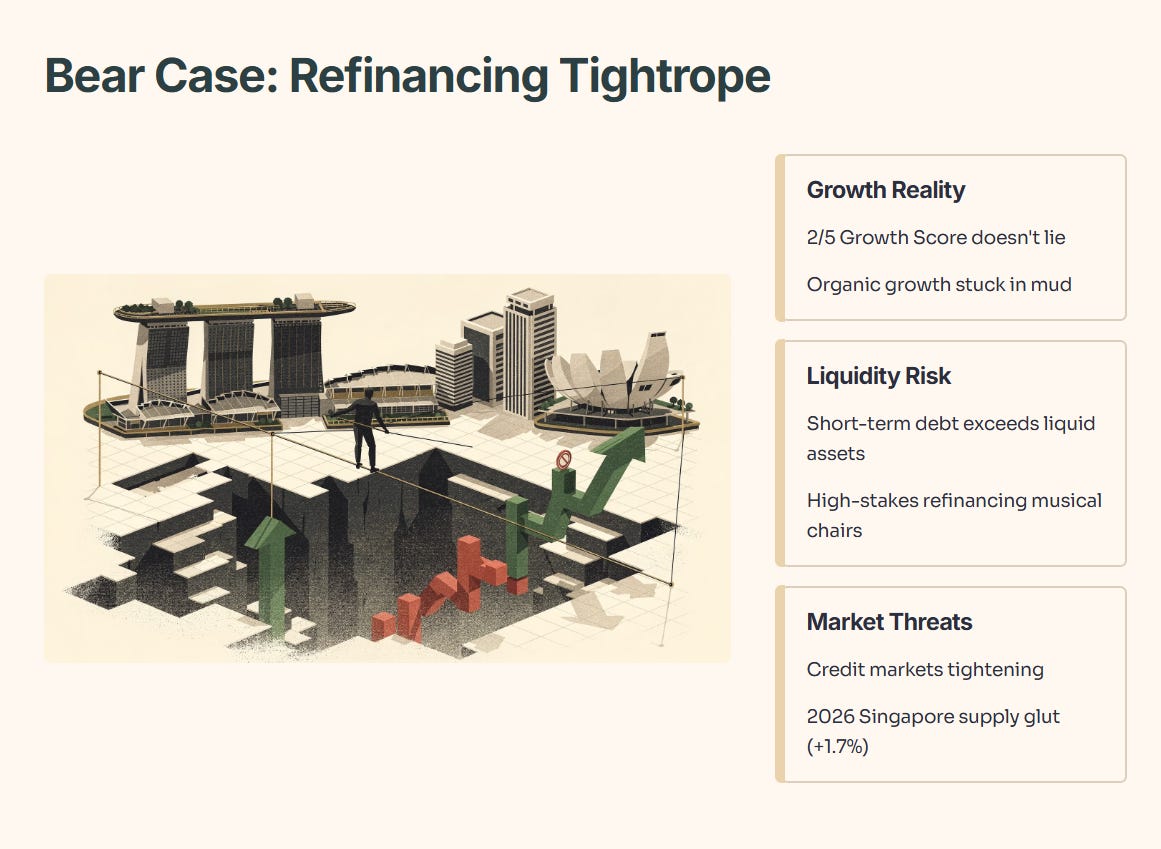
The Bear Case: The “Refinancing” Tightrope
The “2/5 Growth Score” doesn’t lie. Organic growth is stuck in the mud, and with short-term debt exceeding liquid assets, they are essentially playing a high-stakes game of refinancing musical chairs. If the credit markets tighten or the 2026 Singapore supply glut (+1.7% rooms) hits harder than expected, that “safety net” starts to look a lot thinner.
The Verdict: “Cigar Butt” or Compounder?
