

🦎 The Iguana’s Guide to a S$500k Nest Egg: Passive ETF, Active Growth, or Bond Shelter?
A forensic audit of ES3, LGSDE, and LGSDBF: Navigating the STI’s S$5.00 peak to protect your S$500,000 retirement engine.

🦎 Iggy’s Retirement Masterclass: The S$500k Portfolio Audit
Date: Feb 01, 2026
Thinking about how to deploy S$500,000 for retirement in 2026? With the STI hitting record highs of nearly 5,000 points, the “easy money” phase of the cycle has officially transitioned into something much more complex.
This article is a forensic audit of the three most popular paths for Singaporean retirement capital: the Passive STI ETF (ES3), the Active Growth Fund (LGSDE), and the Short-Duration Bond Fund (LGSDBF). We aren’t just looking at who had the best year; we are looking at total cost of ownership, dividend sustainability in a “Hawkish” MAS environment, and how to protect a half-million dollar nest egg when valuations are trading well above their historical average (previously estimated at about 2.25 standard deviations above the norm).
Whether you’re monitoring yield or evaluating potential mean reversion, this breakdown explores which vehicles align with specific risk-management goals in a high-valuation environment.
In This Article:
The State of the Market
Step 1: The Health Check (Banks & Bonds)
Step 2: The Yield Reality (Cash Flow vs. Capital Gains)
Step 3: The Price Check (Valuation & Fees)
Step 4: The Future Check (Hypothetical Scenarios)
Iggy’s Bottom Line: The S$500k Portfolio Framework
InvestingPro Reality Check
Iggy's Verdict
🦎 About Iggy the Investing Iguana
Welcome to the Iguana Pit! If you’re new here, I’m Iggy: your guide through the dense jungle of the Singapore markets. My mission is simple: to spot the predators before they spot your portfolio.
We are now 5,800+ subscribers strong across YouTube and Substack, focusing purely on the data-driven alpha that mainstream media misses.
🚀 Join the “Elite 150” Inner Circle
Real alpha is found behind the velvet rope. Stop following the herd and start following the data with our 150+ paid members.
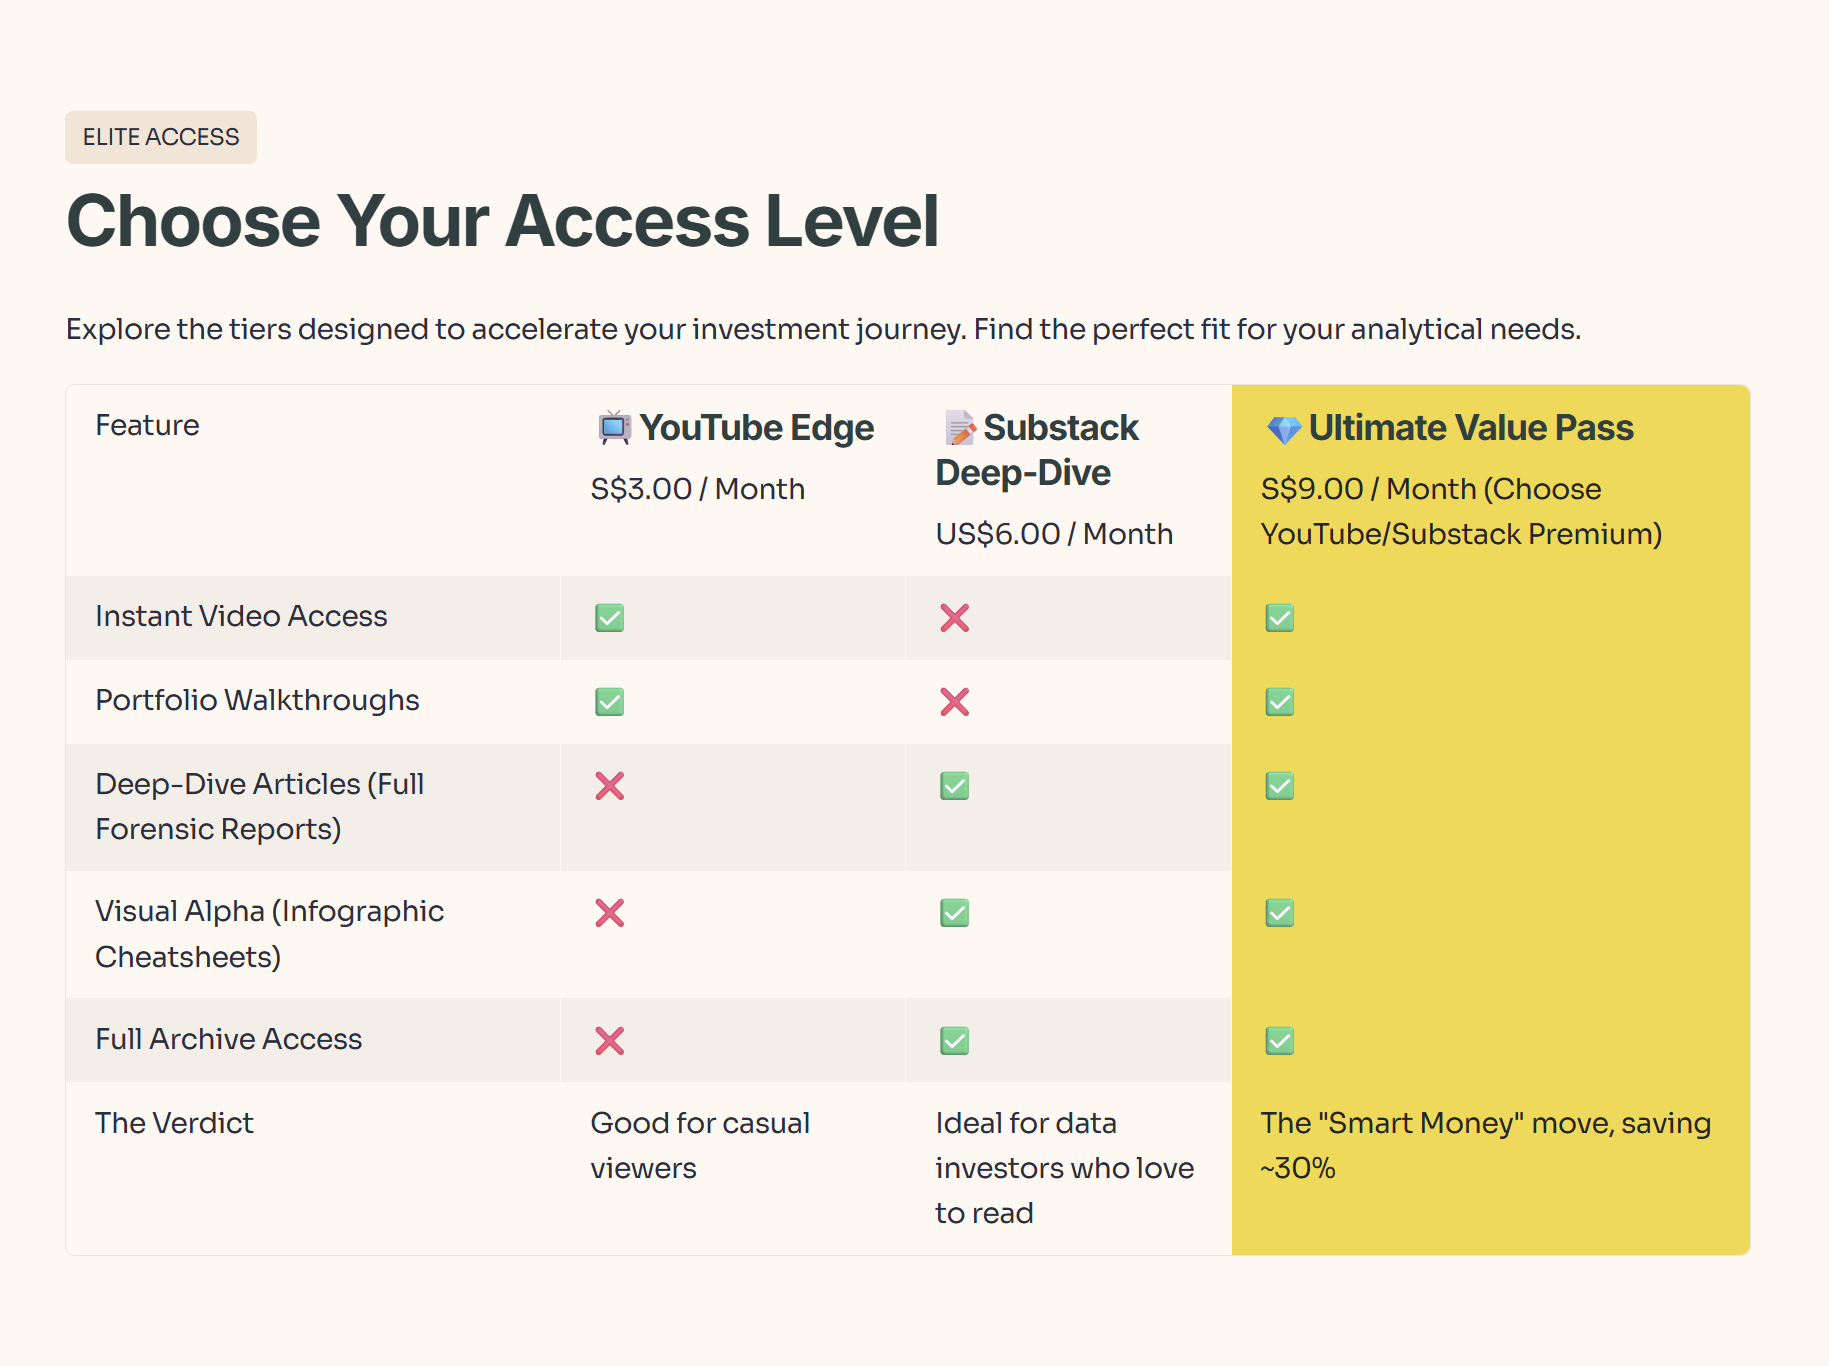
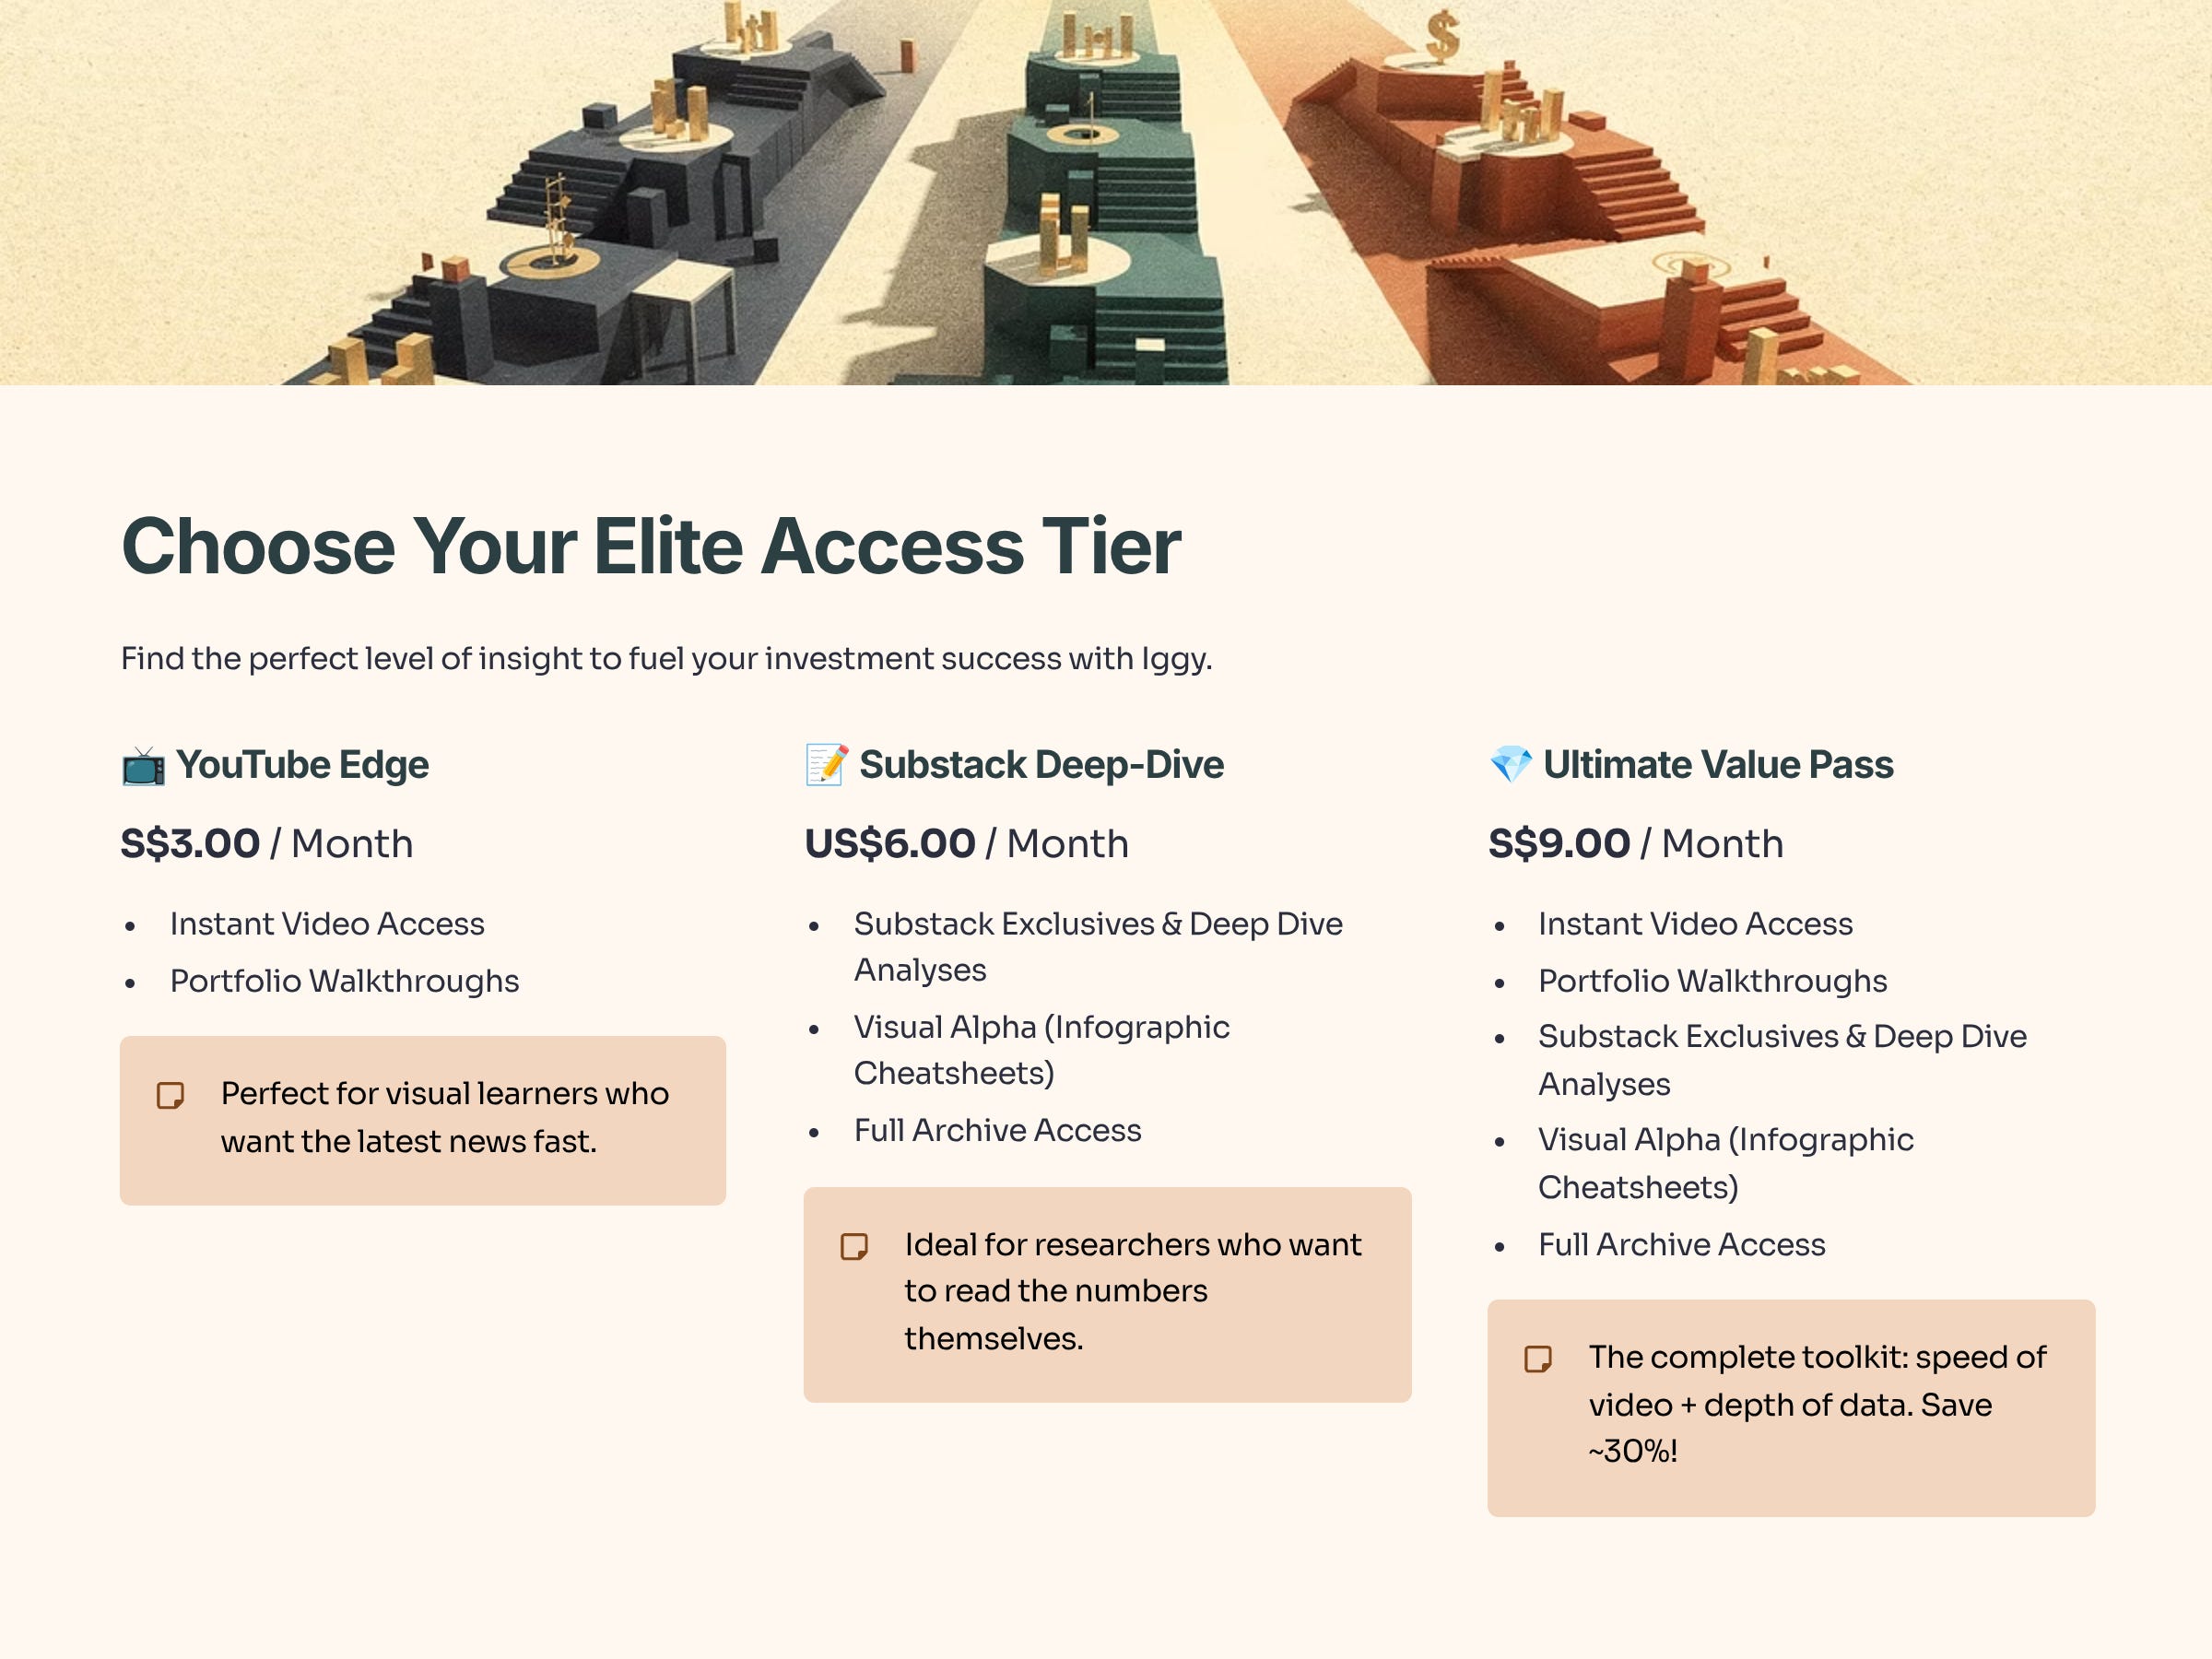
📺 The YouTube Edge (S$3/mo): Beat the Delay.
Instant Access: Watch new videos the moment they drop.
The Free Tier Trap: Free subscribers wait up to 14 days to see the same video. (By then, the news is old and the trade is gone).
📝 The Substack Deep-Dive (US$6/mo): Unlock the Vault.
Zero Paywalls: Read the full “Deep Dive” articles and “Substack Exclusive” articles found only on Substack.
Visual Alpha: Download exclusive Infographic Cheatsheets not available to free readers.
💎 The Ultimate Value Pass (S$9/mo): (BEST VALUE)
Get It All: Paid via YouTube, this bundle grants you Instant Video Access AND Full Substack Access.
The Math: You save ~30% compared to buying them separately. It’s the “Smart Money” move.
Why wait 2 weeks for old news? Get the data while it’s fresh. 👉 Join Here: https://www.youtube.com/@InvestingIguana/membership
The State of the Market
The headlines are screaming “Record Highs,” but a data-driven approach requires looking at the technical indicators. On January 30, 2026, the Straits Times Index (STI) touched an all-time peak. As of that date, the SPDR STI ETF (ES3) was trading around S$5.00 and has roughly doubled over the last five years. For a retiree with S$500,000, this is a signal to evaluate portfolio concentration.
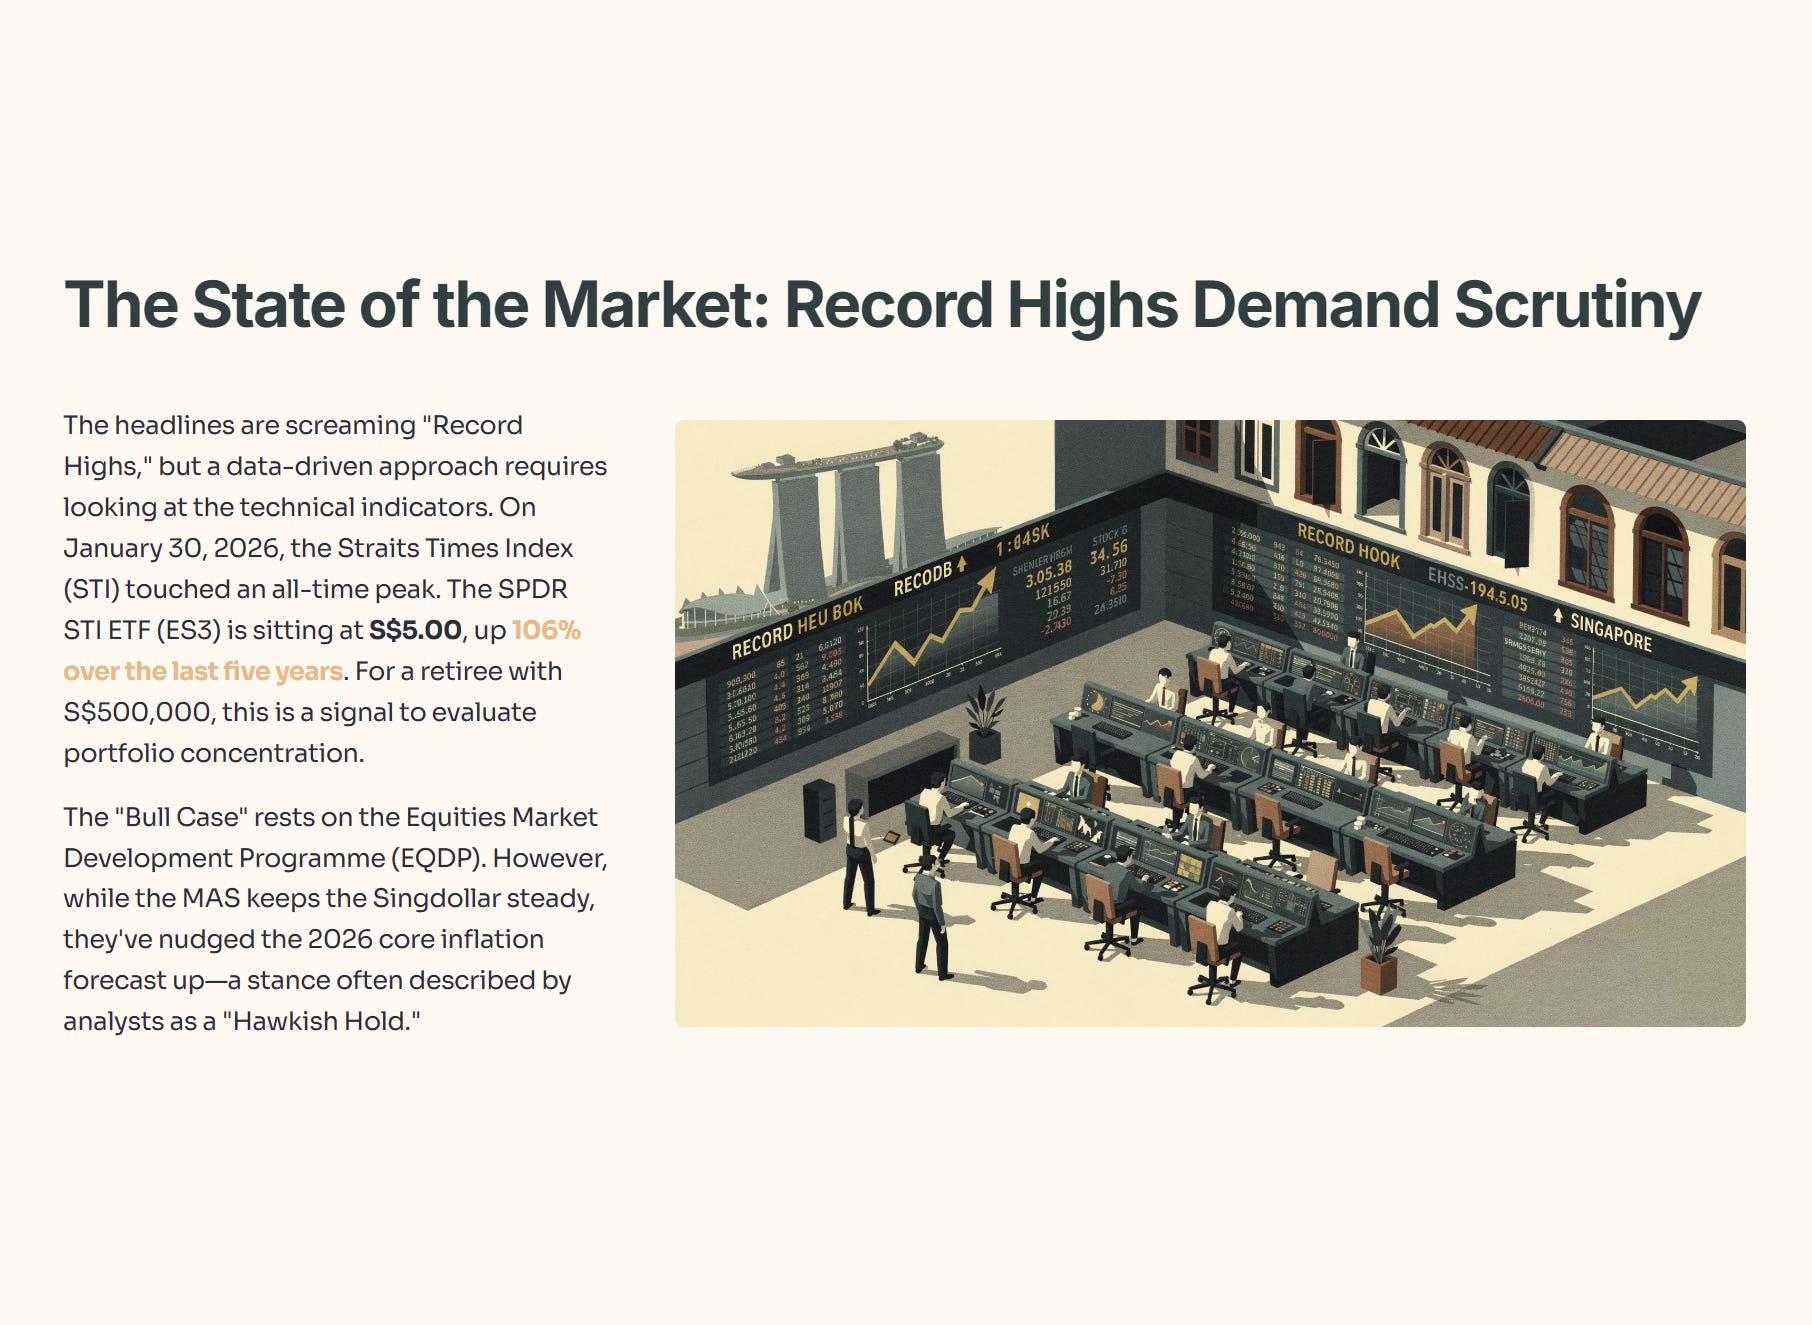
The “Bull Case” rests on the Equities Market Development Programme (EQDP). However, while the MAS keeps the Singdollar steady, they’ve nudged the 2026 core inflation forecast up—a stance some analysts have described as a ‘hawkish hold’ for Singapore’s monetary policy.”
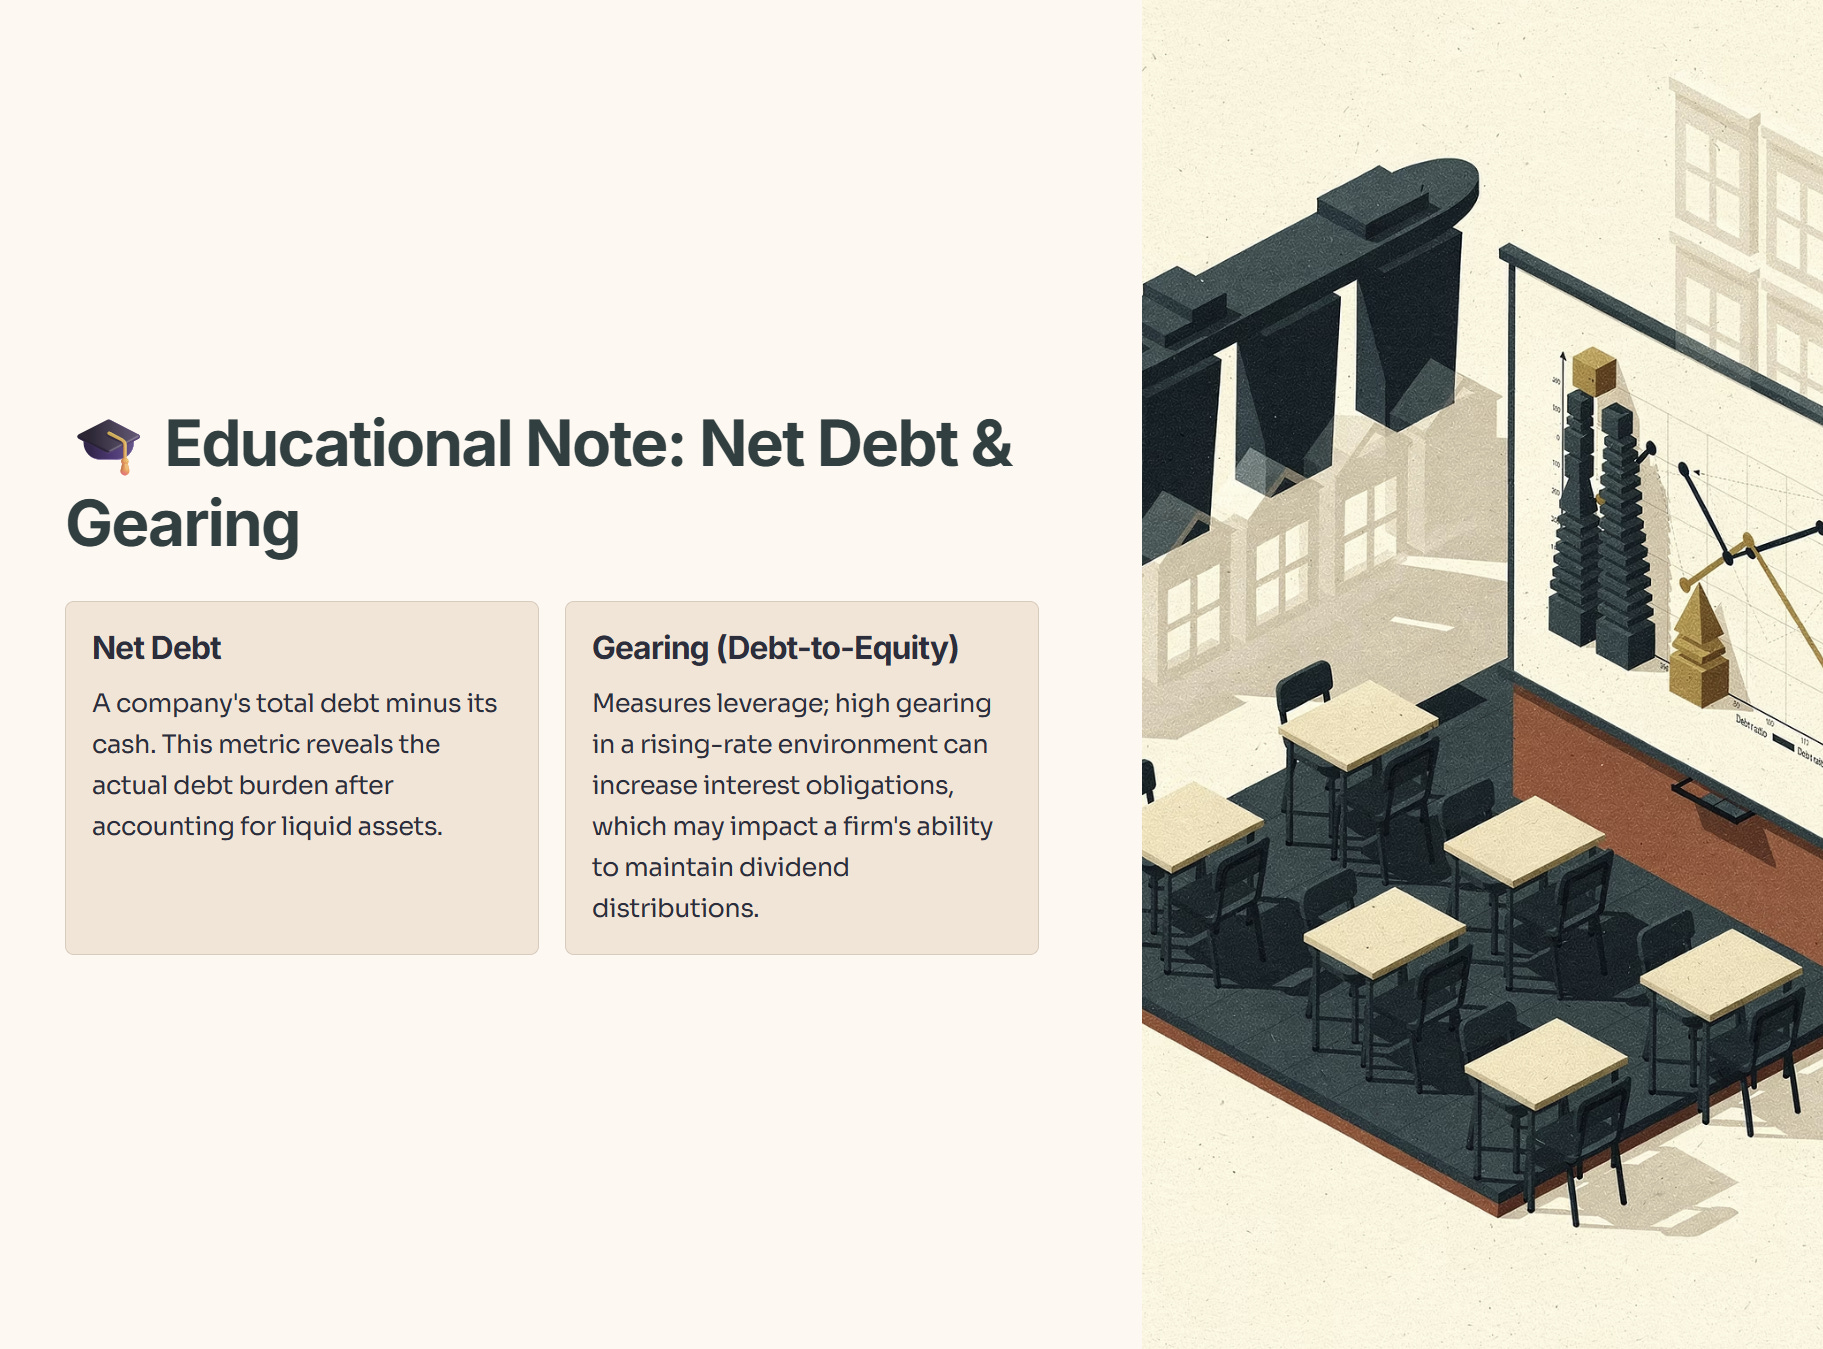
🎓 Educational Note: Net Debt & Gearing
Net Debt is a company’s total debt minus its cash. Gearing (Debt-to-Equity) measures leverage; high gearing in a rising-rate environment can increase interest obligations, which may impact a firm’s ability to maintain dividend distributions.
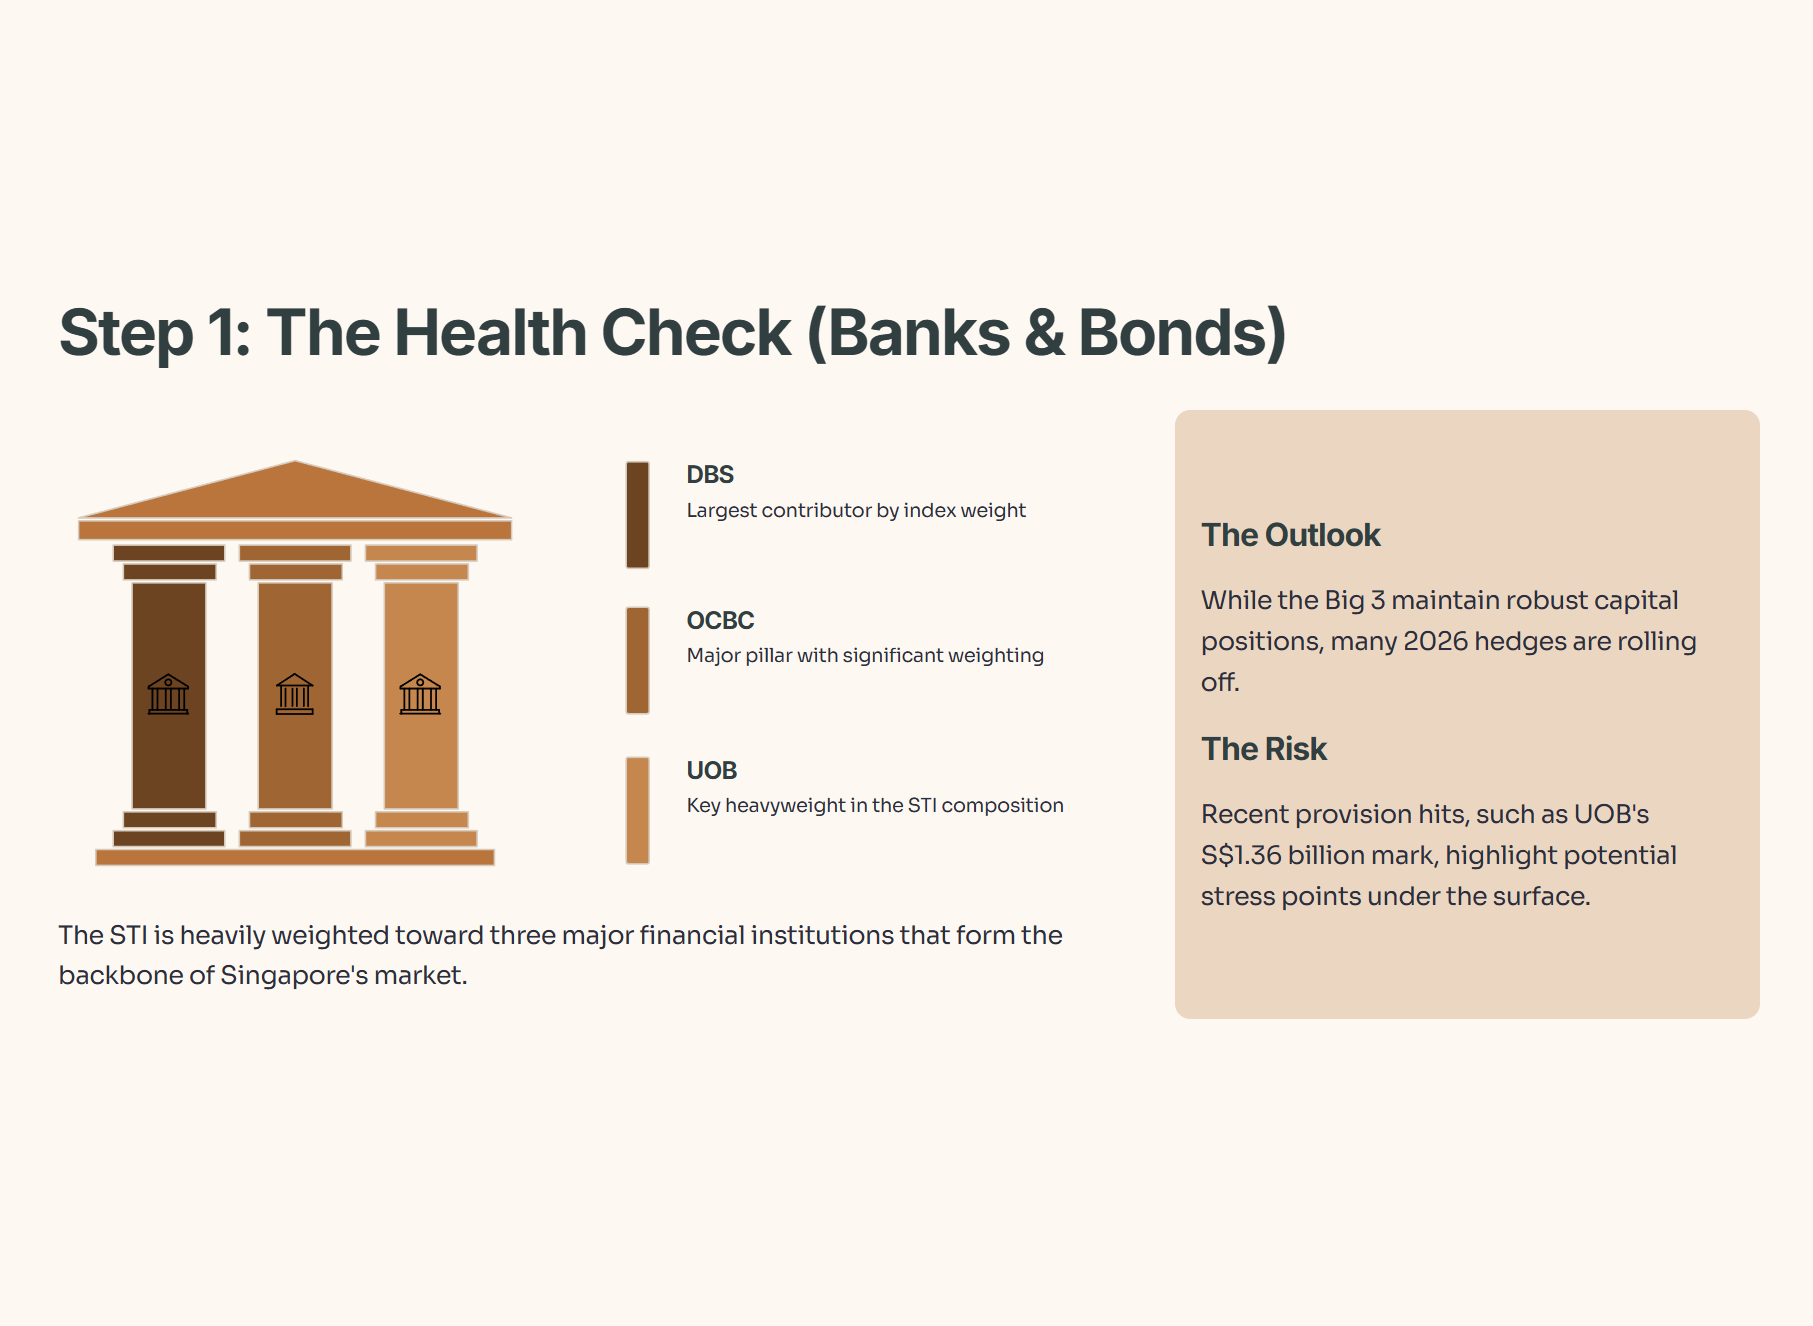
Step 1: The Health Check (Banks & Bonds)
The STI is heavily weighted toward three major financial institutions (DBS, OCBC, UOB).
The Outlook: While the Big 3 maintain robust capital positions, many 2026 hedges are rolling off.
The Risk: Recent provision hits, such as UOB’s roughly S$1.36 billion in allowances for credit and other losses reported in 2025, highlight potential stress points under the surface.
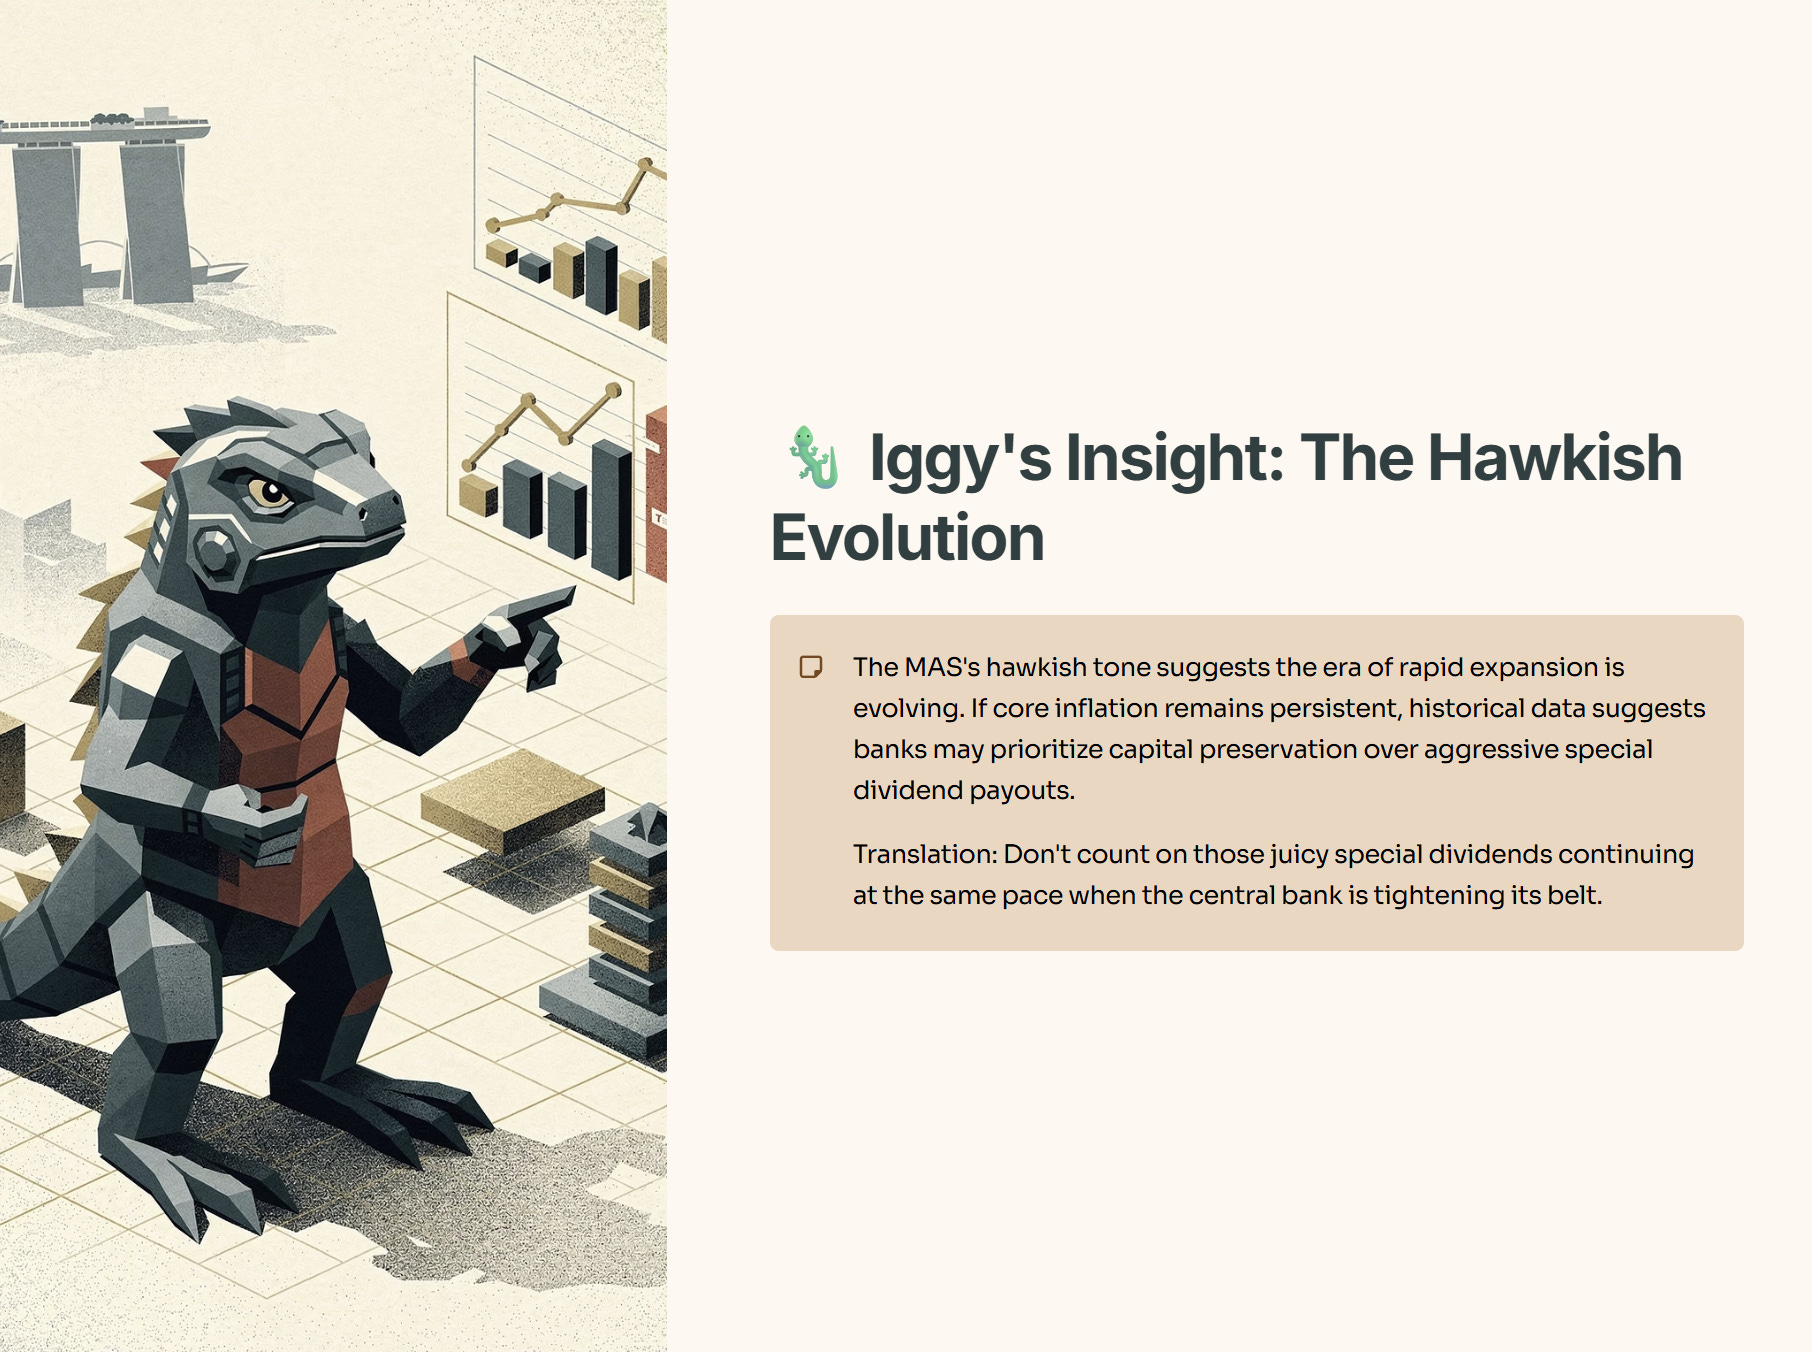
🦎 Iggy’s Insight:
The MAS’s hawkish tone suggests the era of rapid expansion is evolving. If core inflation remains persistent, historical data suggests banks may prioritize capital preservation over aggressive special dividend payouts.
Step 2: The Yield Reality (Cash Flow vs. Capital Gains)
As of early Feb 2026, the ES3 shows a dividend yield of around 3.6%. For a S$500k portfolio, that represents an annual income of S$18,000—a decrease from previous periods where lower entry prices resulted in higher effective yields.
Dividend Trajectory (3-Year Forecast)
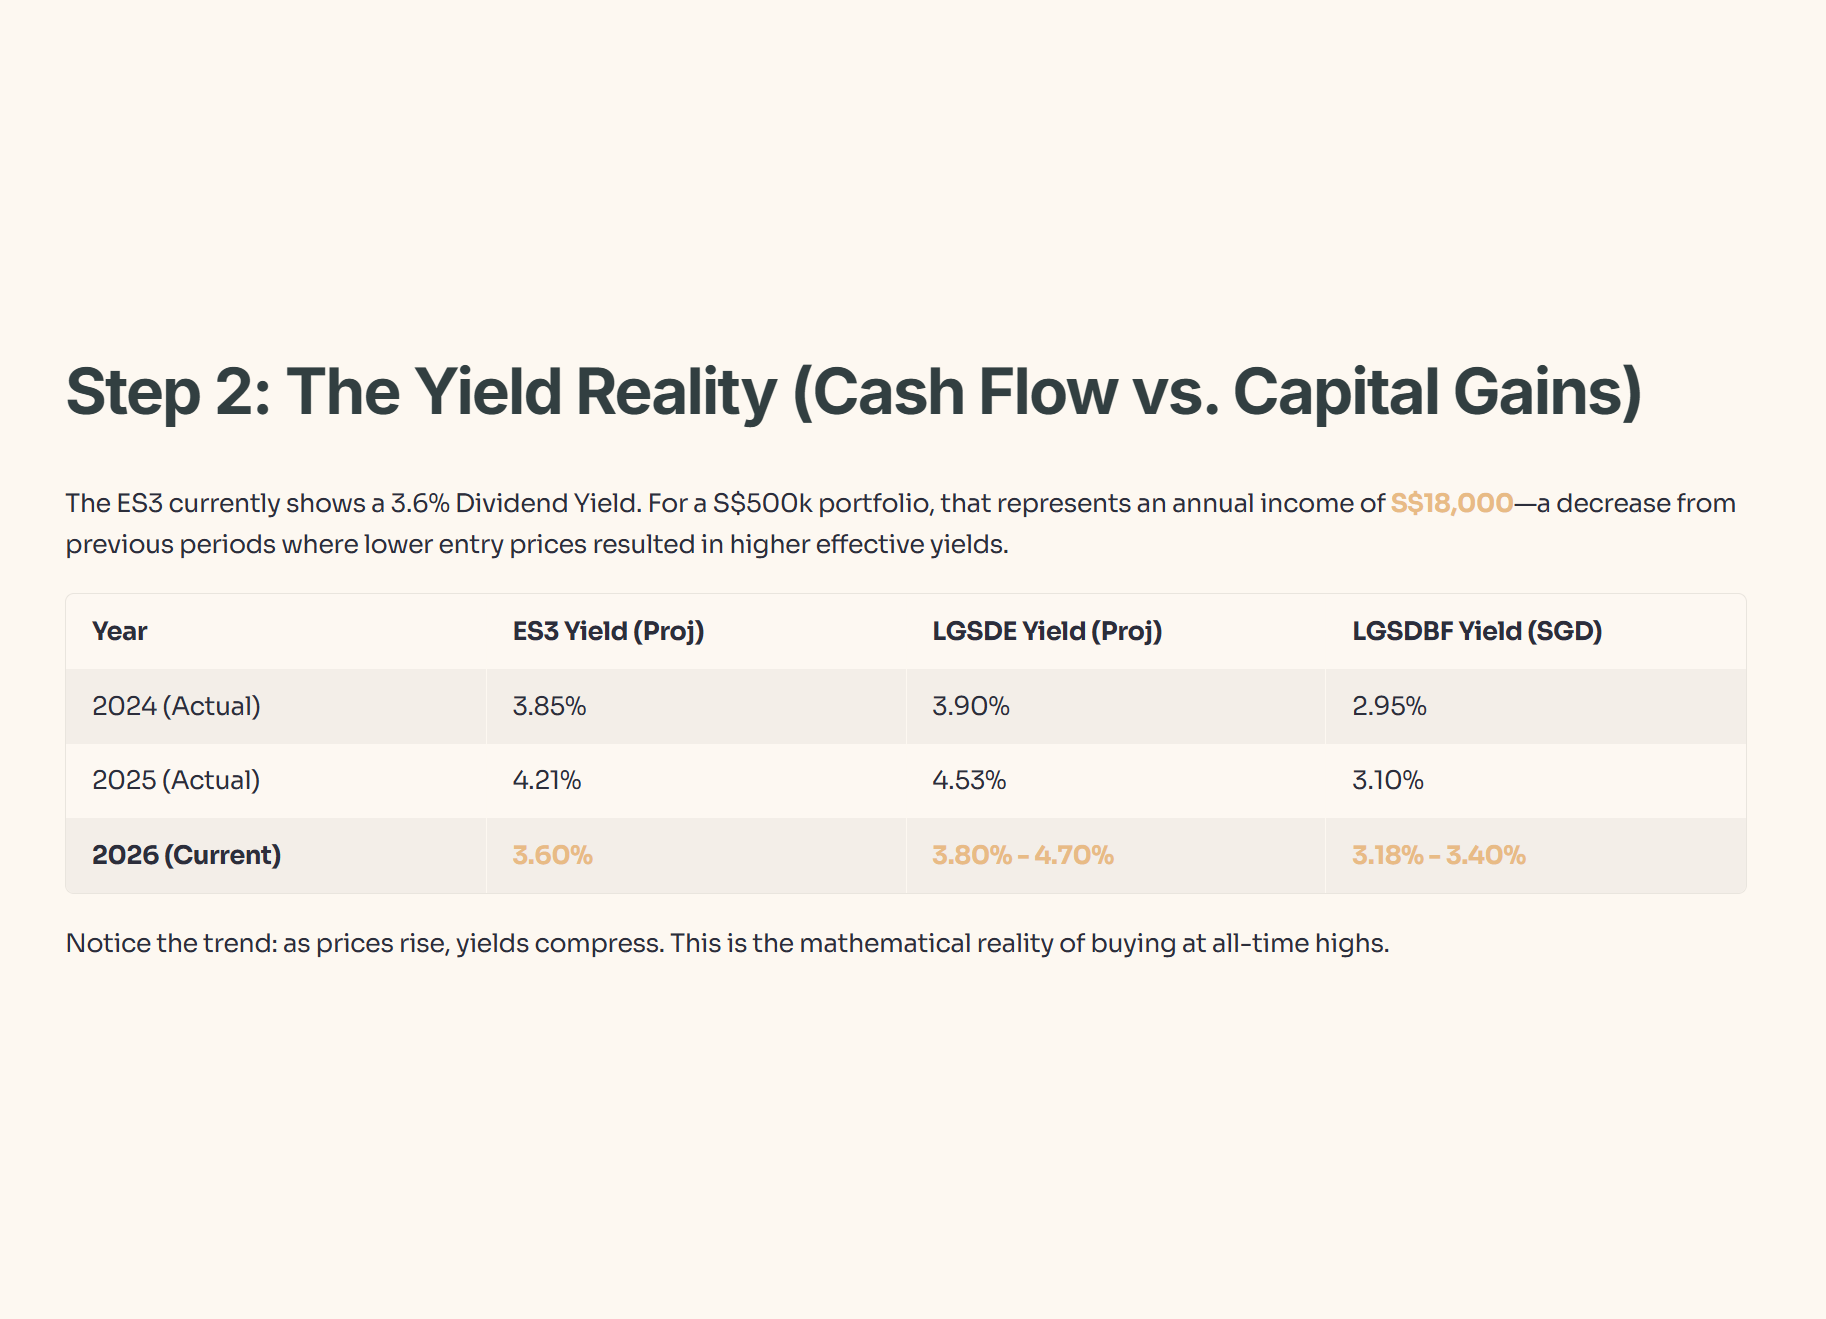
🦎 Iggy’s Insight (Step 2 – Yield Reality):
A 3.6% yield on S$500k gives you about S$18,000 a year, or S$1,500 a month before fees and tax—not bad, but not “quit your job” money. In earlier years, investors who bought ES3 closer to S$3+ locked in much higher effective yields on their cost, so today’s buyers at S$5.00 are paying more for the same dollar of dividends. Think of it like buying the same plate of chicken rice at a higher price: the meal didn’t get bigger, you just get less value for every dollar. This is why at stretched valuations, the real question isn’t “What’s the yield now?” but “Am I being paid enough for the risk of a possible 10–15% pullback?”
Step 3: The Price Check (Valuation & Fees)
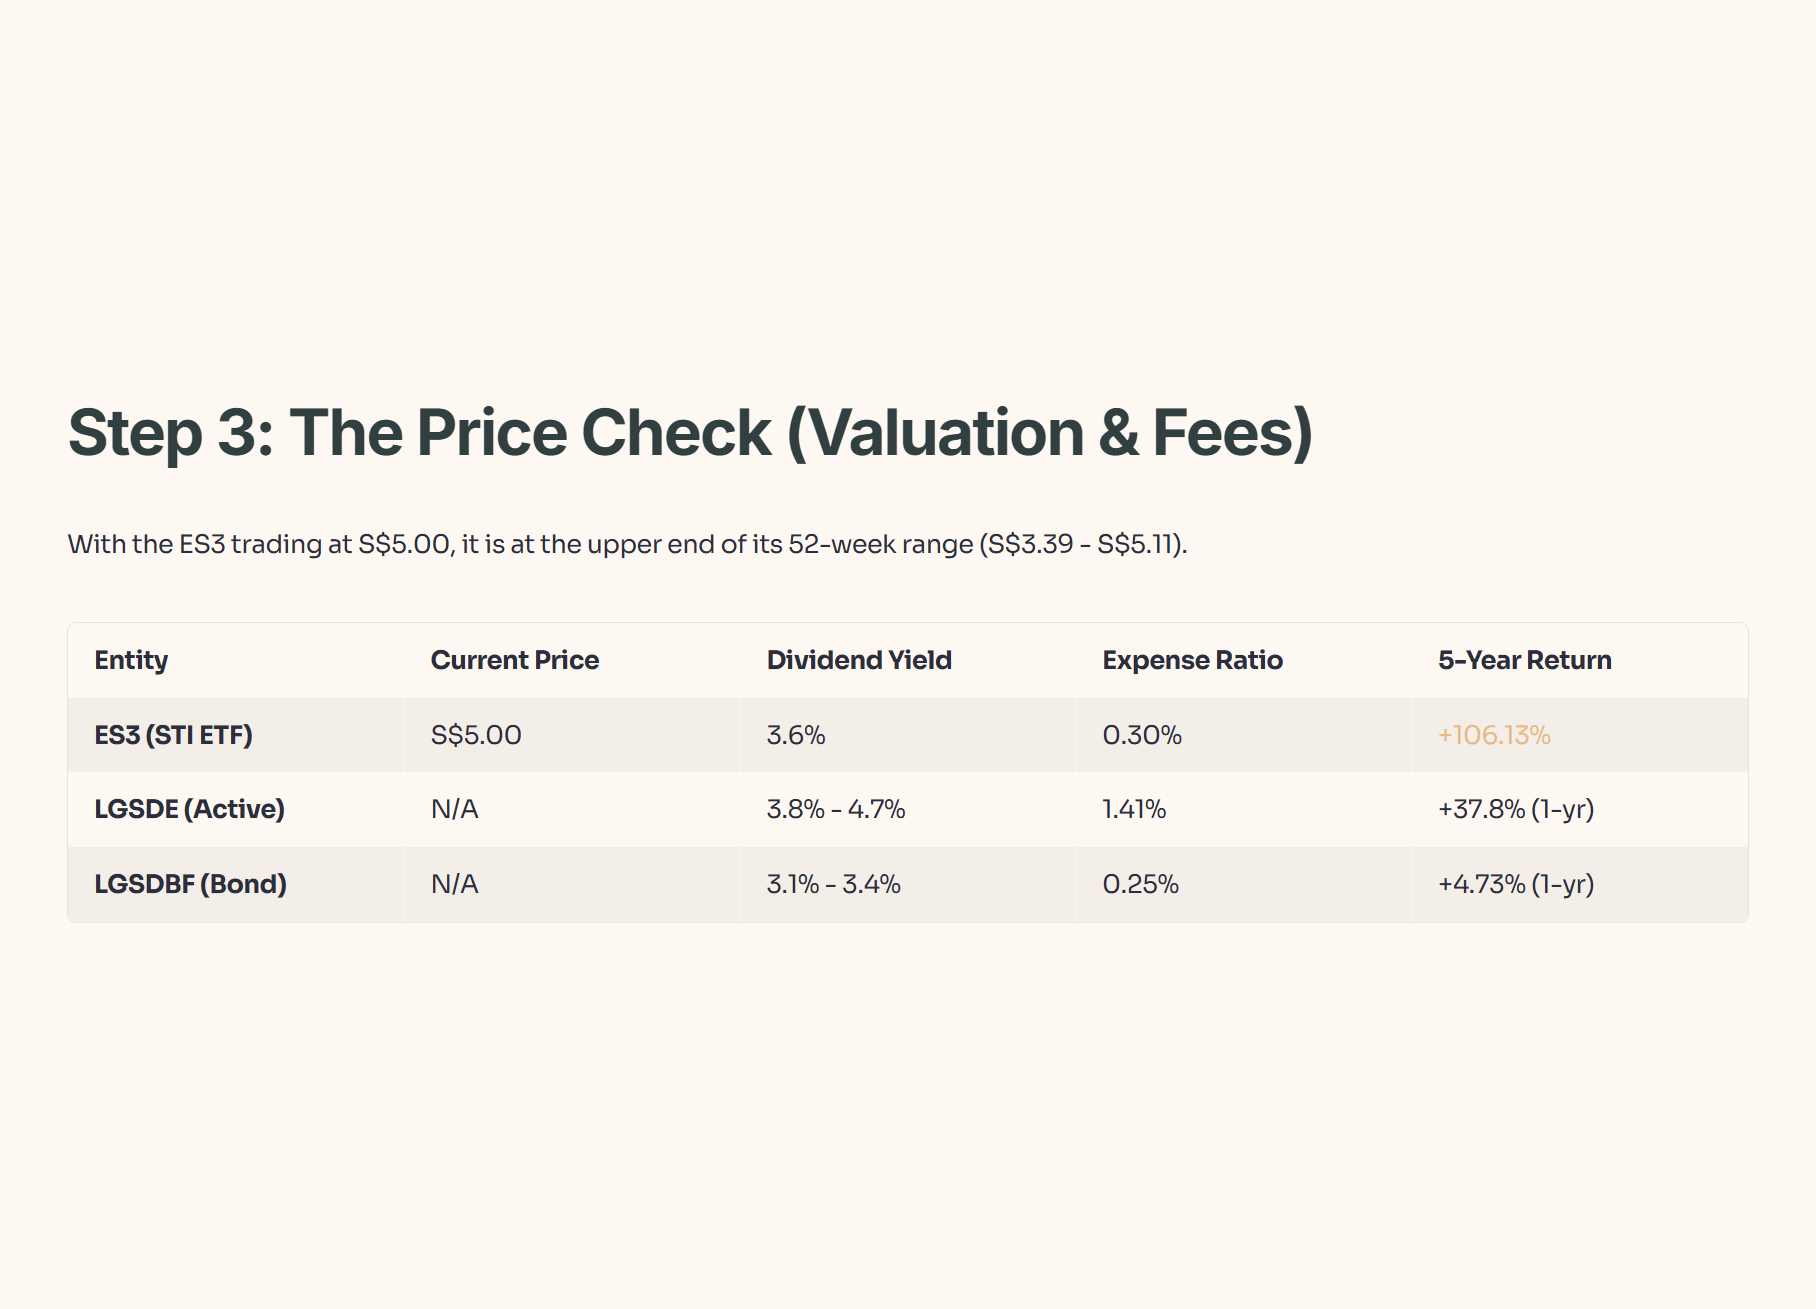
Now that you’ve seen the yield reality, the real question is how I would actually redeploy a S$500k nest egg at S$5.00 ES3 without sleep-killing drawdowns.
