

The Investing Iguana: DBS Group Holdings (D05.SI) FY2025 Forensic Audit
Peeling Back the Dividend Machine’s Shiny Paint

The Investing Iguana: DBS Group Holdings (D05.SI) FY2025 Forensic Audit
1. The Context
The Straits Times Index (STI) recently surged past the 5,000-point milestone, driven by a historic resistance breakout and optimistic Budget 2026 announcements. We are currently navigating the Year of the Fire Horse, a cycle characterized by double fire energy, high momentum, and high volatility. Amidst this market euphoria, the Monetary Authority of Singapore (MAS) injected S$1.5 billion into local equities, lifting the tide for major financial institutions. Yet, when DBS Group Holdings released its fourth-quarter and full-year 2025 financial results on February 9, 2026, the stock retreated 1.9% on the announcement day, eventually suffering a cumulative 3.3% decline over the week on volume that more than doubled its 30-day average.
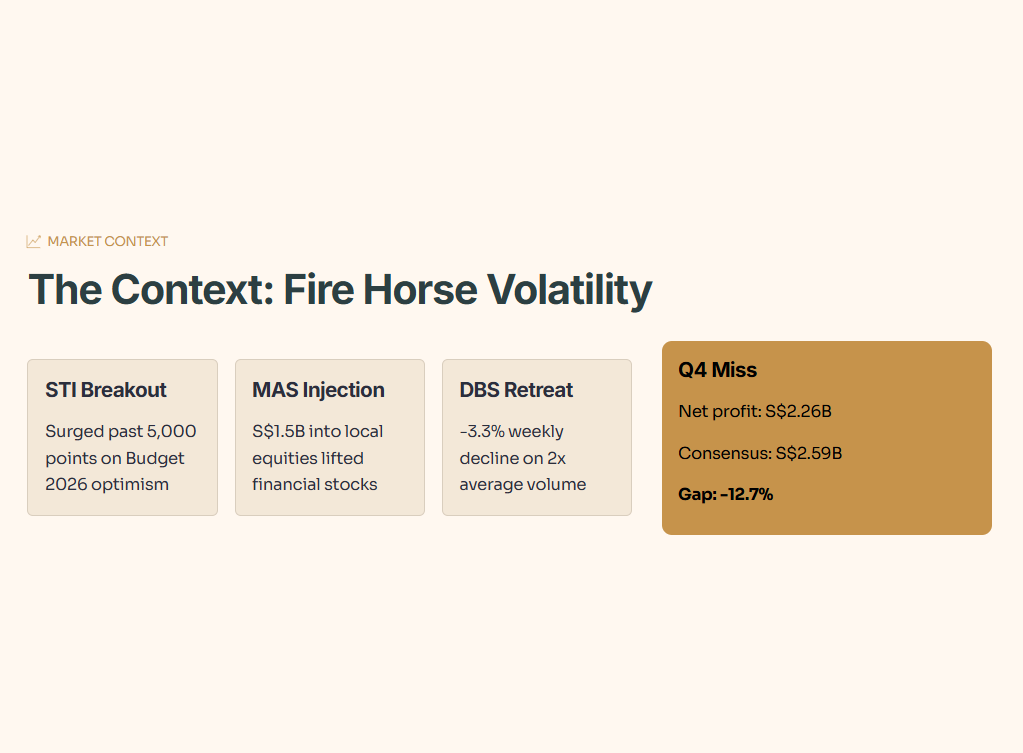
And let’s be honest, the consensus view is that DBS is an unstoppable dividend machine and a permanent safe haven in any economic weather. But here is the uncomfortable truth: statutory net profit has begun to plateau and contract. The fourth-quarter net profit fell 10% year-on-year to S$2.26 billion, missing the analyst consensus forecast of S$2.59 billion by a glaring 12.7%. The commercial book net interest income dropped 6% year-on-year.
In This Article:
Step 1: The Health Check (Balance Sheet & Solvency)
Step 2: The Wealth Check (Cash Flow & Yield)
Step 3: The Price Check (Valuation & Peers)
Step 4: The Future Check (Scenarios & Fair Value)
InvestingPro Reality Check
The Verdict
About Iggy & the Elite 170

In the Singapore market, the gap between a smart entry and becoming someone else’s exit liquidity can be as little as 48 hours. That’s the cost of informational lag.
Free subscribers get my analysis up to 14 days later. The Elite 170 get it the moment it’s ready.
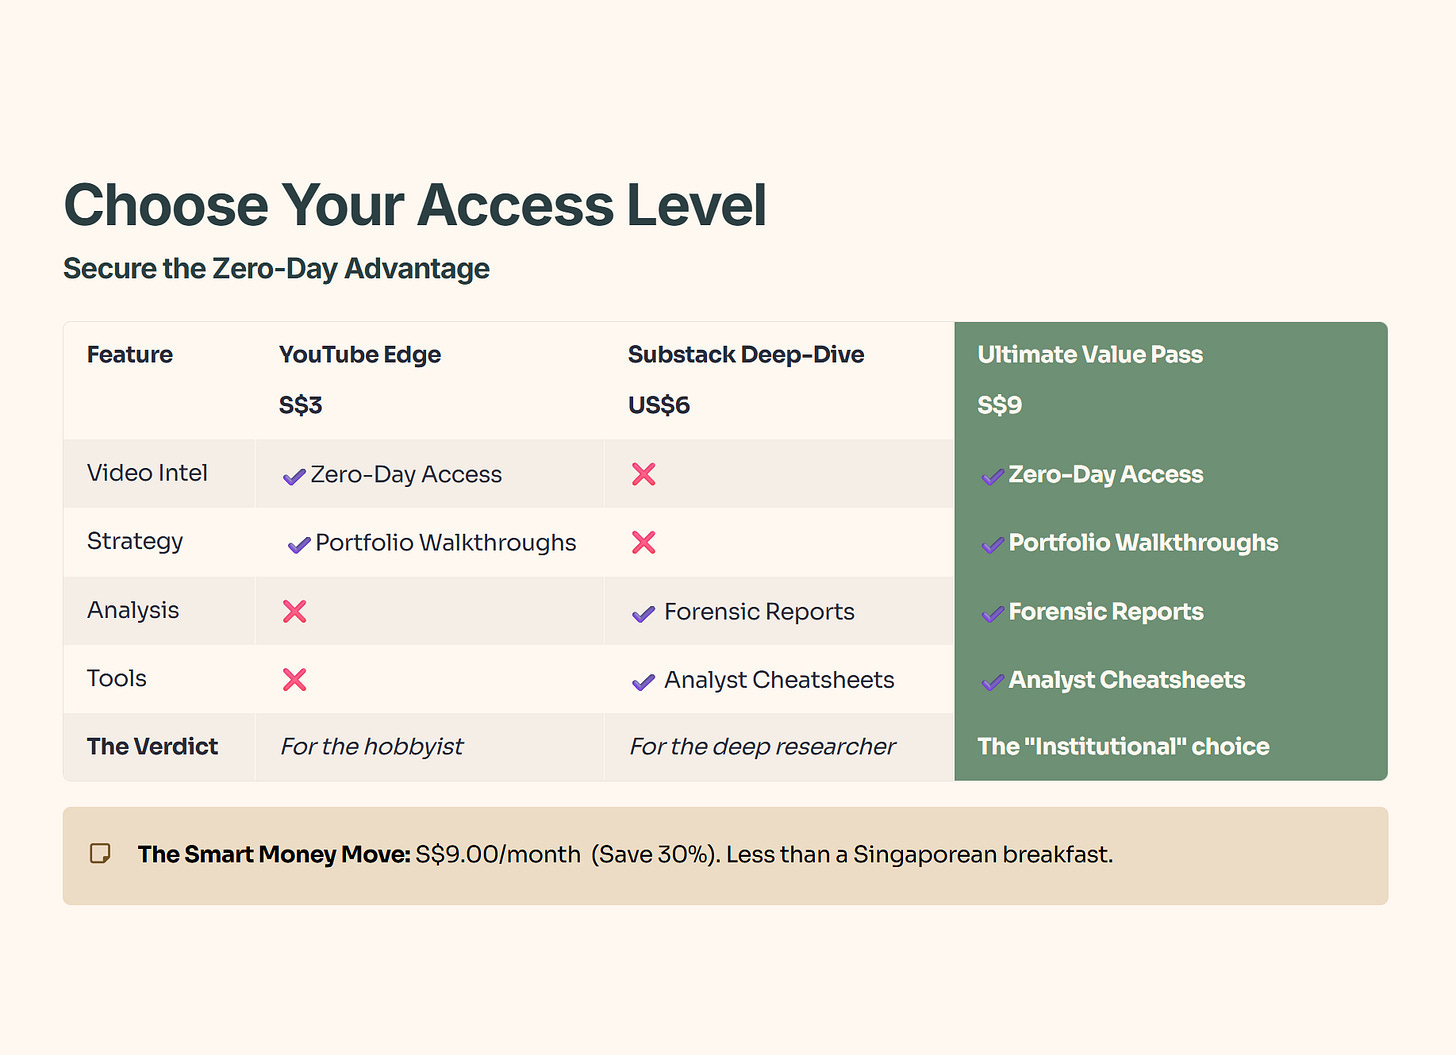
Your Edge:
The S$9 Ultimate Value Pass bundles zero-day video intel, forensic reports, and analyst cheatsheets into one institutional-grade feed — for less than a Singaporean breakfast.
Before we look at dividends, we must understand the fundamental engine driving these numbers.
🎓 Educational Note: Net Interest Margin (NIM)
Think of Net Interest Margin (NIM) like a Singapore chicken rice seller’s spread. The seller buys raw chicken at a certain cost (the interest the bank pays you for your deposits) and sells the cooked plate of chicken rice at a higher price (the interest the bank charges borrowers for loans). The profit margin left over after subtracting the cost of the raw chicken from the selling price of the cooked plate is the NIM.
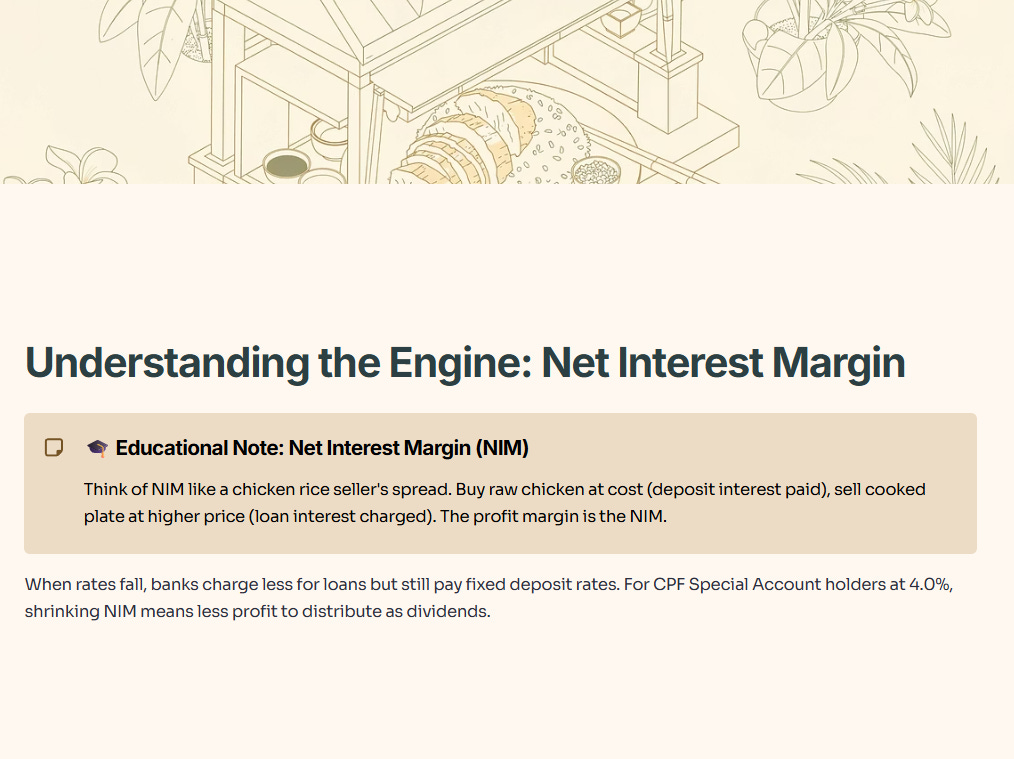
So what does this mean for you? When interest rates fall, the bank cannot charge as much for its loans, but it might still be stuck paying fixed rates on some deposits. For a Singaporean retiree managing their CPF Special Account—our Iron Bastion at 4.0%—a shrinking NIM means the bank has less raw profit to distribute to you as dividends.
To conduct a true wealth check, we must analyze the bank’s core lending profitability. In Q4 2025, DBS saw its NIM compress from 2.15% to 1.93%. This is a 22-basis-point drop. Historically, a 3-5 year average NIM for Singaporean banks hovers around 1.65% to 1.80%, meaning DBS is currently mean-reverting rather than plummeting.
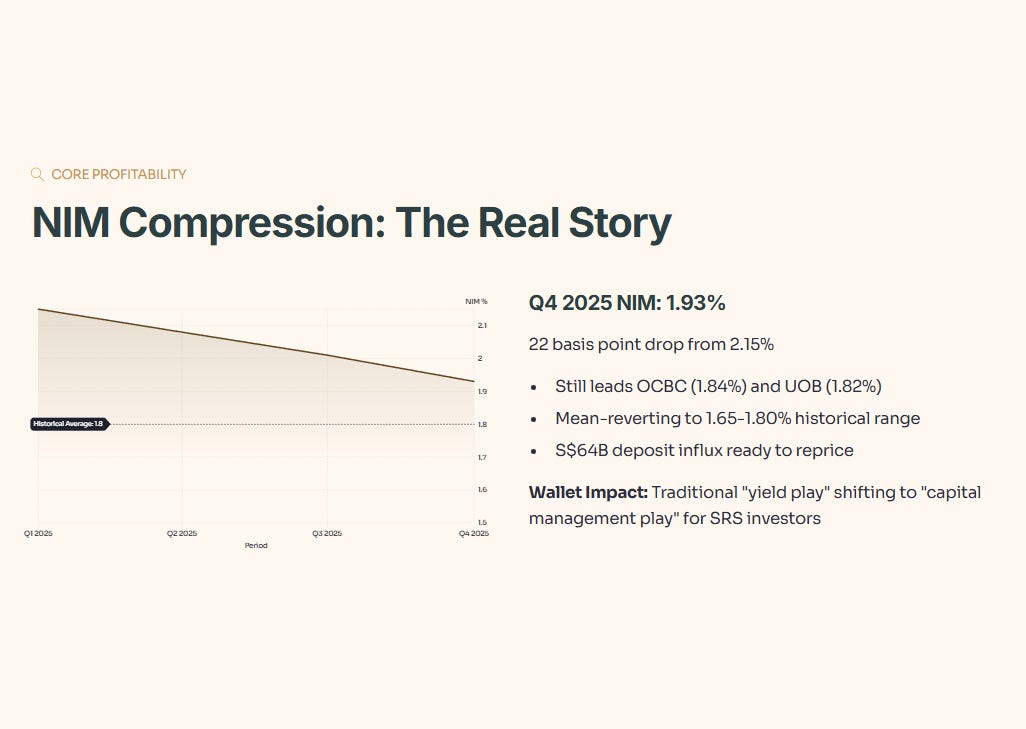
In peer context, this 1.93% still leads OCBC’s 1.84% and UOB’s 1.82%. In a forward scenario, if global interest rates improve by 10%, DBS’s massive S$64 billion deposit influx will immediately reprice, padding the NIM; if rates deteriorate by 10%, the bank’s S$10 million per basis point sensitivity on the SGD book will drag on earnings.
The wallet impact for a 50+ year-old Singaporean using Supplementary Retirement Scheme (SRS) funds is clear: the traditional “yield play” is transitioning into a “capital management play.”
2. Step 1: The Health Check (Balance Sheet & Solvency)
Our forensic methodology mandates a strict “Safety First” pillar. Can this entity survive a volatile, high-rate, or rapidly shifting macroeconomic environment? For banks, we lead our audit with the CET1 ratio and the NPL Coverage Ratio.
🎓 Educational Note: CET1 Ratio (Common Equity Tier 1)
Imagine a neighborhood auntie’s stall. She has everyday running costs, but she also keeps a thick stack of S$1,000 notes locked in a safe at home just in case her suppliers suddenly demand cash upfront. The CET1 ratio is that emergency stack of cash. It is the highest quality of regulatory capital a bank holds against its risk-weighted assets.
So what does this mean for you? A high CET1 ratio means the bank is an Iron Bastion. For your retirement portfolio, it guarantees the bank can absorb massive shocks—like a real estate crisis—without needing to cancel your dividends or ask shareholders for a bailout.
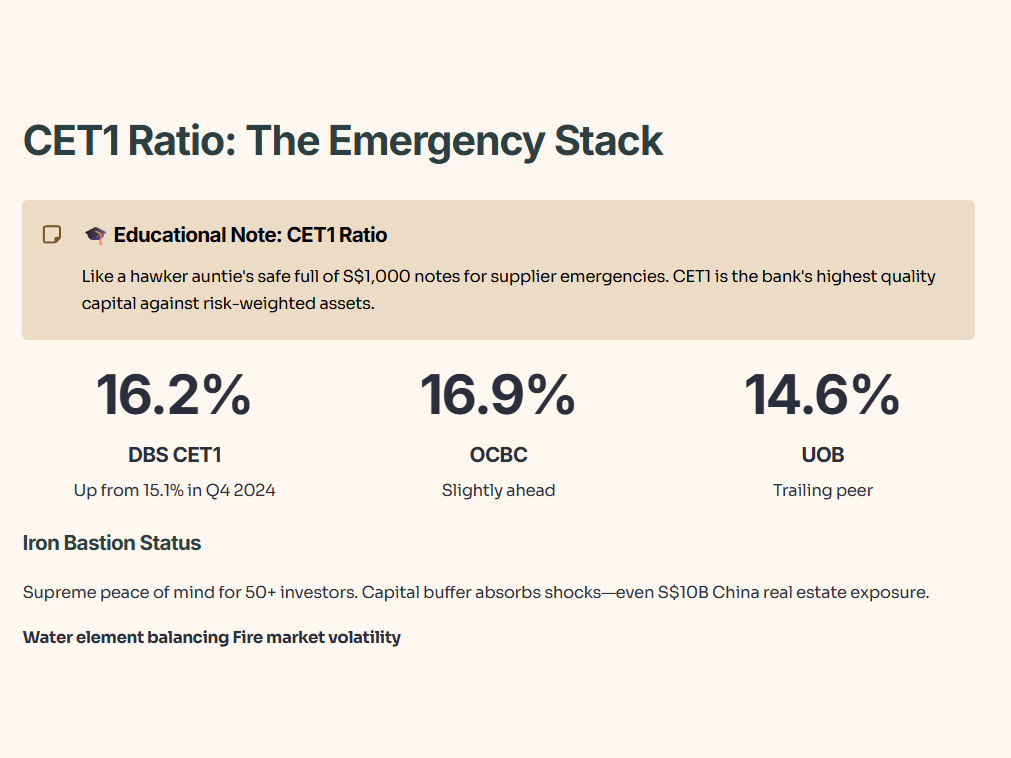
Let us evaluate the core solvency metrics. The raw fact is that DBS’s CET1 ratio normalized to 16.2% by the end of 2025. Historically, this is an expansion from the transitional 15.1% seen in Q4 2024. In peer context, DBS’s 16.2% trails slightly behind OCBC’s 16.9% but comfortably exceeds UOB’s 14.6%. In a forward scenario, if risk-weighted assets perform 10% better than expected, the CET1 could drift toward 17.0%, forcing further aggressive share buybacks; if asset quality deteriorates by 10%—specifically within their S$10 billion China real estate exposure—the CET1 will absorb the shock. The wallet impact for a Singaporean investor aged 50+ is supreme peace of mind; this capital buffer acts as the “Water” element balancing the “Fire” market volatility of 2026.
Table 1: Financial Health Checklist
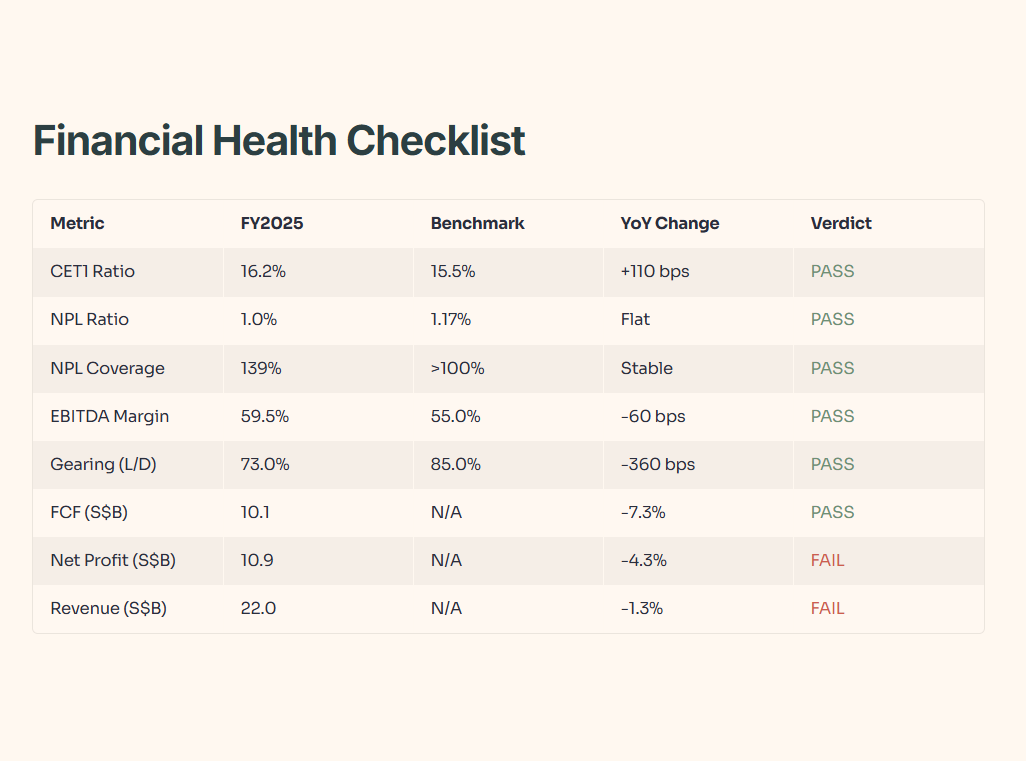
🦎 Iggy’s Insight: When we run our standard health check, DBS reveals itself as a Fortress. The balance sheet is flush with a massive S$64 billion influx of deposits. However, we must remain skeptical. The most dangerous item lurking in this fortress is the S$1 billion exposure to privately owned enterprises (POEs) in the China real estate sector.
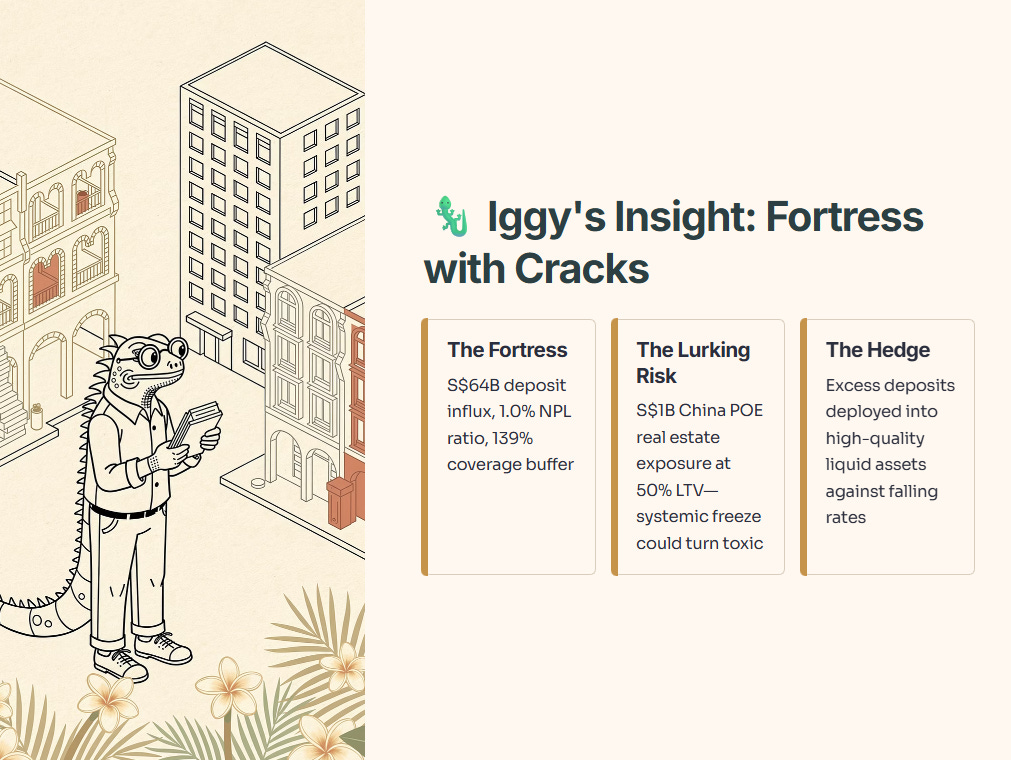
While the Loan-to-Value (LTV) sits at 50%, a systemic freeze could turn these assets toxic. Despite this, the NPL ratio holds steady at 1.0% with a 139% coverage buffer. The bank has successfully utilized its excess deposits to purchase high-quality liquid assets, hedging against falling rates.
3. Step 2: The Wealth Check (Cash Flow & Yield)
A high dividend is merely an illusion if it is not supported by underlying cash generation. We focus strictly on Free Cash Flow and Payout Ratios. If a company borrows to pay a dividend, it is a “Refund” of capital, not a yield.
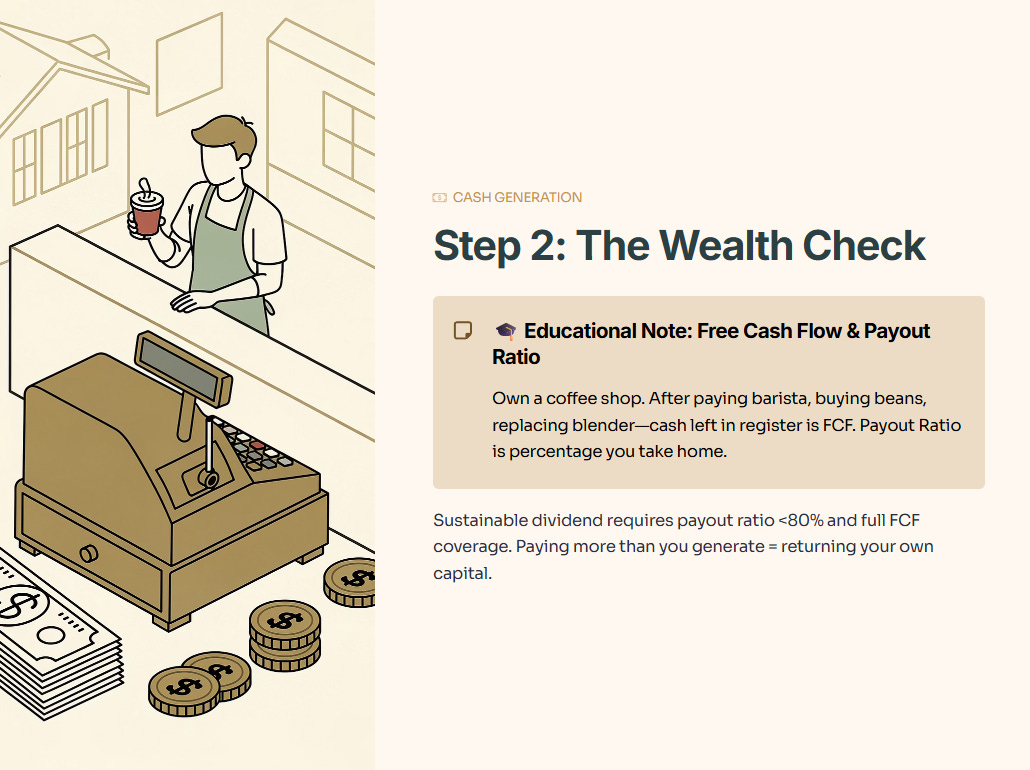
🎓 Educational Note: Free Cash Flow (FCF) and Payout Ratio
Imagine you own a coffee shop. At the end of the month, after paying your barista, buying coffee beans, and replacing a broken blender, the physical cash left in the register that you can safely take home is your Free Cash Flow. The Payout Ratio is the percentage of that leftover cash you actually put in your pocket.
So what does this mean for you? For a retiree relying on quarterly payouts, a company paying out more cash than it generates is simply giving you your own money back. A sustainable dividend must have a payout ratio below 80% and be fully covered by the cash left in the register.
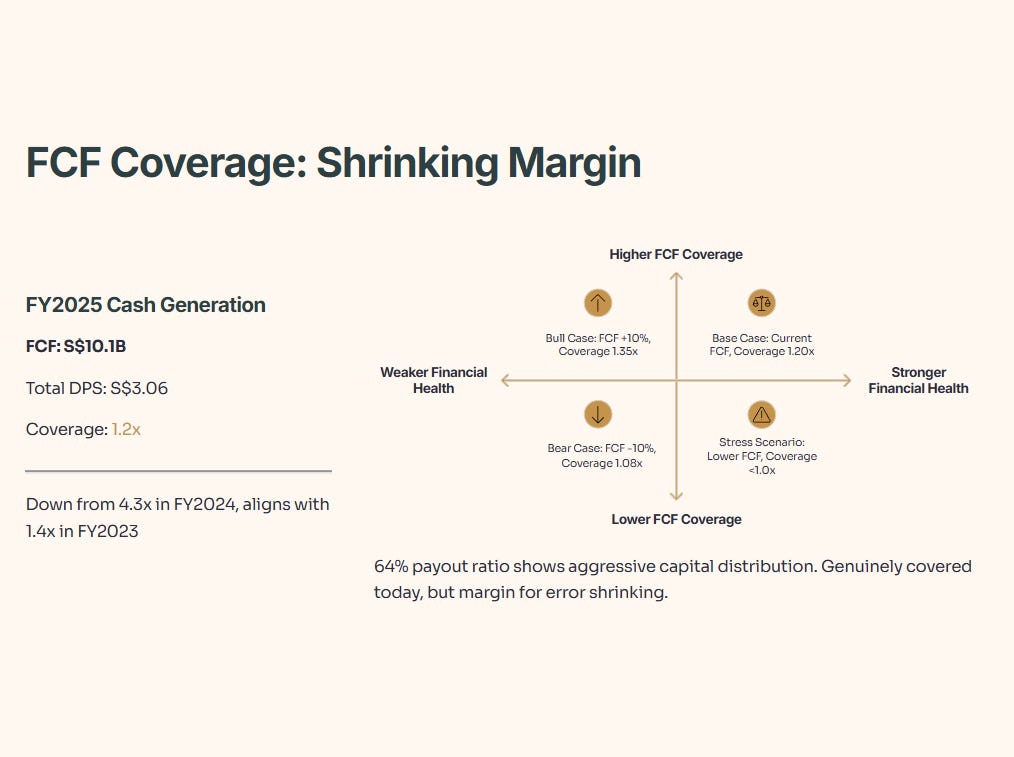
Applying our audit to DBS’s cash generation: The raw fact is that DBS produced S$10.1 billion in Free Cash Flow in FY2025, covering the S$3.06 total dividend per share with a 1.2x coverage multiple. Historically, this coverage is down sharply from 4.3x in FY2024, but aligns with the 1.4x seen in FY2023. In peer context, this 1.2x coverage is adequate.
In a forward scenario, if cash generation improves by 10% due to surging wealth management fees, coverage expands to a robust 1.35x; if FCF deteriorates by 10% due to lower loan volumes, the coverage drops to 1.08x. The wallet impact: the current 64% payout ratio indicates the board is aggressively distributing surplus capital. While it is genuinely covered by cash today, the margin for error is shrinking.
Table 2: Dividend and Payout Trajectory
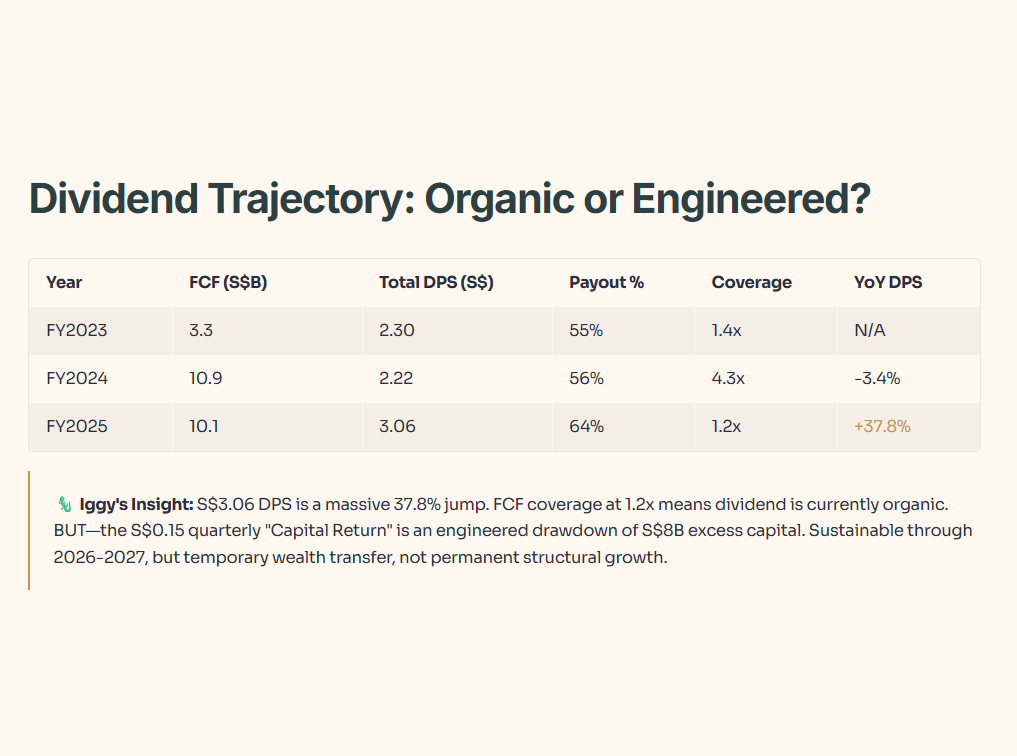
🦎 Iggy’s Insight: The S$3.06 total DPS in FY2025 is a massive 37.8% jump from FY2024. But remember our core rule: we must determine if this is organic or engineered. Because the FCF coverage remains at 1.2x, this dividend is currently organic. However, the S$0.15 quarterly “Capital Return” embedded in that payout is explicitly designed to drain the S$8 billion in excess capital. It is an engineered drawdown of the fortress reserves. It appears sustainable through 2026 and 2027 based on current capital ratios, but investors must recognize this as a temporary wealth transfer mechanism, not permanent structural growth.
4. Step 3: The Price Check (Valuation & Peers)
Valuation is where retail investors make their most expensive mistakes. We must use P/E and P/B against regional peers to locate the Forensic Gap. Is DBS a premium asset, or a value Trap?
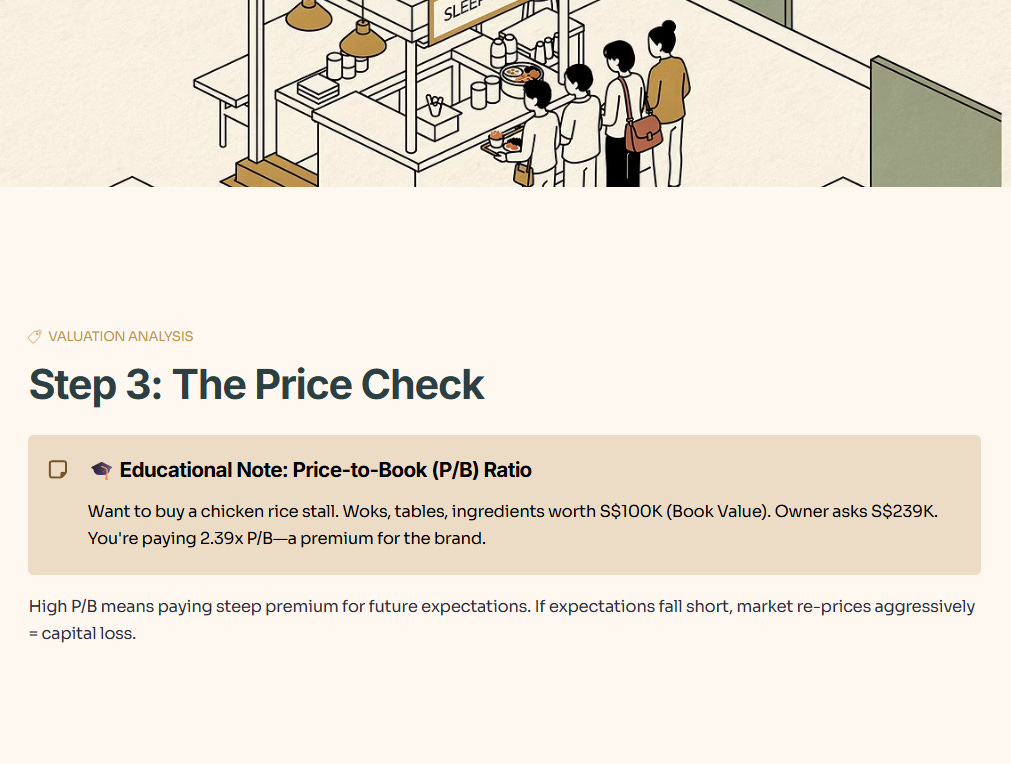
🎓 Educational Note: Price-to-Book (P/B) Ratio
Imagine wanting to buy over a famous chicken rice stall. The total value of the stall’s woks, tables, raw ingredients, and physical shop amounts to S$100,000. This is the “Book Value.” If the owner asks you to pay S$239,000, you are paying a Price-to-Book ratio of 2.39x. You are paying a massive premium because you believe the brand will justify the extra cost.
So what does this mean for you? For a cautious investor managing CPF funds, buying a stock at a very high P/B means you are paying a steep premium for future expectations. If those expectations fall short, the market will aggressively re-price the stall downwards, resulting in capital loss.
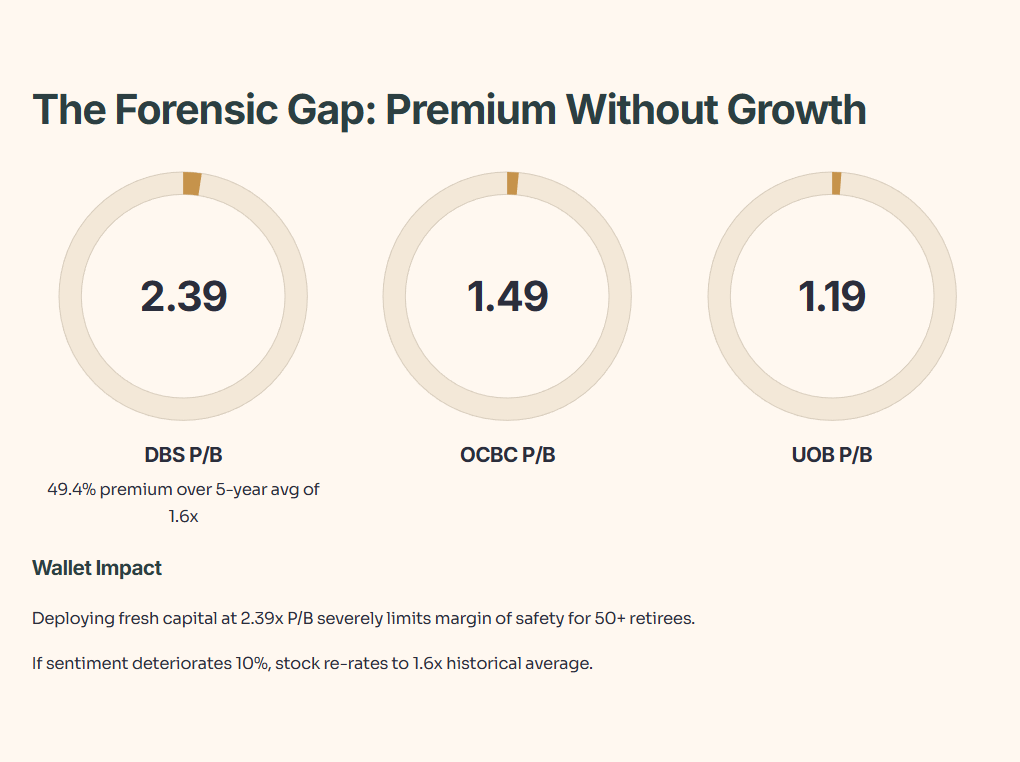
Let’s dissect the valuation. The raw fact is that DBS currently trades at a P/B ratio of 2.39x. Historically, this represents a 49.4% premium over its five-year average P/B of 1.6x. In peer context, this valuation dwarfs its local competitors; OCBC trades at 1.49x P/B, and UOB sits at 1.19x P/B. In a forward scenario, if market sentiment improves 10%, this premium could hold; however, if conditions deteriorate 10%, the stock will likely re-rate back toward its 1.6x historical average.
The wallet impact for the Singaporean retiree is stark: deploying fresh capital at a 2.39x P/B limits your margin of safety.
“Next, we’ll quantify the ‘Forensic Gap’ versus OCBC and UOB—and pin down what price would actually restore your margin of safety.”
