

The InvestingPro AI vs. Iggy Audit: Stress-Testing the 6 New Mid-Cap Movers
InvestingPro's algorithm just flagged these SGX stocks for massive returns. We ran them through our 5-Layer Solvency Test to separate the fortress assets from the yield traps.

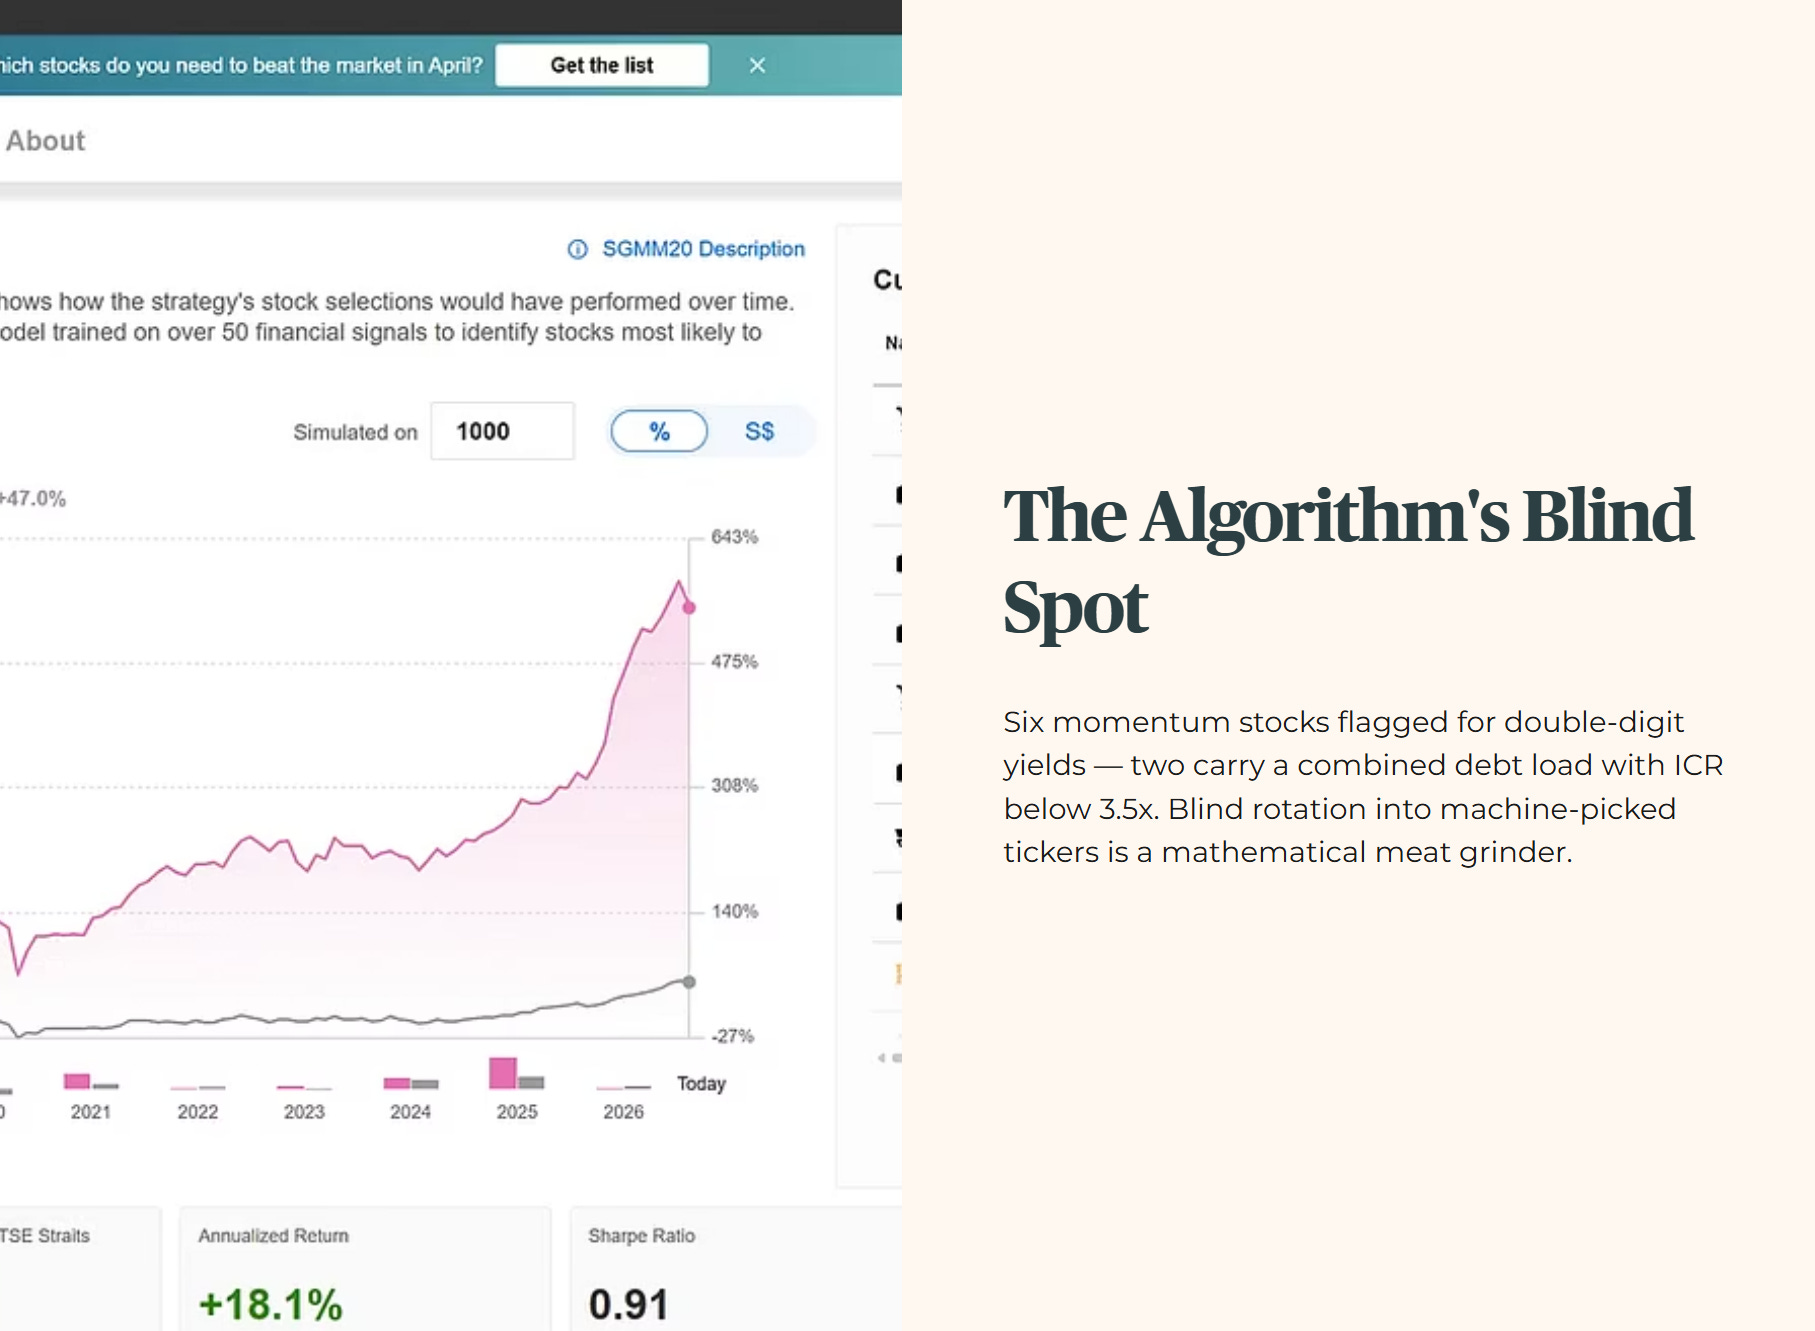
The AI algorithm just flagged six local momentum stocks promising double-digit yields, completely ignoring that two of them carry a combined debt load with an Interest Coverage Ratio below 3.5x. If you blindly rotate your retirement funds into these machine-picked tickers, you are walking directly into a mathematical meat grinder.
Today, we run these algorithmic darlings through the Five-Layer Solvency Test to expose exactly which balance sheets will destroy your capital.

In This Article:
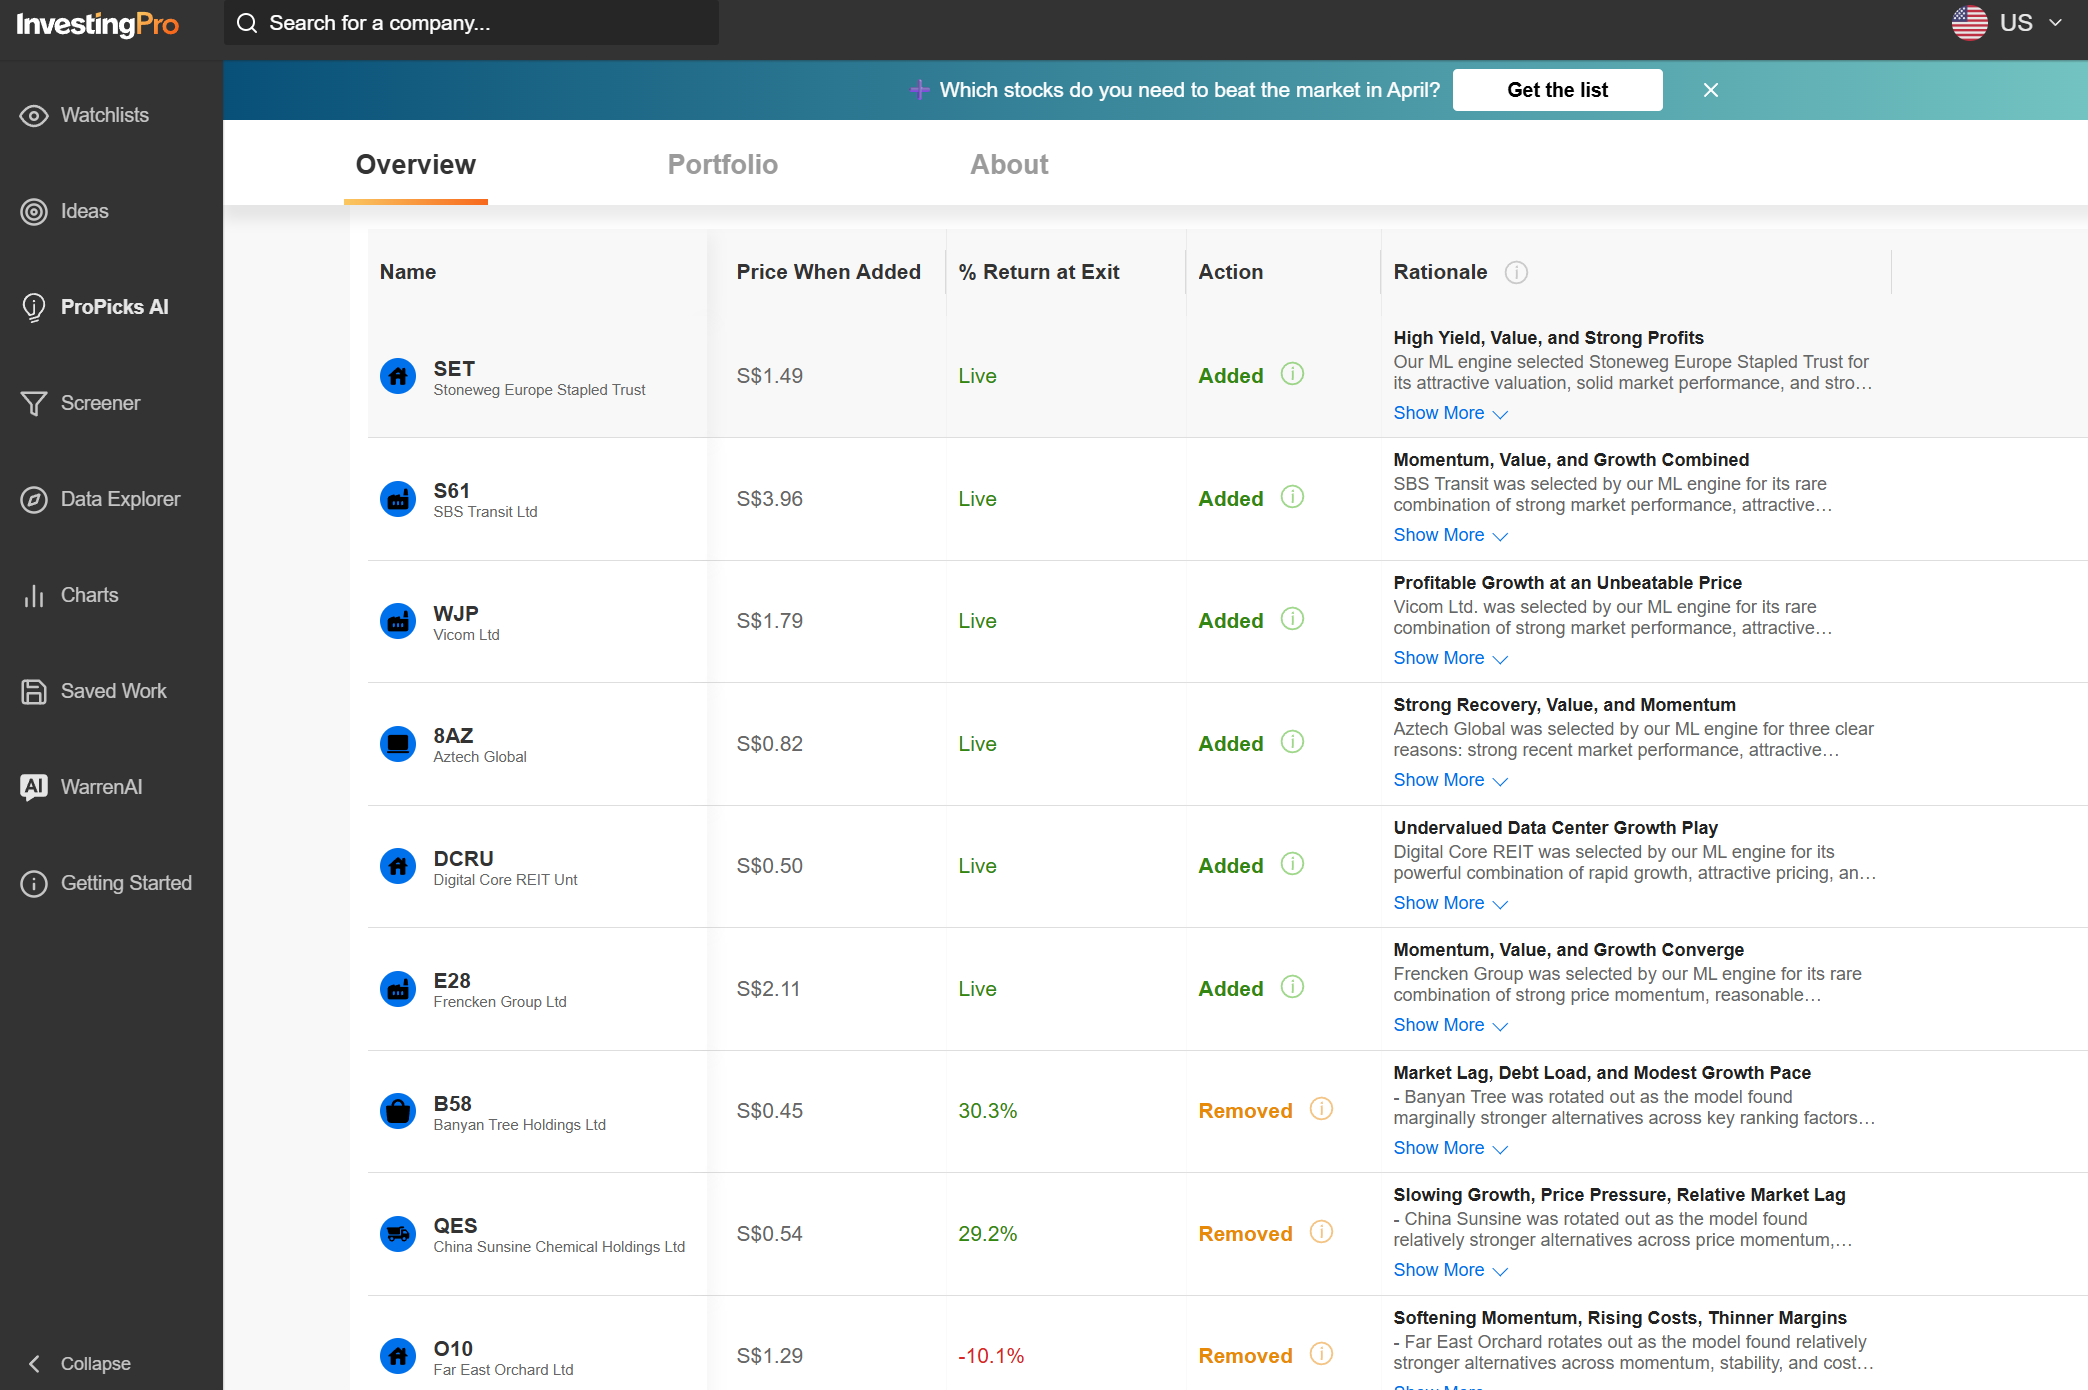
Step 1 The Health Check Solvency
Step 2 The Wealth Check Yield and Cash Flow
Step 3 The Price Check Valuation
Step 4 The AI vs Iggy Ticker Breakdown
The Bottom Line
Iggy’s Forensic Compliance Standards Standard Disclaimer
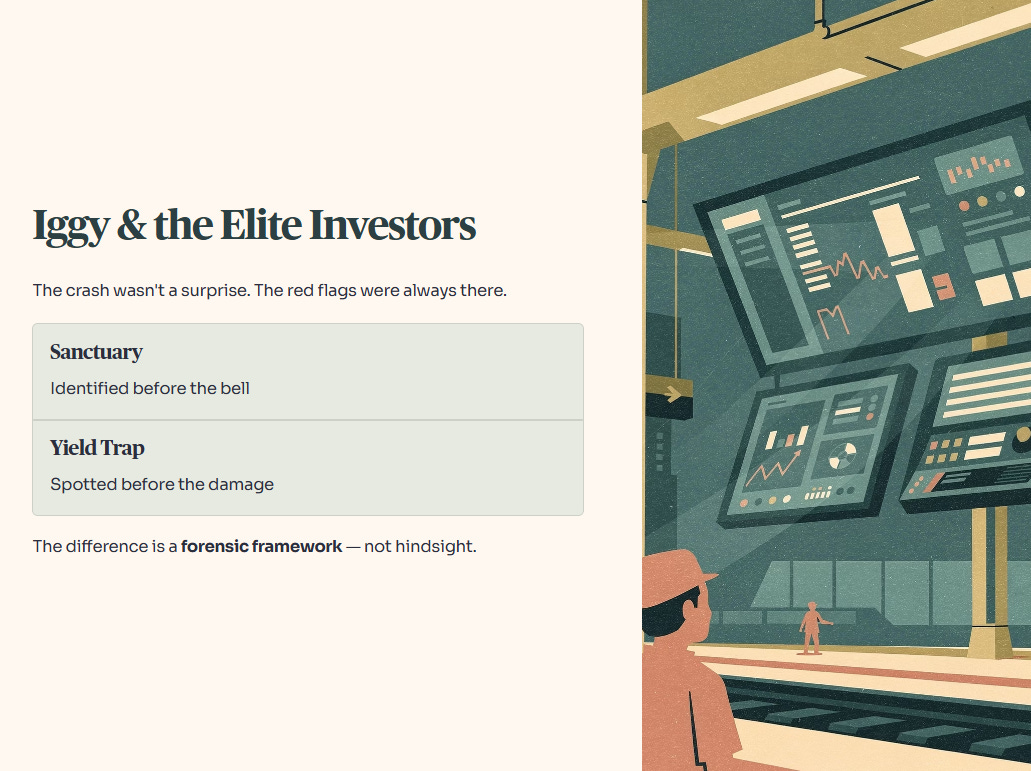
About Iggy & the Elite Investors
The Crash Wasn’t a Surprise. In this market, the difference between a “Sanctuary” and a “Yield Trap” is decided before the opening bell — not after the damage is done. The red flags are always there. The question is whether you had the forensic framework to read them in time.
Iggy’s Elite Investors didn’t chase the headline yield. They had the full forensic breakdown — the gearing ratios, the occupancy gaps, the debt overhang — before the market opened and before the price moved. Zero-day reports, the complete “Red Zone” watchlist, and institutional-grade cheatsheets that flag the landmines disguised as opportunities.
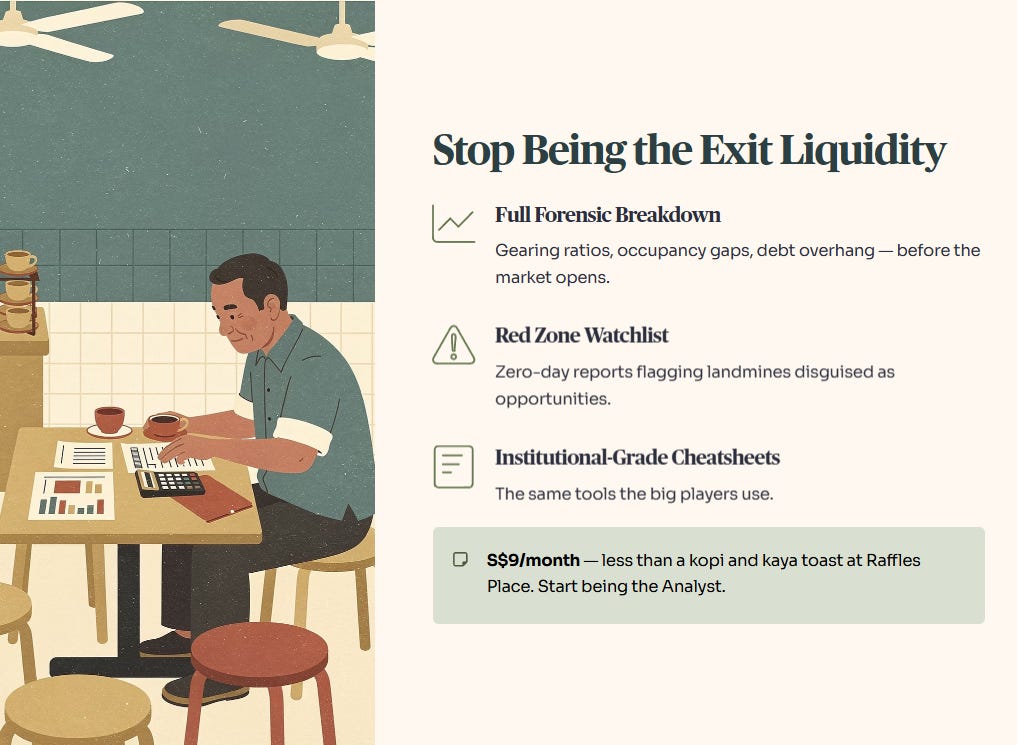
For S$9/month — less than a kopi and kaya toast set at Raffles Place — you stop being the Exit Liquidity and start being the Analyst.
Step 1: The Health Check (Solvency)
We are operating in an environment where the cost of debt is the only metric that truly matters. The market is facing what we call The Debt Wall. This is a specific date range where companies are forced to refinance their older, cheaper debt at today’s much higher, punishing interest rates.
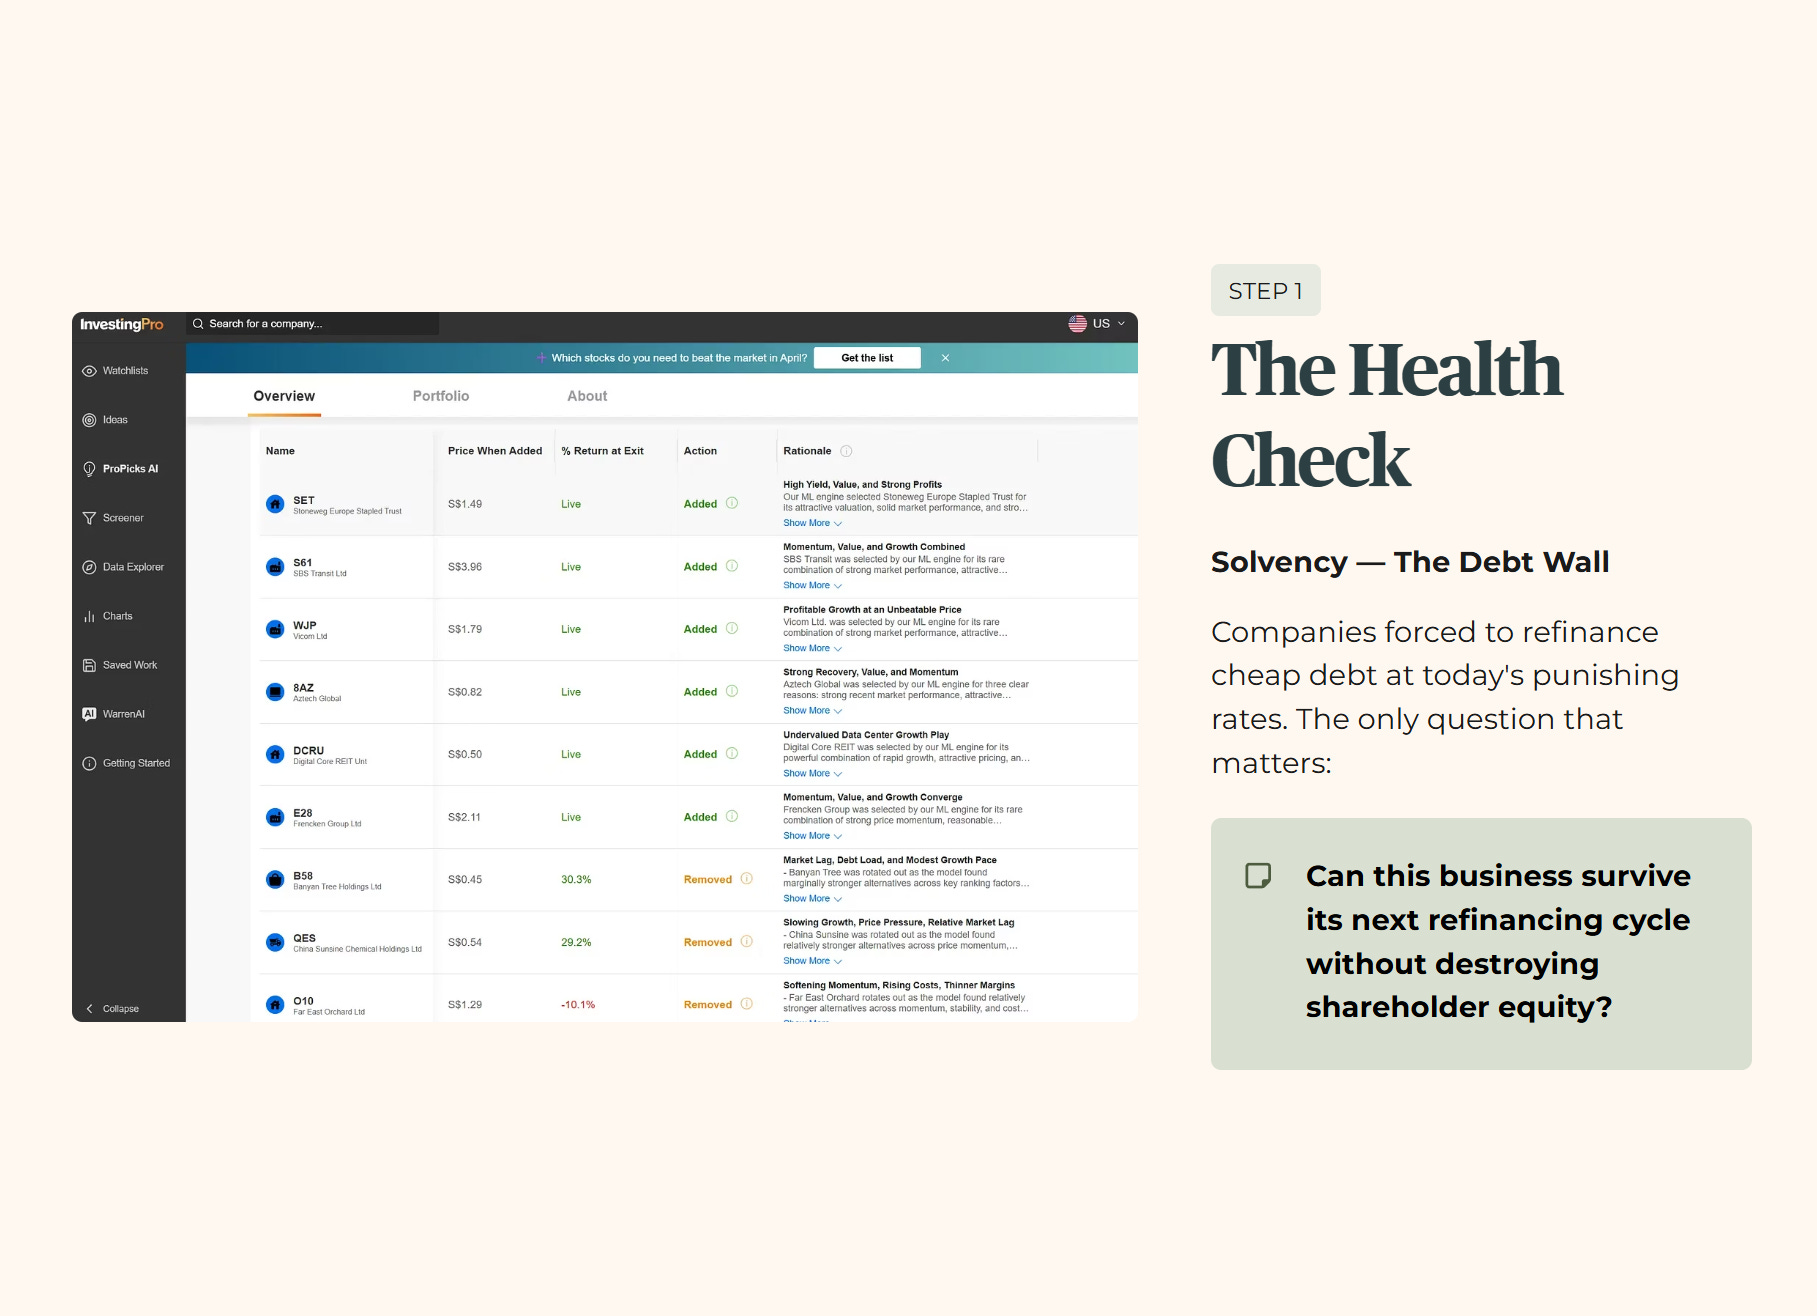
An algorithm looks at a stock chart and sees price momentum. I look at the exact same company and ask a fundamentally different question. Can this business survive its next refinancing cycle without destroying shareholder equity?
“Don’t overpay for the hype. See the math behind the momentum.” .....
Use the Fair Value models I use in every video. Code INVESTINGIGUANA gets you 50% off the world’s most powerful stock screener.
🦎 [Spot Undervalued Gems Here]
To answer that, we rely on the fortress balance sheet standard. We demand a gearing ratio strictly below 35%. Gearing measures how much of the company’s total assets are funded by debt. Think of it like a mortgage on a house; if your mortgage is too high, any drop in your income means you lose the property. We also demand an Interest Coverage Ratio (ICR) greater than 4.0x. The ICR tells us how many times a company’s operating profit can pay its current interest bills. Anything below 4.0x leaves zero margin for error.
This is where the dividend math breaks.
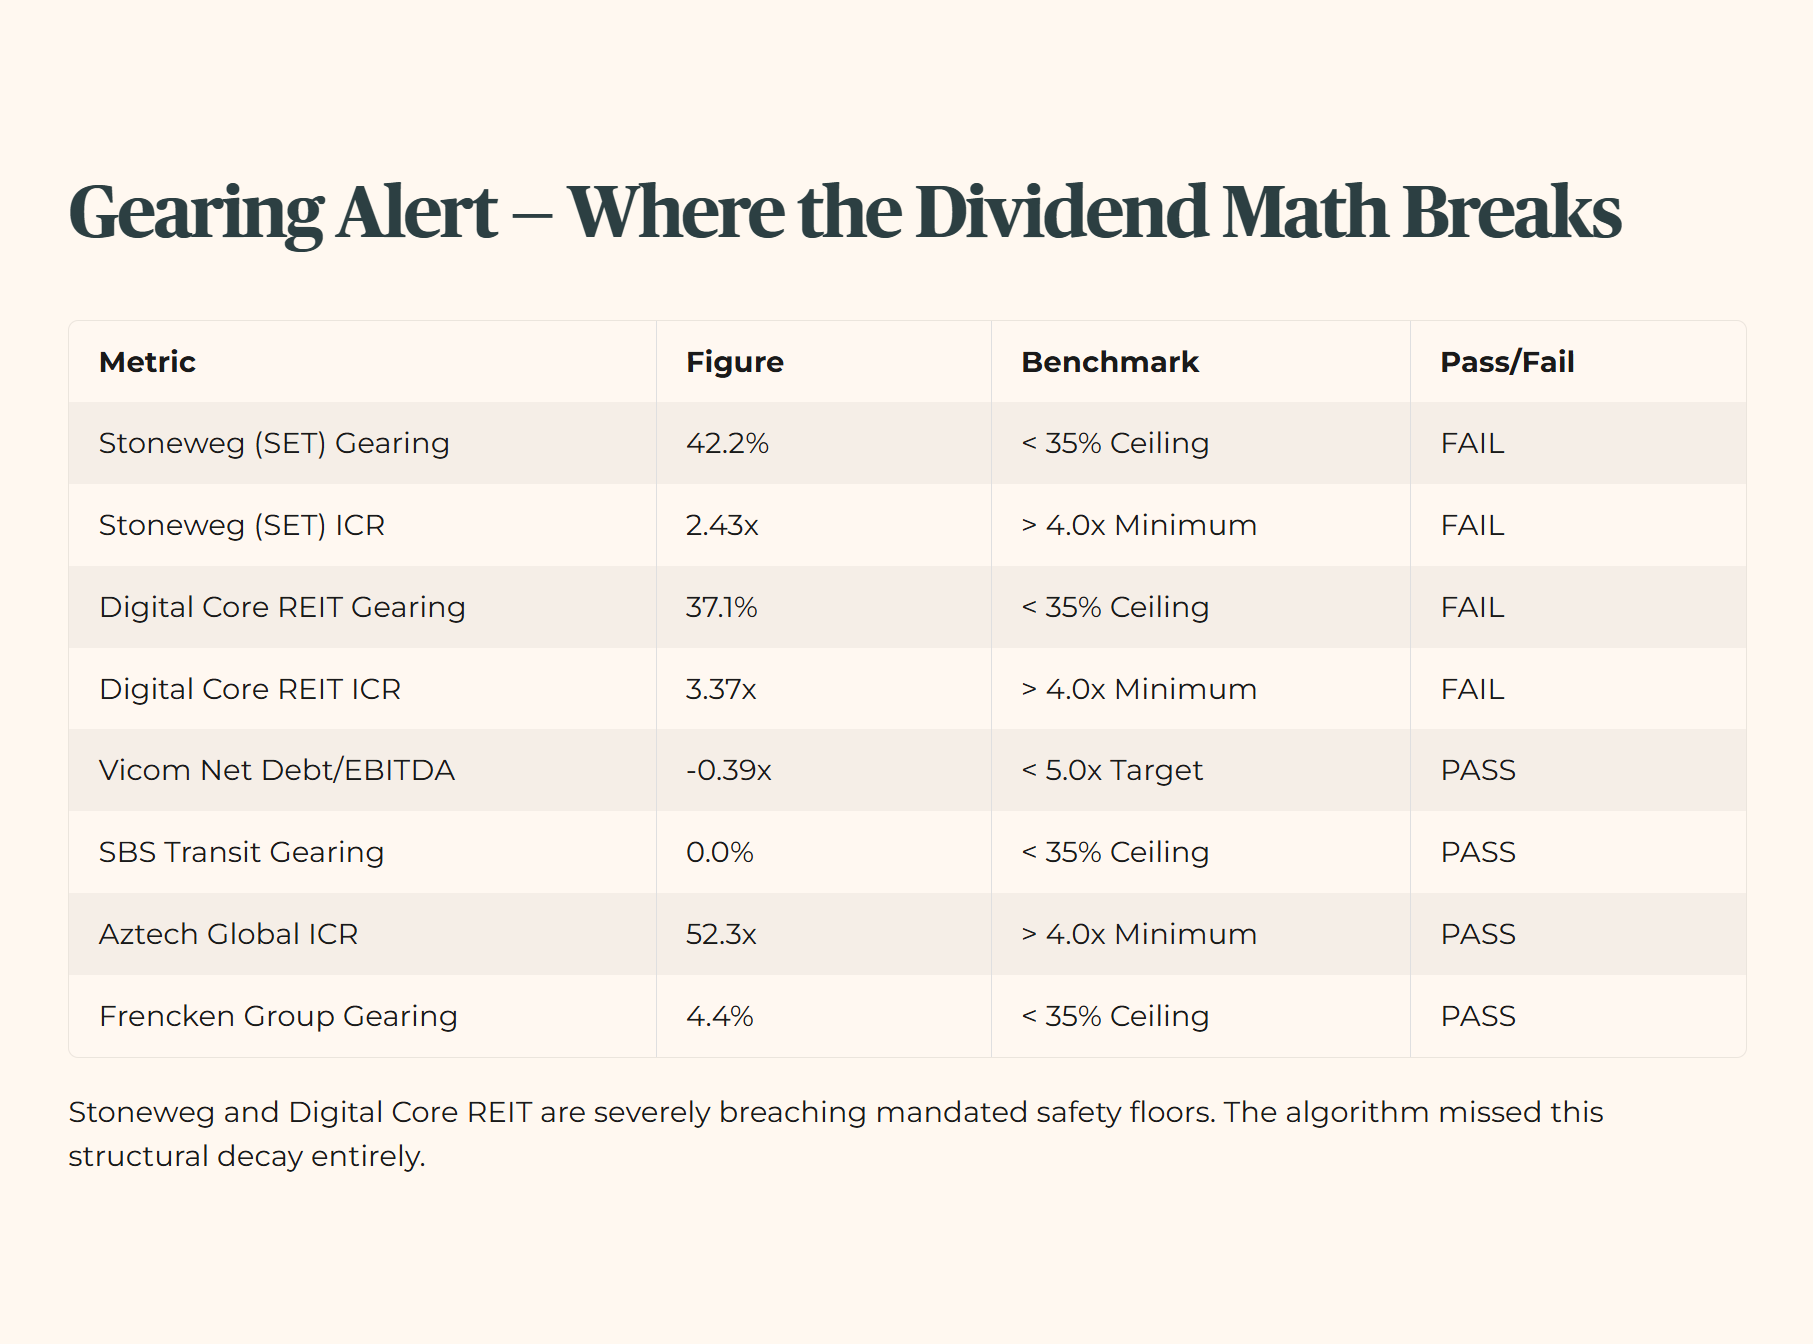
The data above is verified strictly from primary financial statements. Stoneweg and Digital Core REIT are severely breaching our mandated safety floors. The algorithm missed this structural decay entirely.
Step 2: The Wealth Check (Yield and Cash Flow)
Capital preservation is only half the equation. The other half is ensuring you are actually being compensated for the risk you are taking. A high distribution paired with a declining Net Asset Value is not an investment. It is an engineered illusion.
We want to see organic Net Property Income driven by actual rent increases. We do not want temporary sponsor top-ups designed to make the yield look attractive for retail buyers.

When the AI highlights a 13% or 15% yield, it is simply dividing the trailing payout by the current share price. It does not ask if that payout was inflated by a one-off special dividend. We calculate the true risk premium by taking the asset’s true organic yield and subtracting the current risk-free rate.
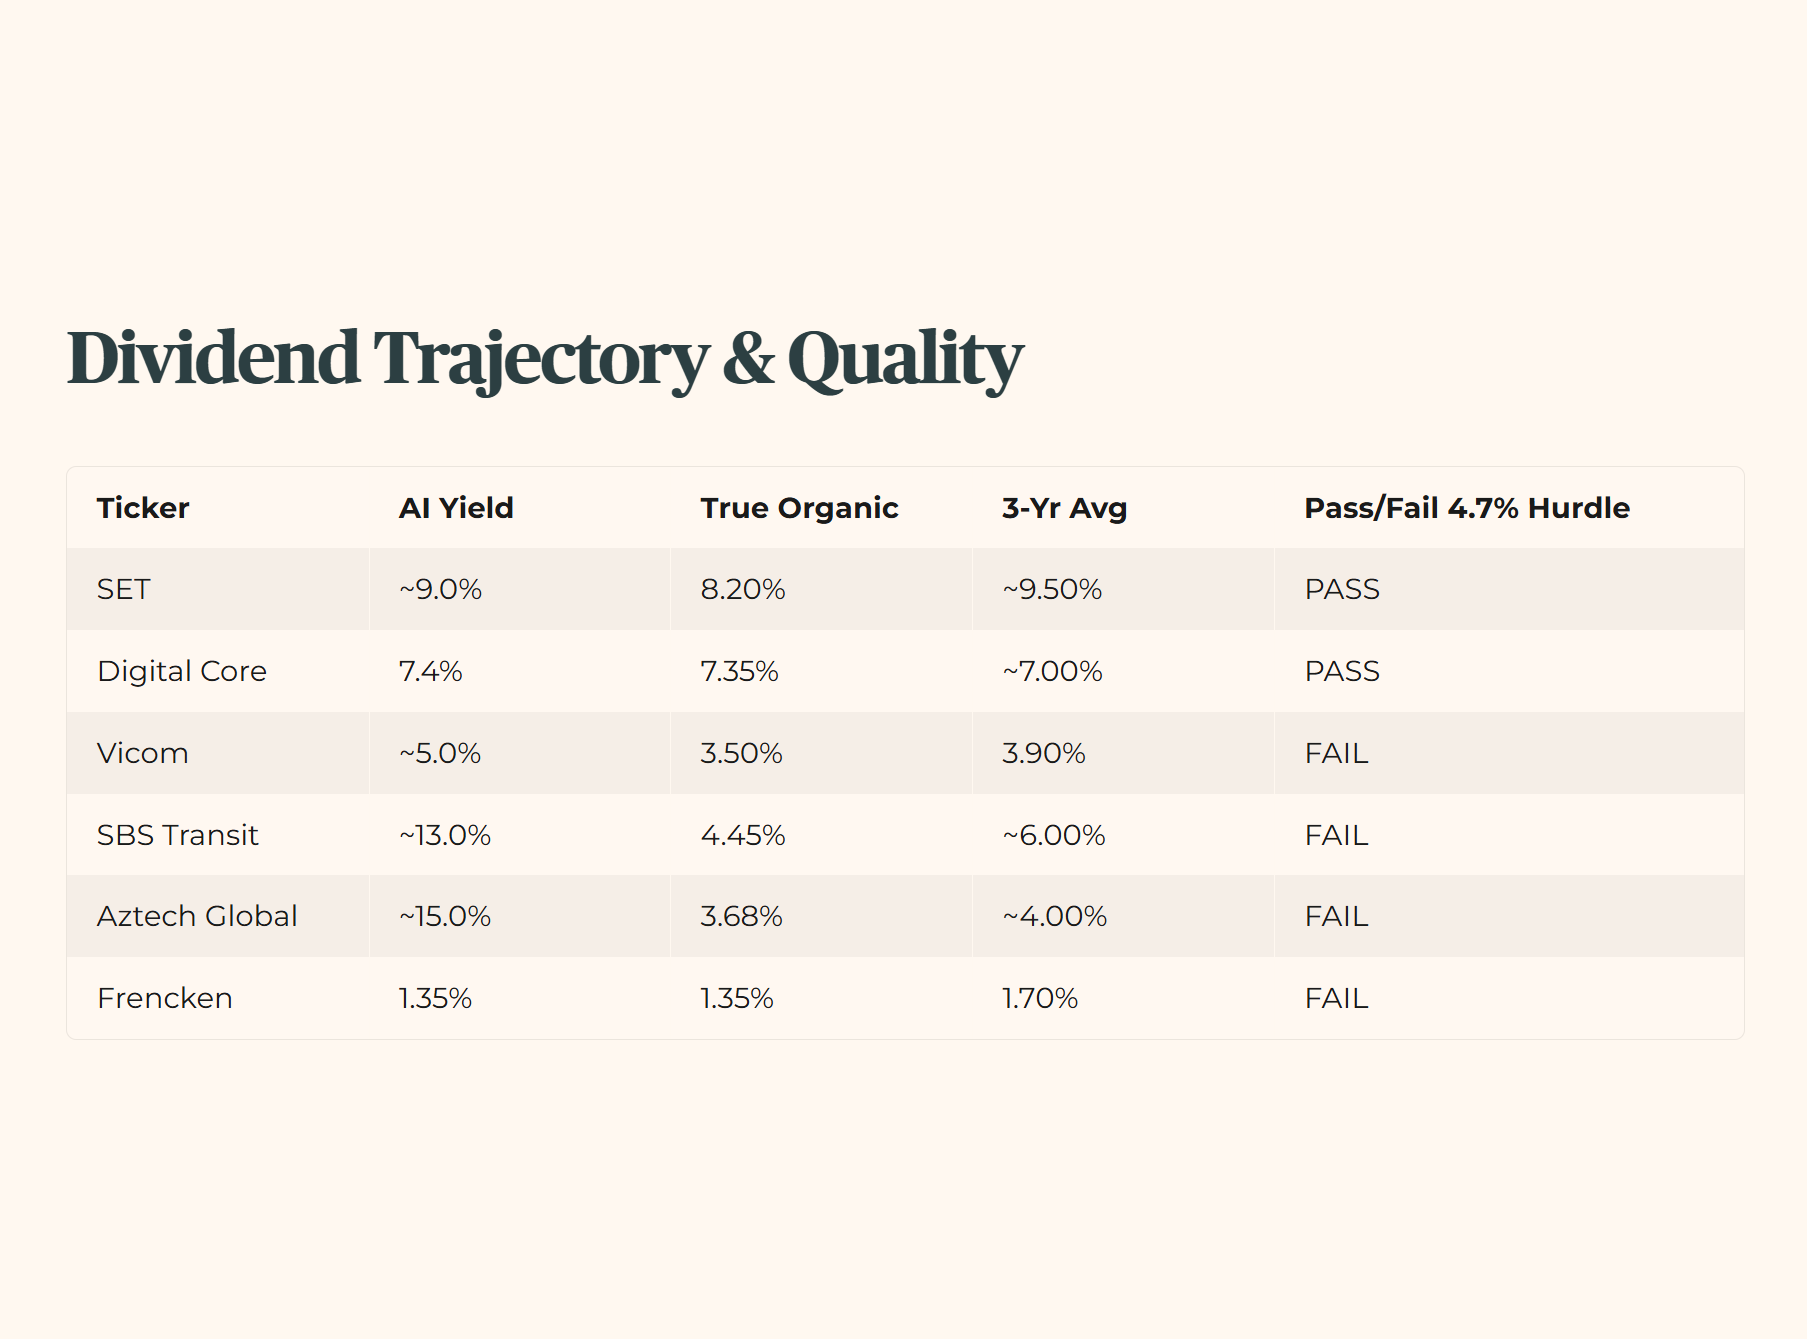
Note on the Stress-Test Buffer: For this audit, I apply a conservative floor of 3.2%. We audit for the storm, not just the sunny day. While the T-Bill sits at 1.46%, I do not lower my standards to match a temporary market dip. My floor remains at 3.2% to ensure sanctuary assets can withstand a return to long-term average interest rates. The minimum yield hurdle is 4.7% — that is the 3.2% floor plus 150 basis points of mandatory risk premium.

Iggy’s Insight: The Cost of Blind Trust
The most dangerous phrase in retail investing is “attractive valuation.” When an algorithm flags a stock as cheap, the market has usually already priced in a fundamental deterioration that trailing metrics miss entirely. High yields in this macro environment are rarely a gift.
They are an apology for massive impending balance sheet friction. If an asset cannot clear our absolute minimum yield hurdle organically, it simply does not belong in a retirement portfolio.
We do not buy apologies. We buy bulletproof cash flow.

Step 3: The Price Check (Valuation)
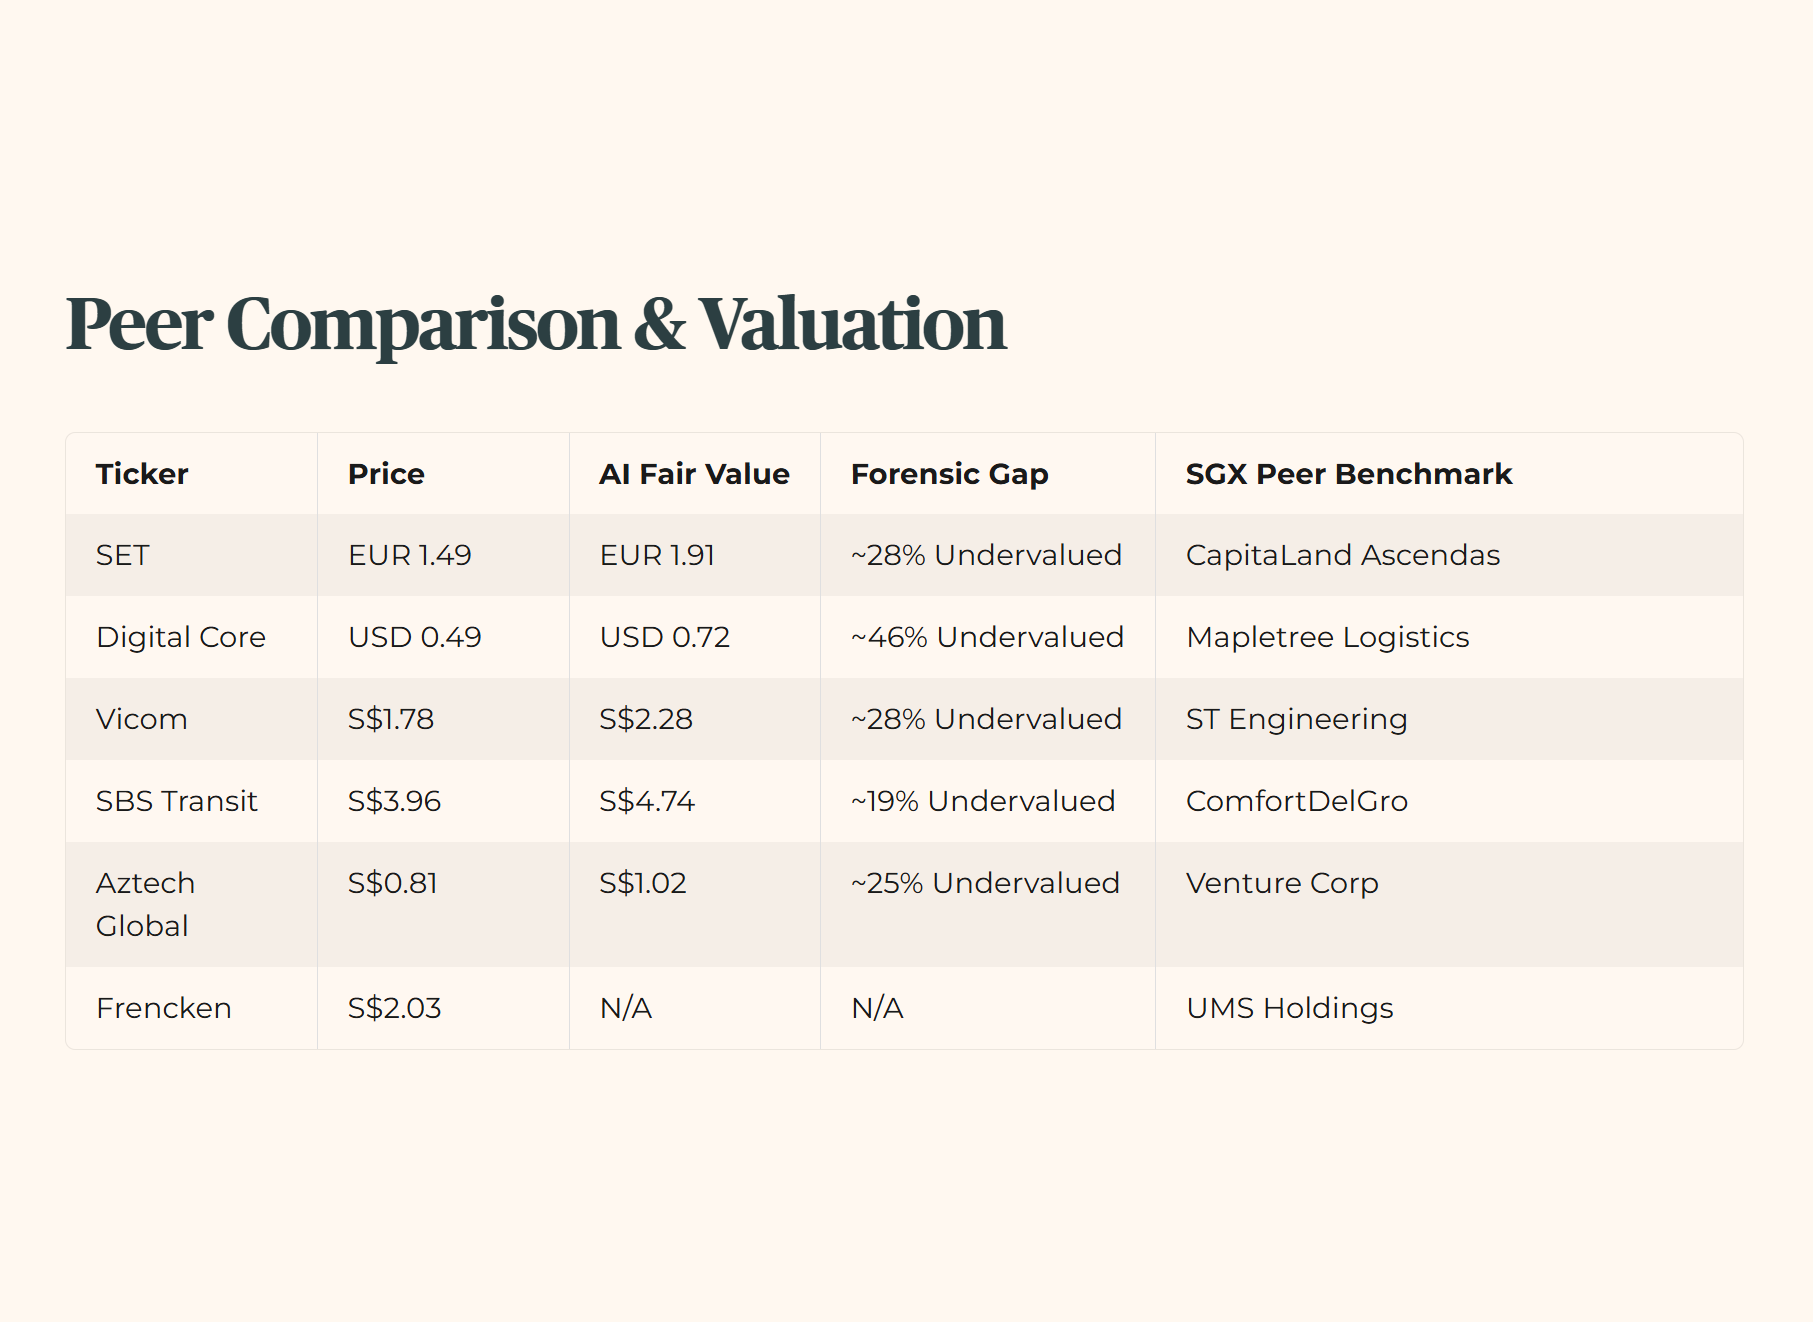
We need to establish The Forensic Gap. This is the explicit difference between the algorithmic Fair Value and the current market price. A wide gap might indicate a screaming buy. Or, it might indicate a value trap where the broader market knows something the algorithm does not.

Think of it using the MRT Door Paradox. Rushing into a cheap momentum stock is like sprinting for the closing doors of an MRT train. You might make it inside and catch a fast ride. But you also risk getting structurally crushed when the system’s safety mechanisms fail to protect you. If a stock is trading at a massive discount to its peers but carries double the debt load, that is not a bargain. That is the market accurately pricing in the risk of a highly dilutive rights issue.
Iggy’s Insight: The Momentum Illusion
Machine learning algorithms love momentum. They are programmed to chase price action and extrapolate quarterly revenue surges into infinity. But capital-intensive businesses on the local exchange do not scale to infinity. They hit physical constraints and financing walls.
When you see a stock surge massively in twelve months, the easy money has already been extracted by institutional players. Buying in now based on a trailing indicator means you are providing exit liquidity for the smart money. Never pay a premium for yesterday’s growth story.
But the individual ticker audits in the next section expose how every one fails at least one layer—revealing the precise yield traps the algorithm concealed.
