




The S-REIT Divergence: Who Has the Better Map?
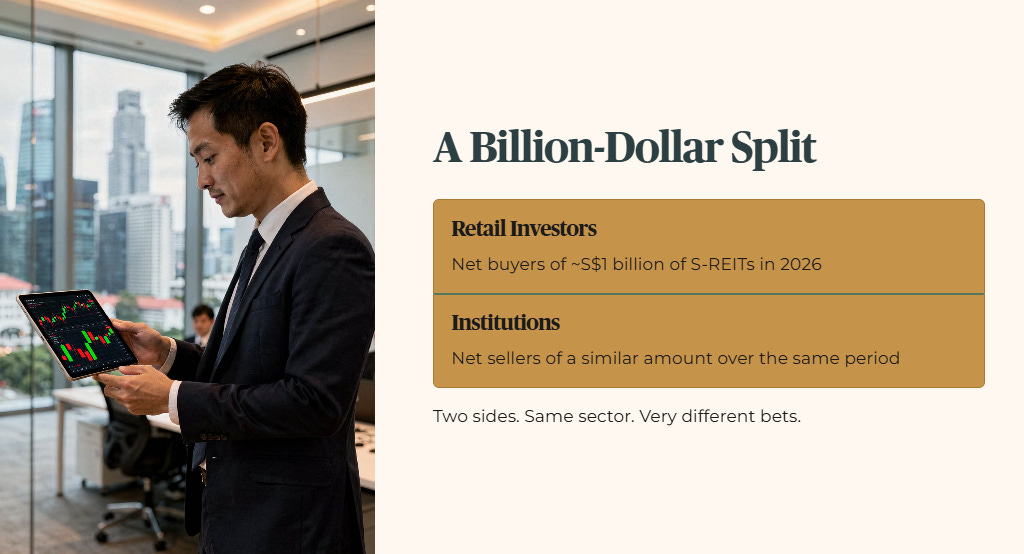
Retail investors bought roughly S$1 billion of S-REITs this year. Institutional investors sold a similar amount over the same period. That gap alone would be worth watching, but it gets more interesting when you look at what each side may actually be seeing.
If you are chasing growth and momentum, a higher-risk profile may clear your hurdle. But if you are a retiree focused on wealth preservation and dependable drawdown income, my forensic standard is built to protect that instead. We need to talk about what just happened to property trusts in the first half of 2026. The headline number looks grim, but underneath it, two very different groups of investors are placing very different bets.


The Underperformance Gap: Headlines vs. Valuations
The Billion-Dollar Divergence
Where the Operating Resilience Actually Lives
🦎 Iggy's Insight
The Selector's Playbook: Growth Drivers vs. Defensive Income
Wallet Impact: The Drawdown Reality
🦎 Iggy's Insight
The Bottom Line
The Underperformance Gap: Headlines vs. Valuations
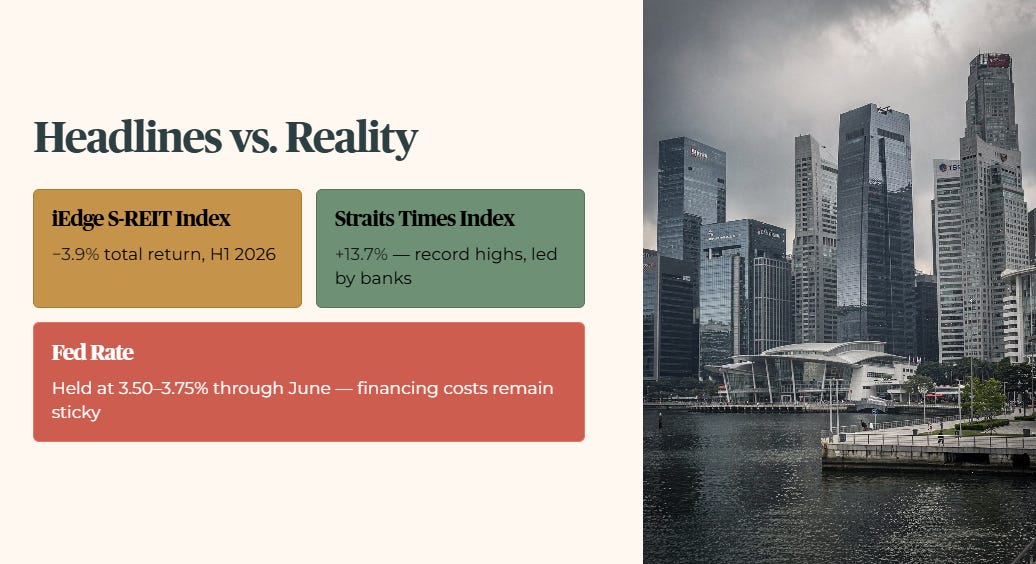
The broader Singapore market has been celebrating. Real estate portfolios have not been invited to the party. During the first half of 2026, the iEdge S-REIT Index posted a total return of negative 3.9% year to date. Over the same window, the Straits Times Index surged 13.7%, driven to record territory by the local banks.
A major anchor on the sector has been the macroeconomic backdrop. The US Federal Reserve held its benchmark rate steady at 3.50% to 3.75% through June, and that stickiness continues to weigh on how investors price long-term financing costs for property trusts. When borrowing stays expensive, the interest bill on a REIT’s debt eats a larger share of the income it can actually pay out.
🟢 Iggy’s Insight:
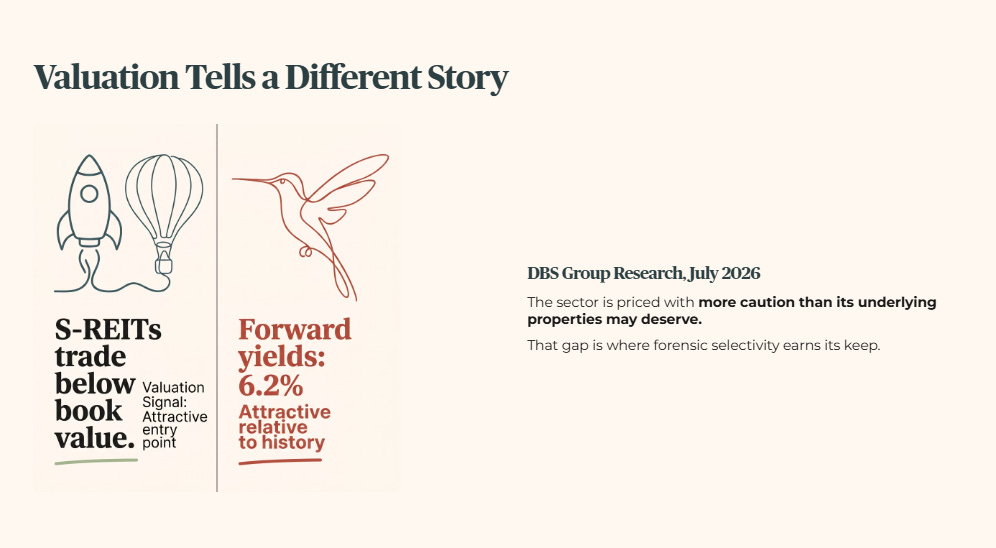
Valuation tells a slightly different story than price action alone. DBS Group Research noted in July that Singapore REITs are trading below their historical book value, with forward yields around 6.2%, a spread it flagged as attractive relative to the sector’s own history. That doesn’t mean every trust is cheap for good reason. It means the sector as a whole is being priced with more caution than its underlying properties may deserve, and that gap is exactly where forensic selectivity earns its keep.

The Billion-Dollar Divergence
The more interesting data point from H1 2026 isn’t the index decline. It’s who kept buying through it.
Retail investors were net buyers of approximately S$1 billion of S-REITs year to date, according to SGX fund flow data cited by Business Times. Institutional investors were net sellers of a similar amount over the same window. These aren’t a precisely matched pair from a single dataset, so treat the parallel as directional rather than exact, but the direction itself is clear and consistent across multiple reports.
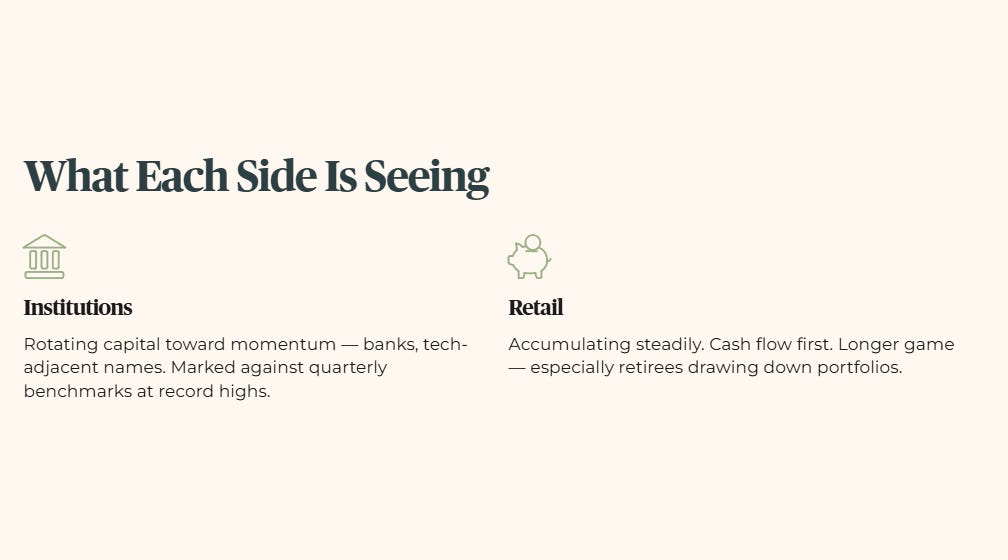
Institutions appear to be treating the sector as a source of funds, rotating capital toward the momentum trade in banks and tech-adjacent names. Heartland retail investors, by contrast, look to be accumulating steadily, prioritizing yield and cash flow over short-term price direction.

Neither side is automatically right. Institutions are often marked against quarterly performance versus a benchmark that happens to be at record highs right now. The retail investor drawing down a portfolio in retirement is usually playing a longer, cash-flow-first game. But “retail is buying, so it must be safe” is not a forensic argument, and neither is “institutions are selling, so avoid the sector entirely.” Blanket conclusions in either direction miss the point. What matters is which specific trusts are producing real, growing income, and which are simply cheap for a reason.
Where the Operating Resilience Actually Lives
Treating every property trust as a single asset class is the mistake that costs retail investors money. While the sector index dragged, some managers kept delivering on fundamentals regardless of what the price was doing.
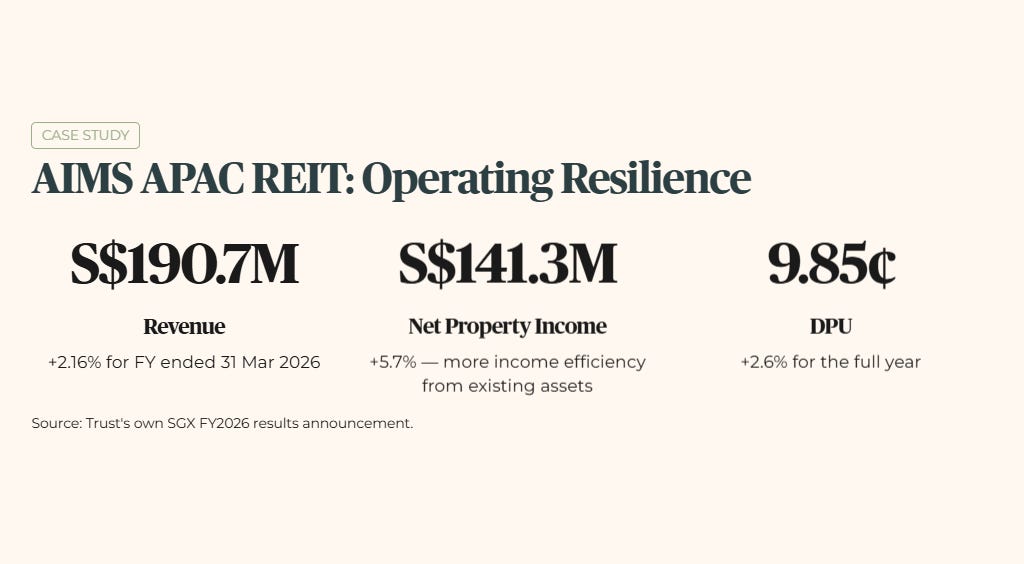
AIMS APAC REIT is a useful illustration, not because of any single headline return figure, but because its underlying operating numbers held up cleanly through a difficult sector-wide stretch. For the financial year ended 31 March 2026, revenue grew 2.16% to S$190.665 million. Net property income (NPI, the rental income left over after property-level operating costs are paid) rose a faster 5.7% to S$141.3 million, meaning the trust is extracting more income efficiency from its existing assets, not just growing top-line revenue.
That operational strength flowed through to unitholders directly: distribution per unit rose 2.6% to 9.850 Singapore cents for the full year, confirmed in the trust’s own SGX results announcement.
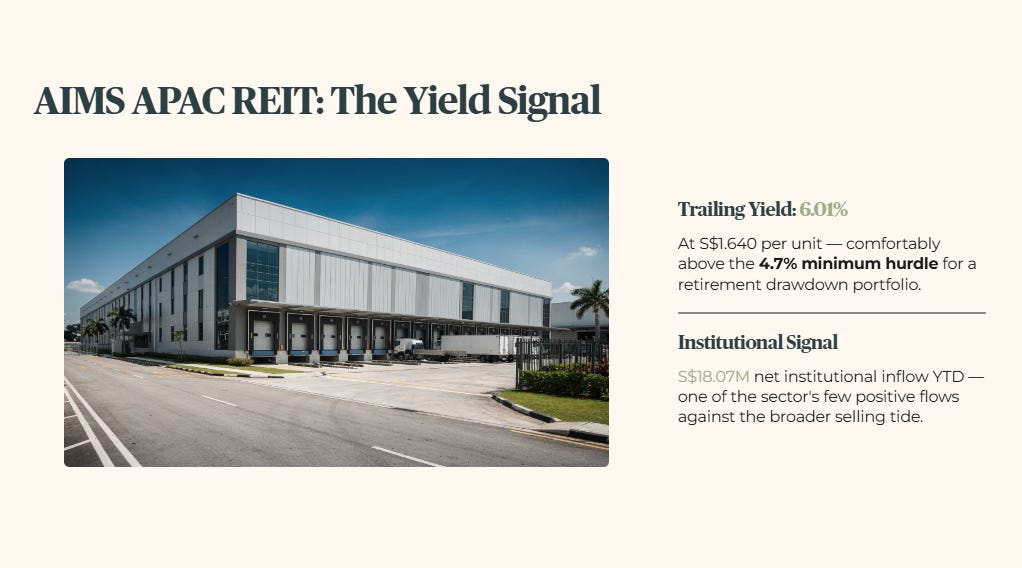
At the current price of S$1.640, that DPU works out to a trailing distribution yield of 6.01%, comfortably above my 4.7% minimum yield hurdle (the income threshold I require before any income stock clears the bar for a retirement drawdown portfolio). AIMS APAC REIT was also one of a small number of trusts to attract genuine net institutional buying against the broader sector-wide selling, S$18.07 million of net institutional inflow year to date, per SGX fund flow data. That’s a small but telling signal: institutional money wasn’t fleeing every corner of the sector uniformly, it was being selective too.
The next section applies my 4.7% yield hurdle and institutional flow data directly to AIMS APAC REIT’s 6.01% trailing yield and S$18.07 million net inflow, the point where the divergence story becomes a concrete forensic screen on who actually has the better map.
