



The S-REIT Selloff Nobody’s Talking About: Why It’s Not Singapore’s Fault
US Treasury yields are doing what Singapore’s own rates never did, and the REITs with the least balance sheet room are the ones markets aren’t distinguishing yet.
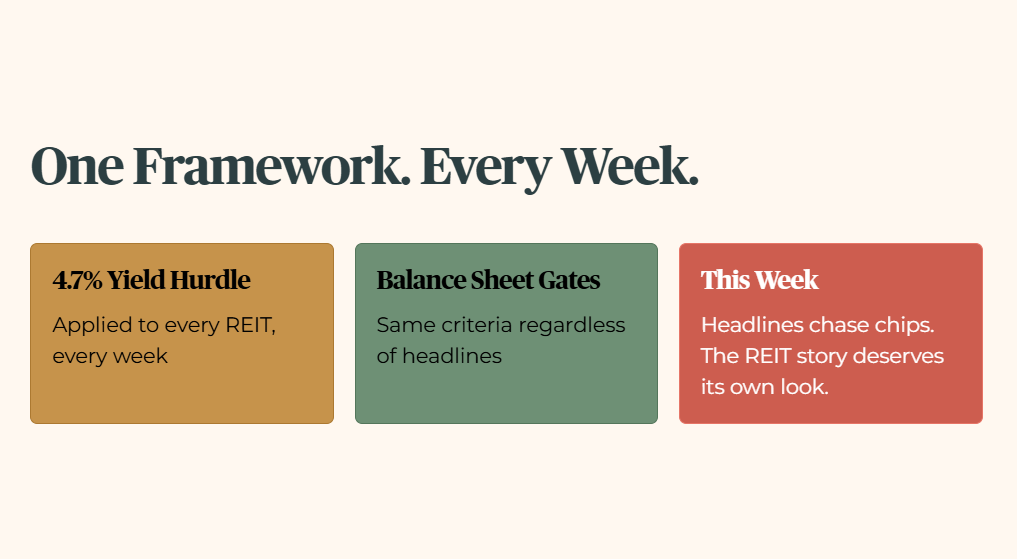
Everyone is watching the tech selloff. Semiconductor stocks wobble, headlines follow. Meanwhile Singapore REITs have quietly fallen 7.1 percent this year while the Straits Times Index climbed past record highs, a gap of roughly 29 percentage points that almost nobody outside the sector is talking about. That gap is not about anything happening in Singapore.
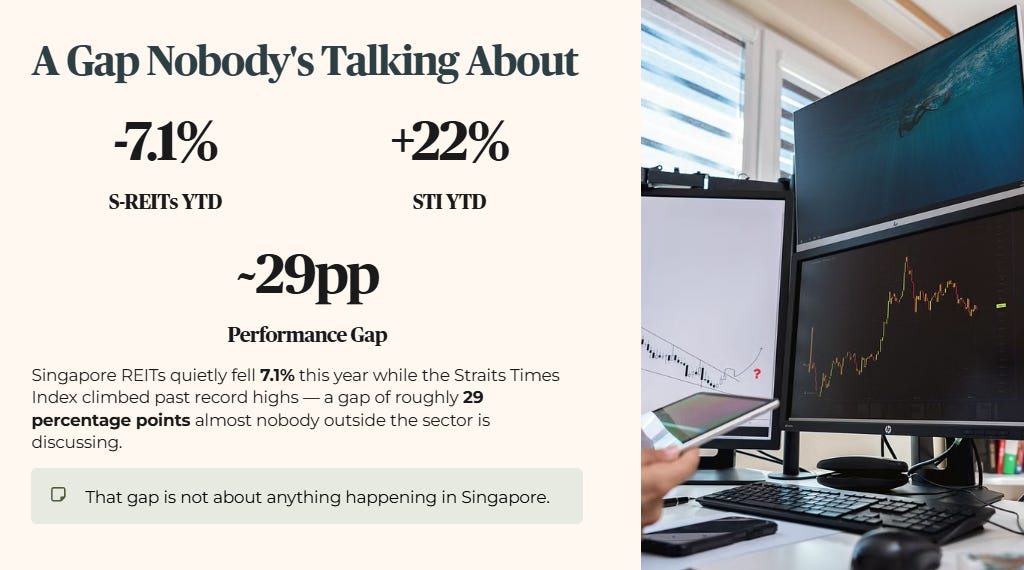
I run every REIT through the same 4.7 percent yield hurdle and the same balance sheet gates regardless of what the headlines are chasing that week. This week the headlines are chasing chips. The REIT story underneath deserves its own look.

The gap that isn’t about Singapore
Why the spread matters more than the headline number
INSIGHT CALLOUT BOX
Balance sheets, not tenants, decide who absorbs this
Keppel DC REIT: the fortress with one cracked wall
Debt maturity: the part that actually matters for this piece’s thesis
Legacy Holders vs. Fresh Capital
Mapletree Industrial Trust: two failing gates, and a hedge profile that just got worse
Debt maturity: not a wall, but a widening exposure
Legacy Holders vs. Fresh Capital
Comparing the two, side by side
INSIGHT CALLOUT BOX
On the forensic framework itself
Iggy’s Elite Read
The gap that isn’t about Singapore
REITs are bond substitutes wearing property deeds.
Their unit prices get judged against risk-free yields constantly, and when those benchmark yields climb, the distribution a REIT pays out looks less attractive by comparison. Money drifts toward the safer asset. Unit prices fall until the yield adjusts back into line.
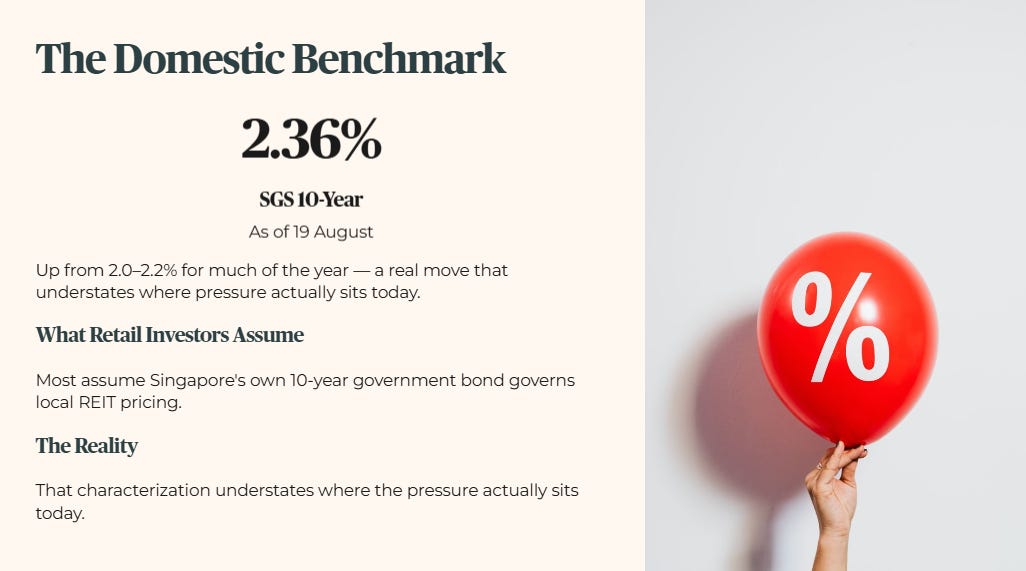
The confusing part is which yield is actually doing the damage. Singapore’s own 10-year government bond has been the domestic benchmark most retail investors assume governs local REIT pricing. It currently sits at 2.36 percent as of 19 August, up from a range that held closer to 2.0 to 2.2 percent for much of the year. That is a real move, and characterizing it as merely “around 2 percent for most of the year” understates where the pressure actually sits today.
What is actually driving the derating harder is the US Treasury yield, a benchmark with nothing to do with Singapore’s own monetary settings, yet it still sets the mood for how global capital prices every REIT valuation model on the planet.

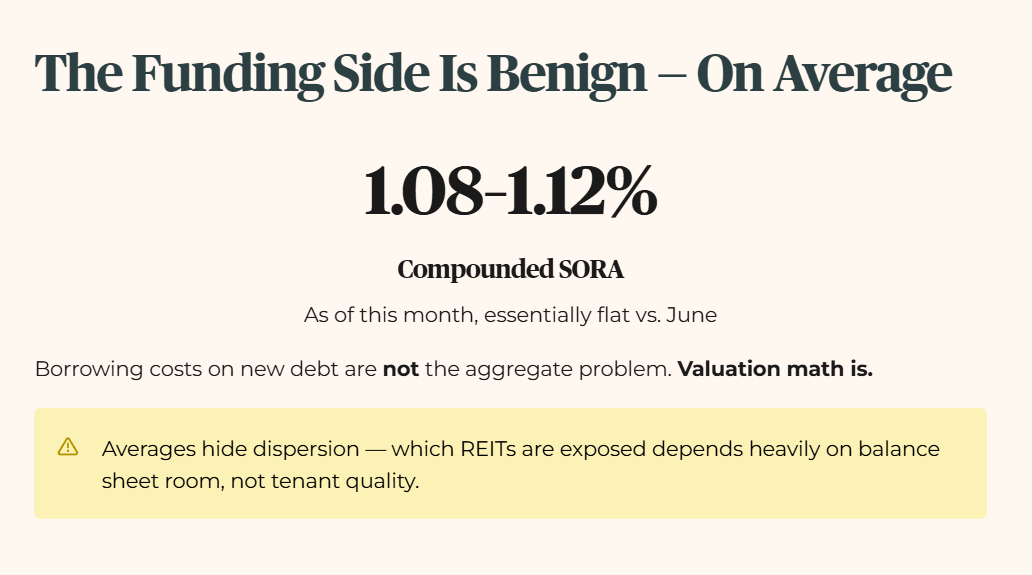
Meanwhile the funding side of the story is genuinely benign, at least on average. Compounded SORA, the floating rate benchmark most S-REITs use to price their own debt, sits at roughly 1.08 to 1.12 percent as of this month, essentially flat against where it sat in June. Borrowing costs on new debt are not the aggregate problem. Valuation math is. But averages hide dispersion, and which specific REITs are exposed to that valuation math turns out to depend heavily on balance sheet room that has nothing to do with tenant quality.
Why the spread matters more than the headline number
Market convention prices a healthy REIT yield spread at roughly 3 to 4 percentage points over the 10-year SGS. Against 2.36 percent, that implies a market-clearing REIT yield floor somewhere around 5.4 to 6.4 percent, a materially higher bar than my own 4.7 percent forensic hurdle.
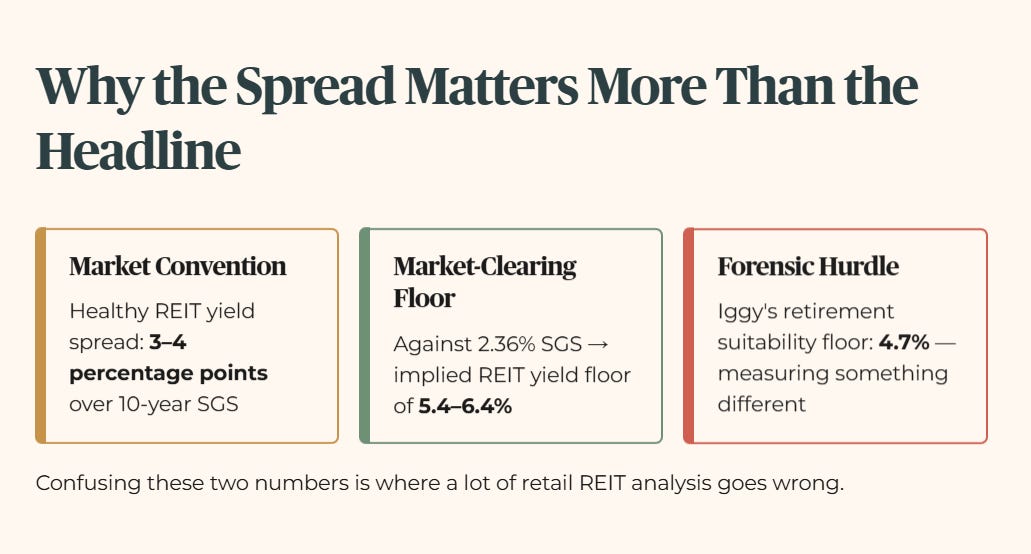
Those two numbers are not measuring the same thing, and confusing them is where a lot of retail REIT analysis goes wrong.
🟢INSIGHT CALLOUT BOX
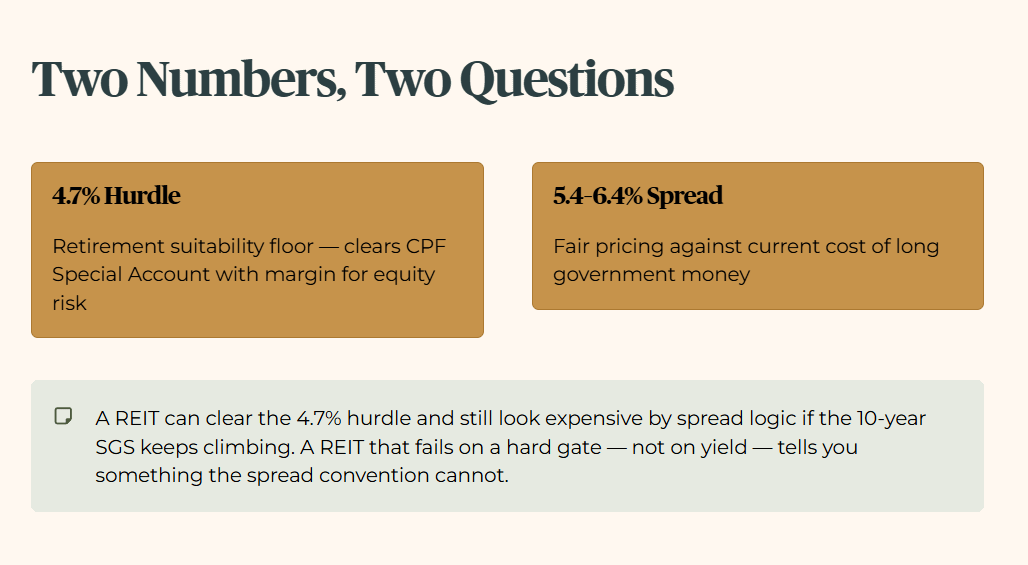
My 4.7 percent hurdle is a retirement suitability floor. It asks whether a REIT clears the highest quality guaranteed SGD yield in the system, CPF Special Account, with enough margin to compensate for equity risk. The market’s 5.4 to 6.4 percent spread convention asks something different: what yield does a REIT need to offer today to look fairly priced against the current cost of long government money.
A REIT can clear my hurdle comfortably and still look expensive by the market’s own spread logic if the 10-year SGS keeps climbing. The two numbers moving together does not mean they move by the same amount, and a REIT that fails my hurdle on a hard gate, not on yield, tells you something the spread convention cannot.
Balance sheets, not tenants, decide who absorbs this
REITs run on borrowed money by design, and most of their income gets distributed rather than retained. When loans come up for refinancing, every extra dollar spent servicing pricier debt comes straight out of the distribution per unit. This is true regardless of how strong the underlying tenant base looks. A REIT can have a full occupancy waiting list and still take a real hit if its balance sheet has no room to absorb the refinancing math.
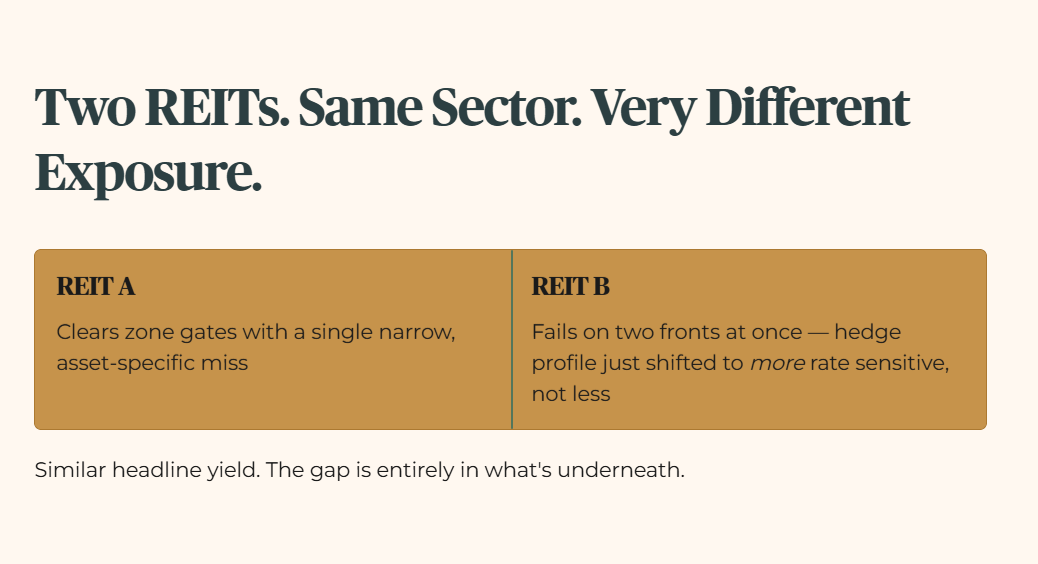
I track two REITs right now that sit in exactly this position, similar sector, similar headline yield, very different exposure once you look past the tenant list. One clears my zone gates with a single narrow, asset-specific miss. The other fails on two fronts at once, and its hedge profile just shifted in a direction that makes the next twelve months more sensitive to rates, not less.
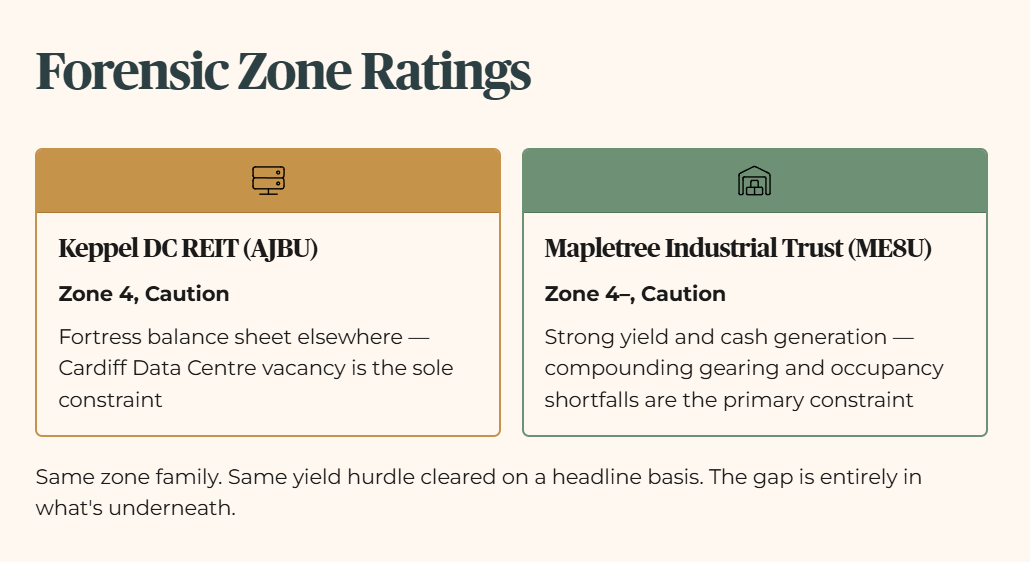
Iggy’s Forensic Zone, Keppel DC REIT (AJBU): Zone 4, Caution
Iggy’s Forensic Zone, Mapletree Industrial Trust (ME8U): Zone 4-, Caution
Same zone family, same yield hurdle cleared by both on a headline basis. The gap between them is entirely in what’s underneath, and that’s exactly the part a spread-convention read of “REITs look cheap again” would miss.
🔒 What’s Next
Both REITs clear my 4.7 percent hurdle. The gearing, ICR, and occupancy numbers that actually separate a narrow, single-asset miss from a compounding balance sheet problem are below, along with a debt maturity comparison that shows one REIT’s rate exposure just got materially worse in a single quarter.
