

Z-Score Secrets Institutional Pros Use Now
Don't just look at the long queue at the stall; check if the Uncle can still pay his rent.

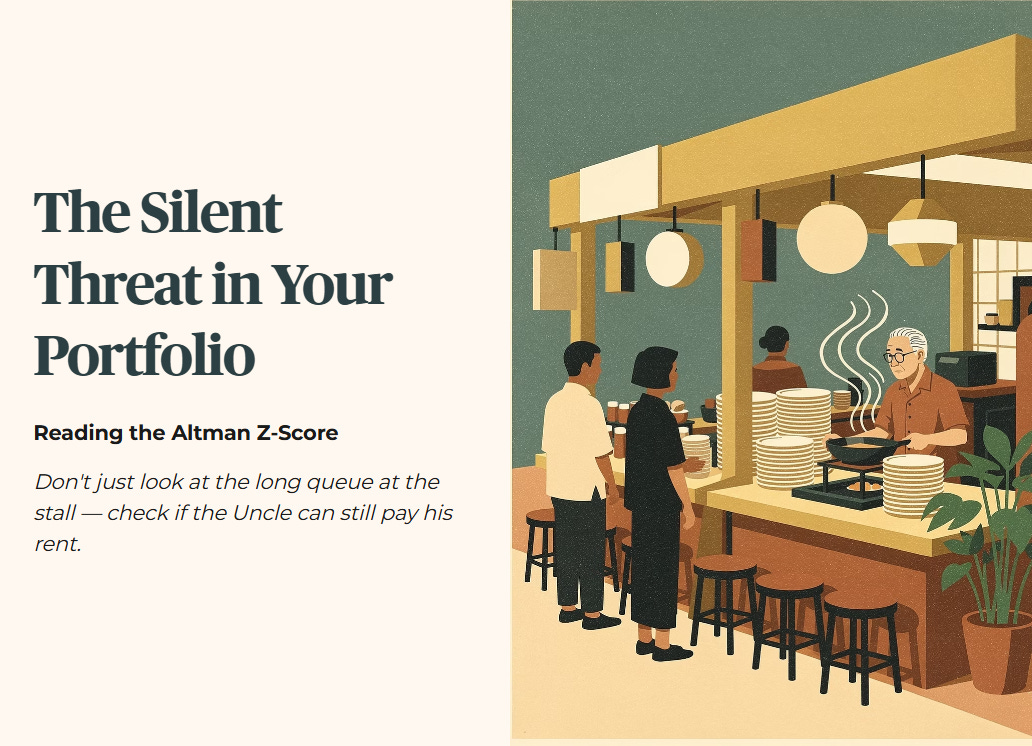
It is 7:30 AM at the Bedok Interchange hawker centre. You are standing in the queue for your favourite economic bee hoon, clutching a lukewarm cup of kopi-o kosong. You watch the stall owner—a man who has been chopping cabbage and frying noodles in the exact same spot since 1998. He looks busy. The queue is long. The wok is roaring. To the untrained eye, business is booming.
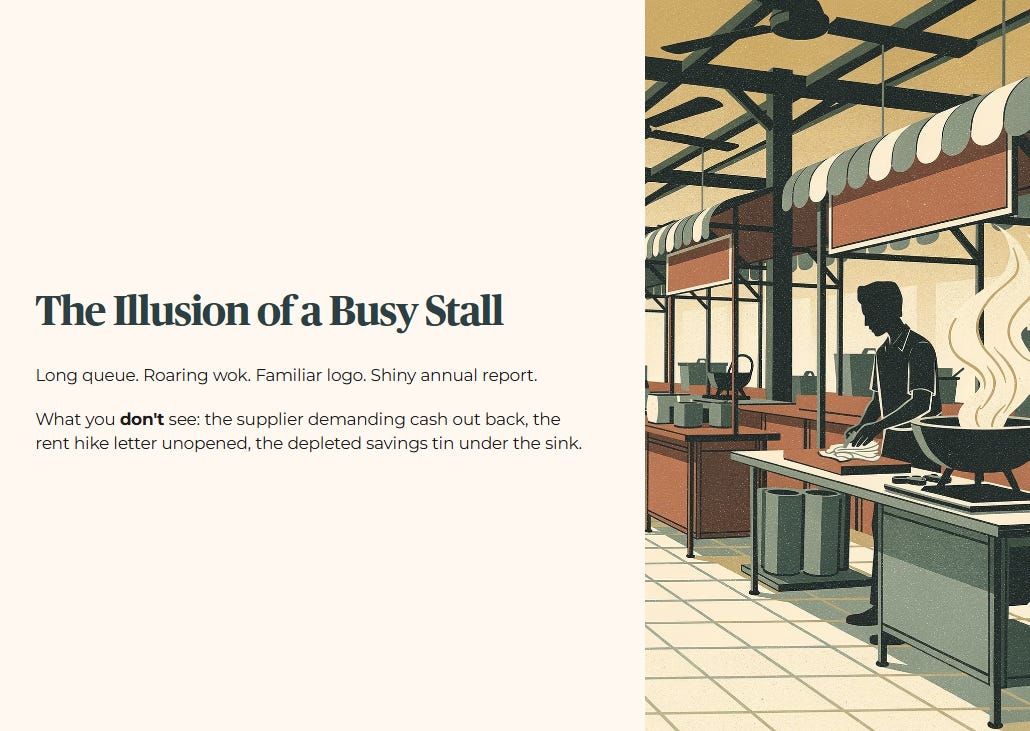
And let’s be honest, this is exactly how most retail investors look at the stock market. We see a company with a familiar logo, a long history, and a shiny annual report, and we assume the financial foundations are as solid as HDB concrete. We look at the dividend payout hitting our bank accounts and think, “Business is booming.”
But what you do not see at the hawker stall is the supplier waiting at the back alley demanding cash, the rent hike letter sitting unopened on the counter, and the depleted savings tin hidden under the sink.
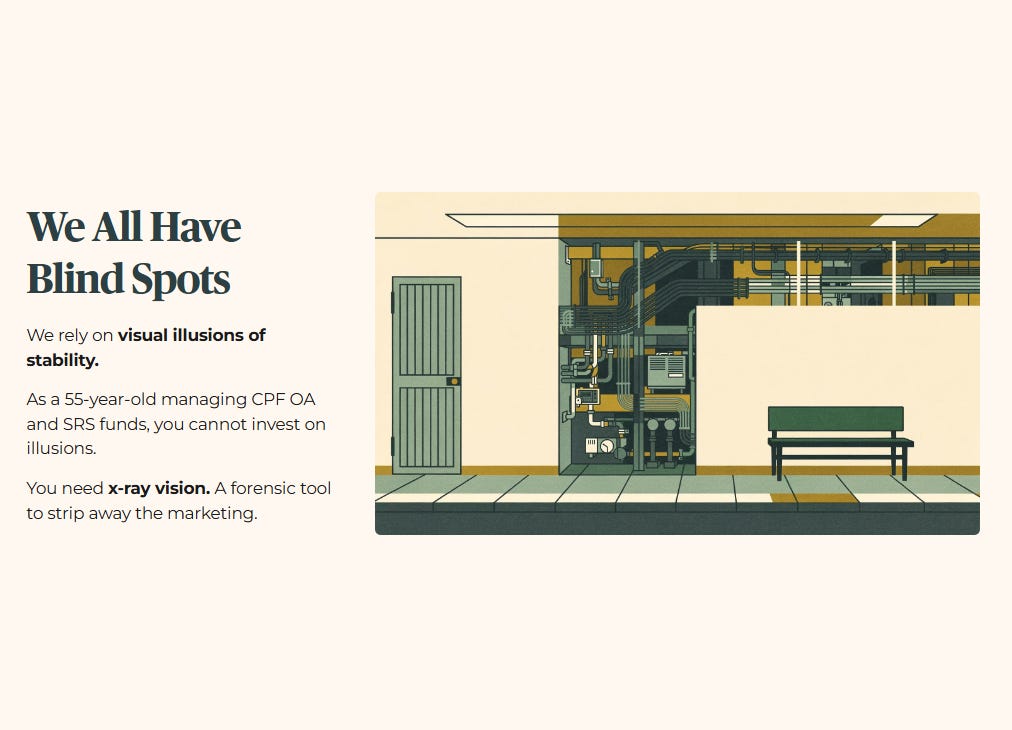
As of this morning, our community is growing — and we all share the same blind spots. We rely heavily on the visual illusions of stability. But as a 55-year-old managing your hard-earned CPF Ordinary Account and SRS funds, you cannot afford to invest based on illusions. You need x-ray vision. You need a forensic tool to strip away the marketing and look at the bare bones of a company’s survival odds.
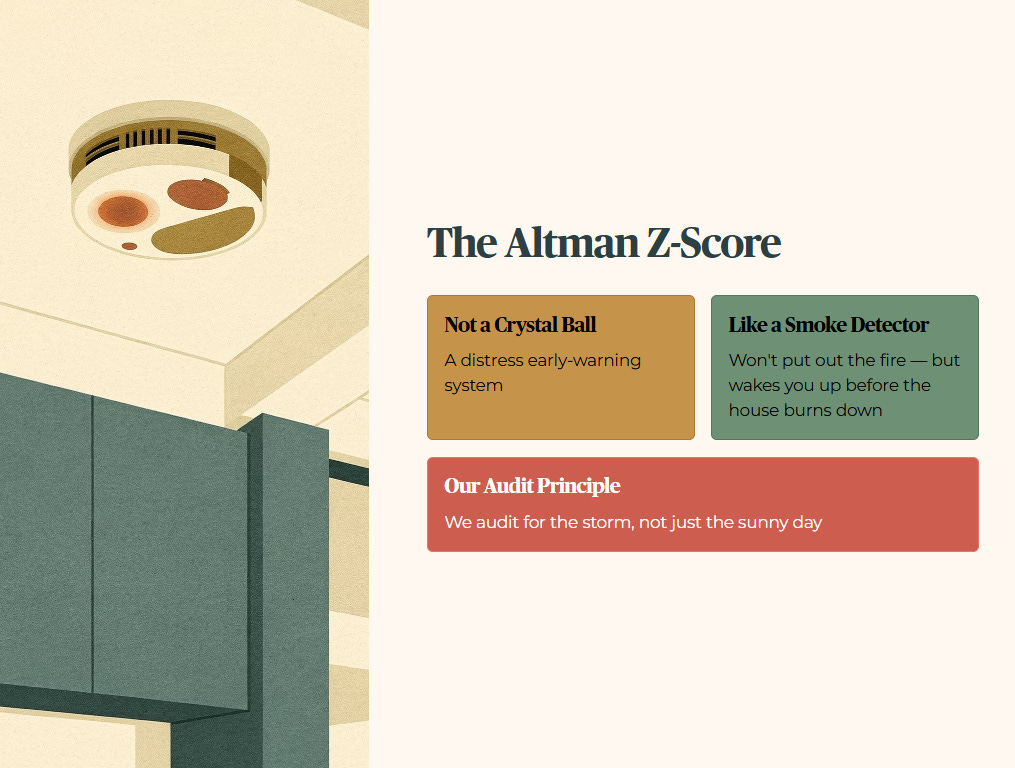
Today, we are looking at the Altman Z-Score. This is not a magic crystal ball. It is a distress early-warning system. It is the financial equivalent of the smoke detector in your kitchen—it will not put out the fire, but it will wake you up before the house burns down. We audit for the storm, not just the sunny day.

In This Article:
Section 1: The formula nobody taught you
Section 2: What the zones actually mean
Section 3: Three SGX snapshots
Section 4: The REIT exception
Section 5: How to run this yourself
Iggy’s bottom line
Iggy’s forensic compliance standards — standard disclaimer
Important partner disclosure
About Iggy & the Elite Investors
One Community. One Forensic Lens. In this market, the difference between a “Sanctuary” and a “Yield Trap” is decided in a single trading session. While free subscribers are reading yesterday’s story, Iggy’s Elite Investors are already cross-checking the next setup — together, in real time.

Iggy’s Elite Investors don’t just get the report earlier. They get the full forensic picture the moment it’s finalised — zero-day breakdowns, the complete “Red Zone” watchlist, and institutional-grade cheatsheets built around the same Five-Layer Audit you see here. The difference is they get it before the market opens, not after it has already moved.
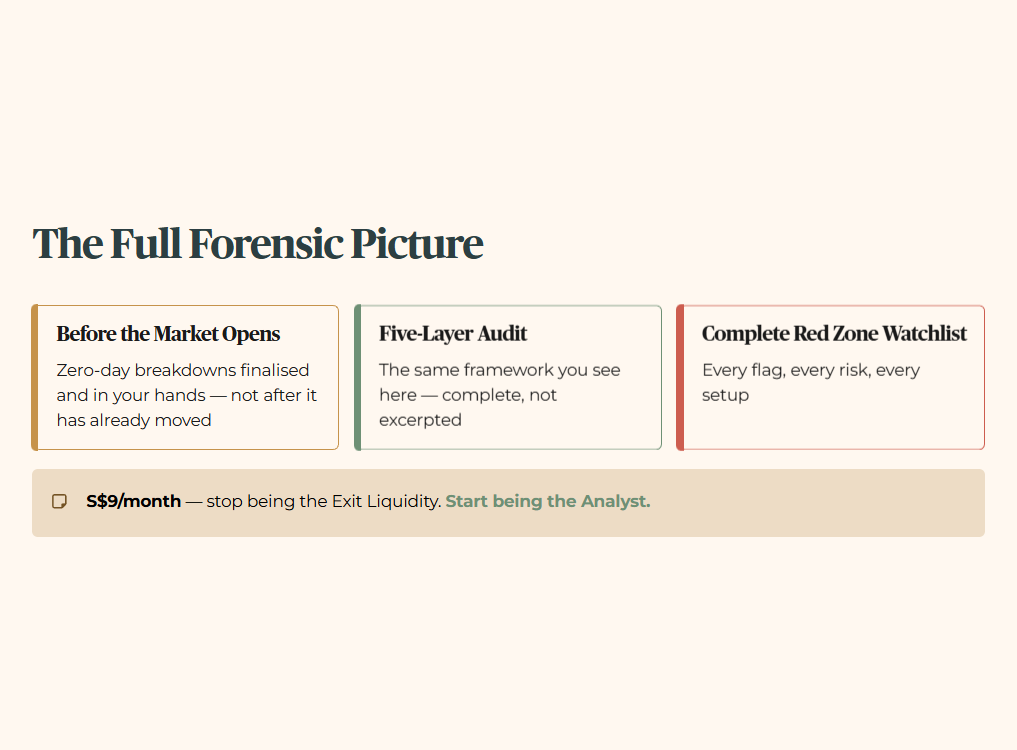
For S$9/month — less than a kopi and kaya toast set at Raffles Place — you stop being the Exit Liquidity and start being the Analyst.
Section 1: The Formula Nobody Taught You
Back in 1968, a finance professor named Edward Altman decided he was tired of investors getting blindsided by sudden bankruptcies. He wanted a mathematical tripwire. He tested dozens of financial ratios and boiled them down to a single predictive score. For non-manufacturing companies—which covers a massive chunk of our SGX landscape—we use a specific variant known as the Z’‘-Score.

Here is the raw mathematics:
Z′′=6.56(X1)+3.26(X2)+6.72(X3)+1.05(X4)Z’‘ = 6.56(X_1) + 3.26(X_2) + 6.72(X_3) + 1.05(X_4)Z′′=6.56(X1)+3.26(X2)+6.72(X3)+1.05(X4)
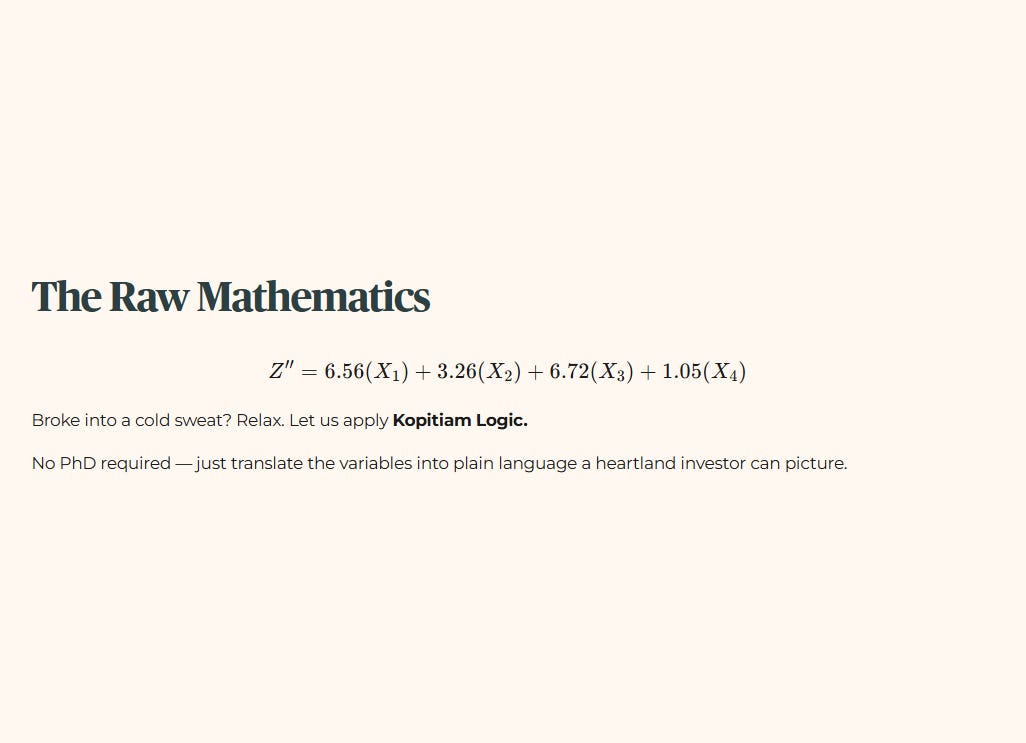
If you just broke into a cold sweat looking at that algebra, relax. Let us apply some Kopitiam Logic. We do not need a PhD to understand this; we just need to translate the variables into plain language a heartland investor can picture.
Educational Note: Breaking Down the Variables
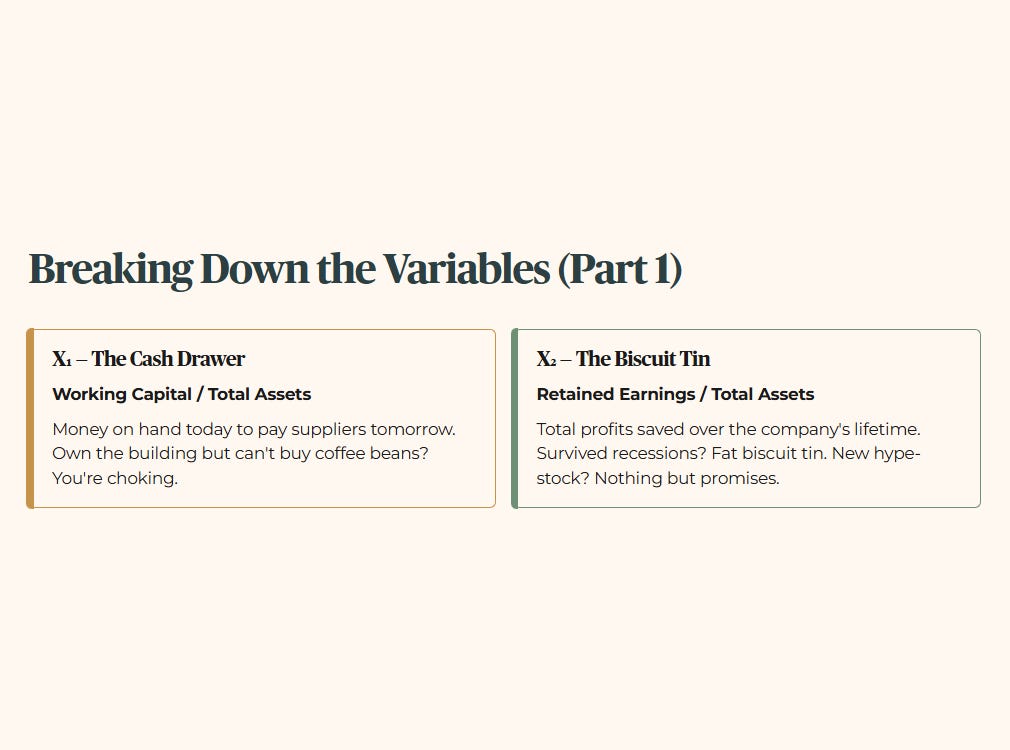
X1X_1 X1 (Working Capital / Total Assets): The Cash Drawer. This is simply the money the kopitiam has on hand today to pay the suppliers tomorrow, compared to the size of the whole operation. If a business has massive assets but no working capital, they are choking. They own the building but cannot afford to buy coffee beans.
X2X_2 X2 (Retained Earnings / Total Assets): The Biscuit Tin. This measures the total profits the company has saved up over its entire lifetime. A company that has survived multiple recessions and saved its pennies will have a fat biscuit tin. A newly listed hype-stock will have nothing but promises.
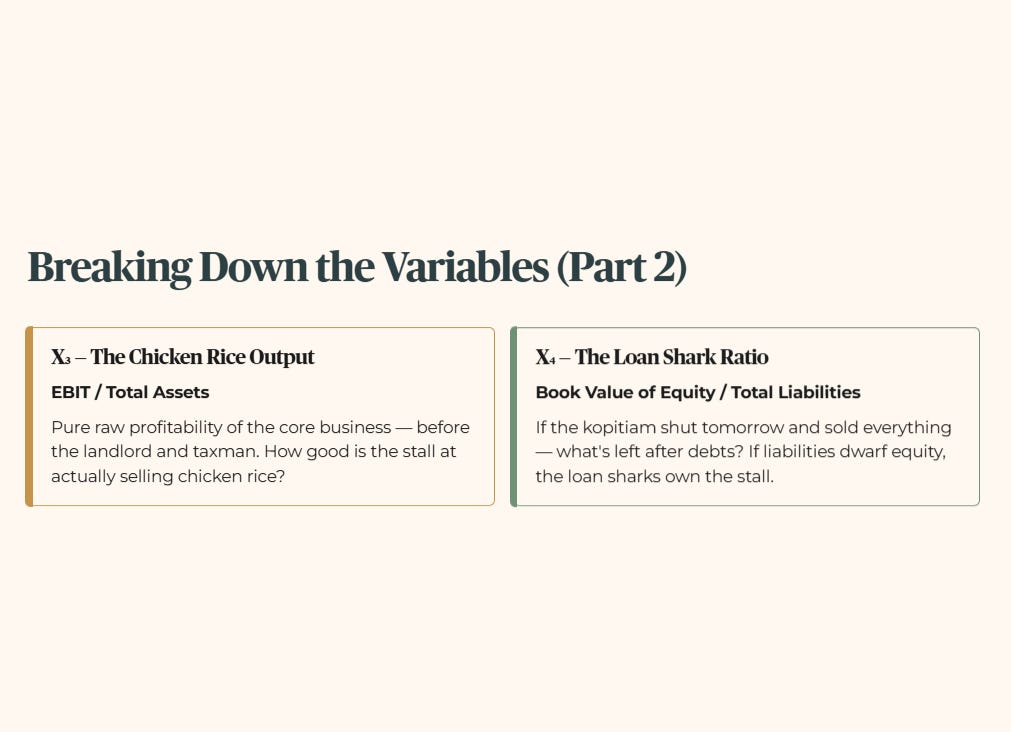
X3X_3 X3 (EBIT / Total Assets): The Chicken Rice Output. EBIT stands for Earnings Before Interest and Taxes. This is the pure, raw profitability of the core business. It tells us how good the stall is at actually selling chicken rice, before the landlord takes a cut and before the taxman comes knocking.
X4X_4 X4 (Book Value of Equity / Total Liabilities): The Loan Shark Ratio. If the kopitiam had to shut down tomorrow, sell every single table, chair, and wok, and pay off all its debts, what would be left? If liabilities dwarf the equity, the stall is effectively owned by the loan sharks, not the uncle.
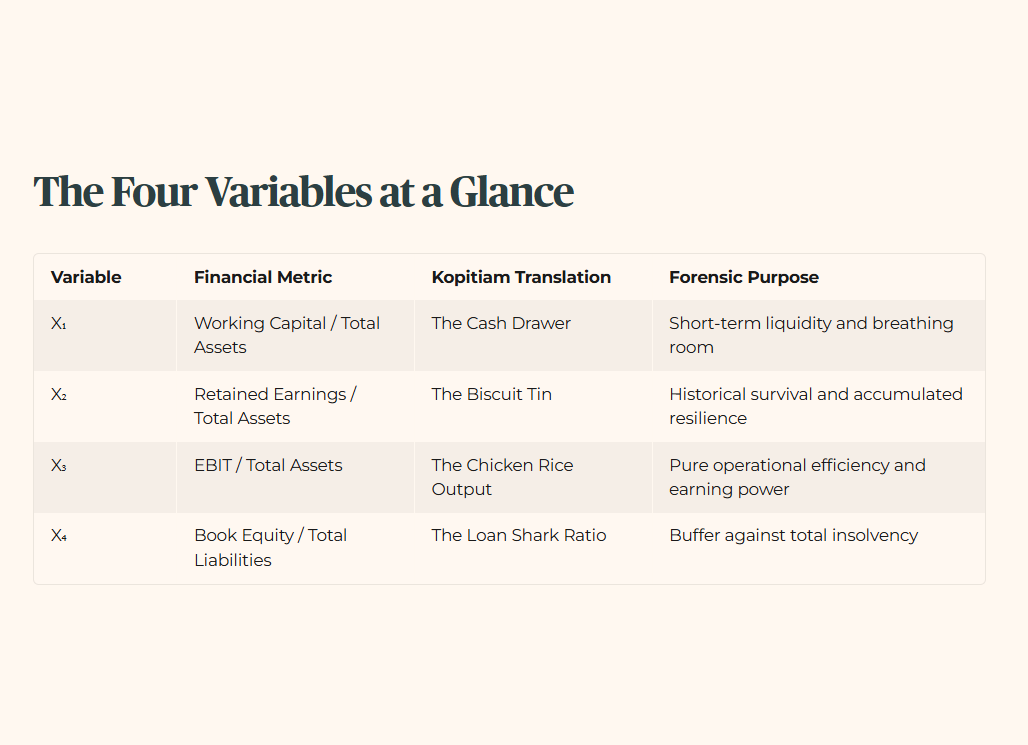
Measures the buffer against total insolvency.
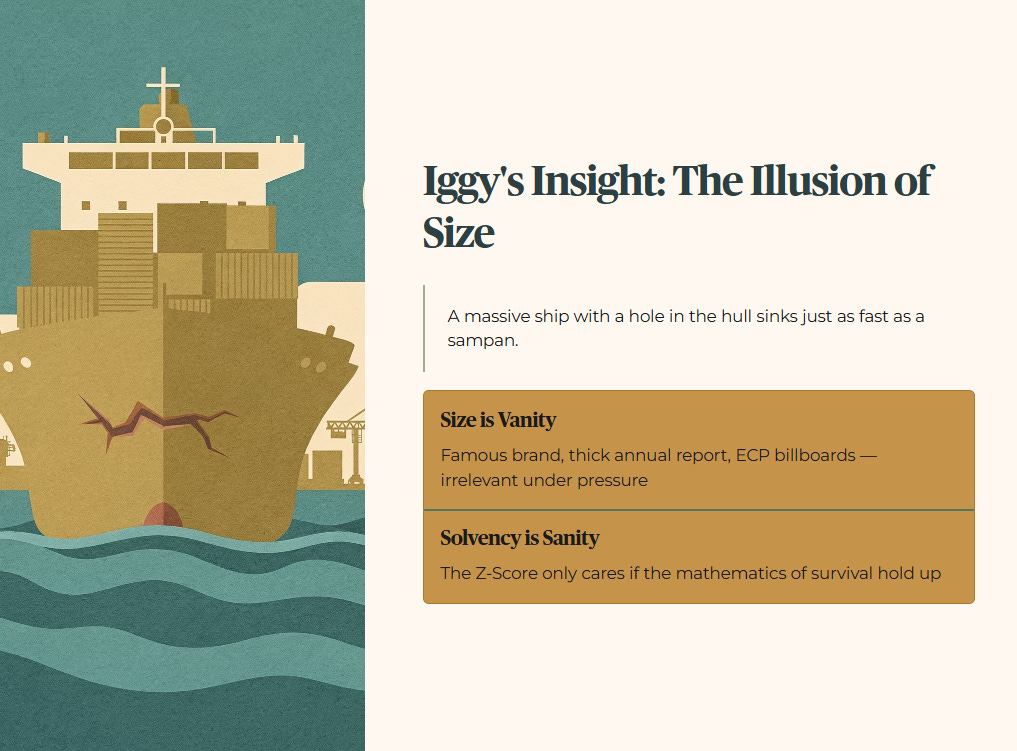
Iggy’s Insight: The Illusion of Size Retail investors constantly mistake a large market capitalisation for safety. A household name on the SGX feels like a sure thing — it has been around for decades, it has billboards along the ECP, and your neighbour’s brother-in-law swears by it. But a massive ship with a hole in the hull sinks just as fast as a sampan.
The Altman Z-Score does not care how famous the brand is, how many awards it has collected, or how thick its annual report looks on your coffee table. It only cares if the mathematics of survival hold up under pressure. When the financial stress arrives — and eventually, for every company, it does — size is vanity. Solvency is sanity.
Section 2: What the Zones Actually Mean
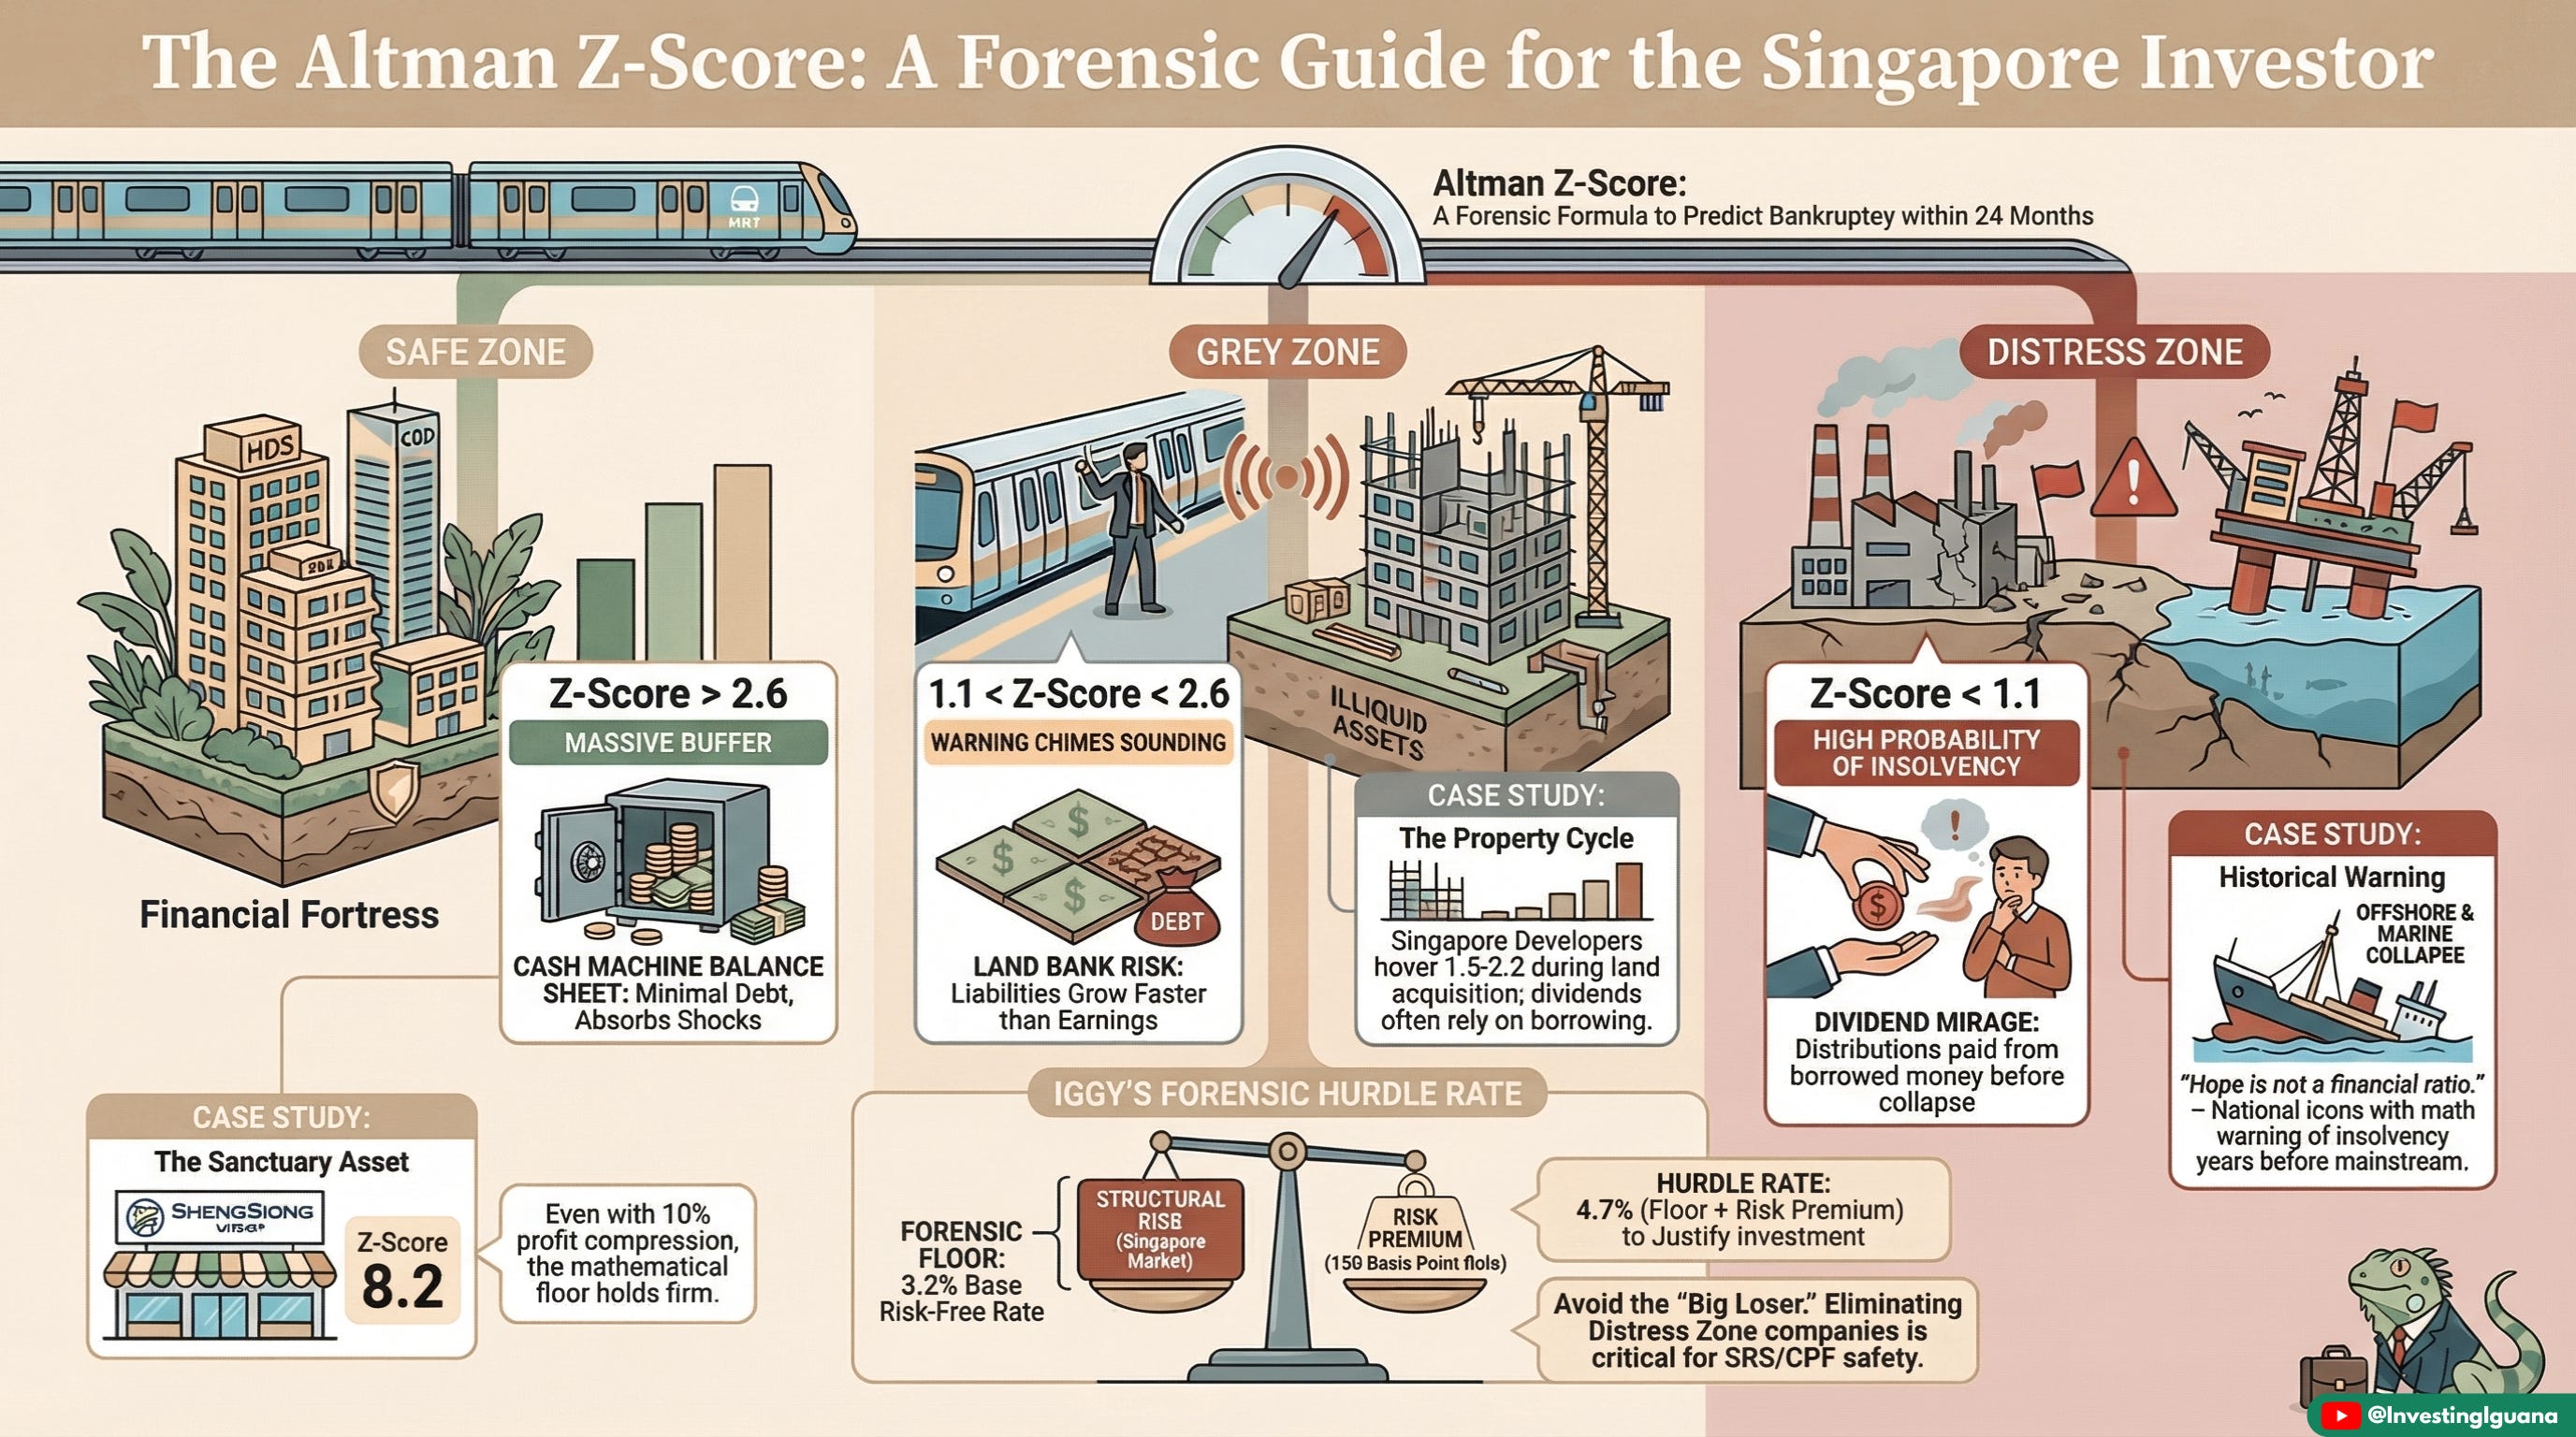
When you plug the numbers into the formula, it spits out a single number. This number dictates which “Zone” the company lives in. Think of this like the MRT Door Paradox. When the train doors open, you are either safely inside the carriage, awkwardly stuck in the platform gap, or left entirely behind on the platform watching the train leave without you.
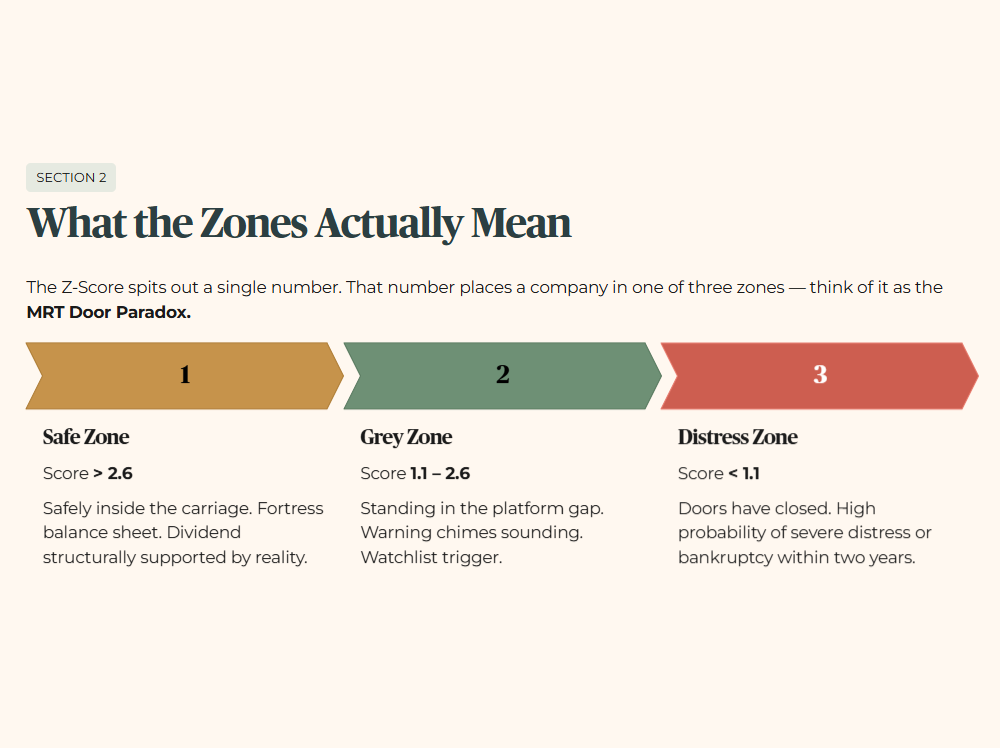
The Safe Zone (Score Above 2.6): This company is sitting comfortably inside the carriage. The balance sheet is a fortress. They have a fat biscuit tin, strong daily cash flow, and manageable debts. If a sudden macroeconomic shock hits—say, a massive spike in supply chain costs or a sudden freeze in consumer spending—this company has the buffer to absorb the hit. Your dividend is structurally supported by reality, not by debt.
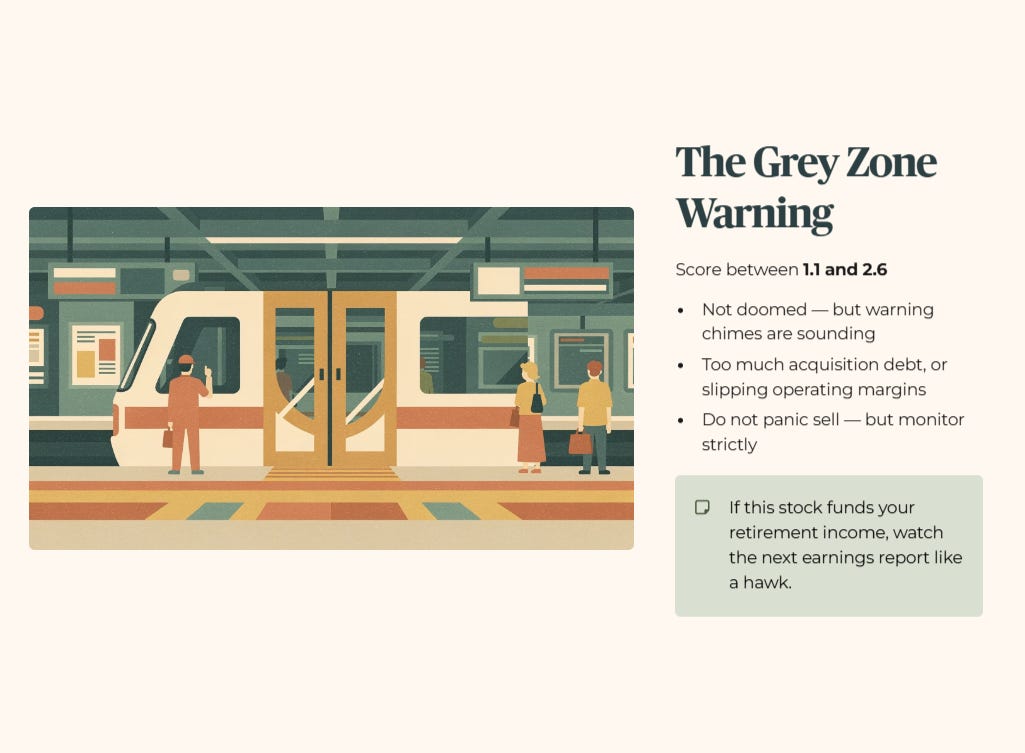
The Grey Zone (Score between 1.1 and 2.6): This company is standing in the MRT platform gap. It is not doomed, but the warning chimes are sounding. A Grey Zone score means the financial health is mediocre. Perhaps they have taken on too much debt recently for an acquisition, or their core operating margins are slipping. This is a watchlist trigger. You do not panic sell, but you put the stock under strict monitoring. If you rely on this stock for your retirement income, a Grey Zone score means you must watch their next earnings report like a hawk.
The Distress Zone (Score Below 1.1): The doors have closed on this company. Statistically, a score below 1.1 indicates a high probability of severe financial distress or bankruptcy within the next two years. If a company in your CPF portfolio falls into this zone, the forensic picture is bleak. The dividend is likely a “Yield Trap”—an artificially high payout masking a declining Net Asset Value.
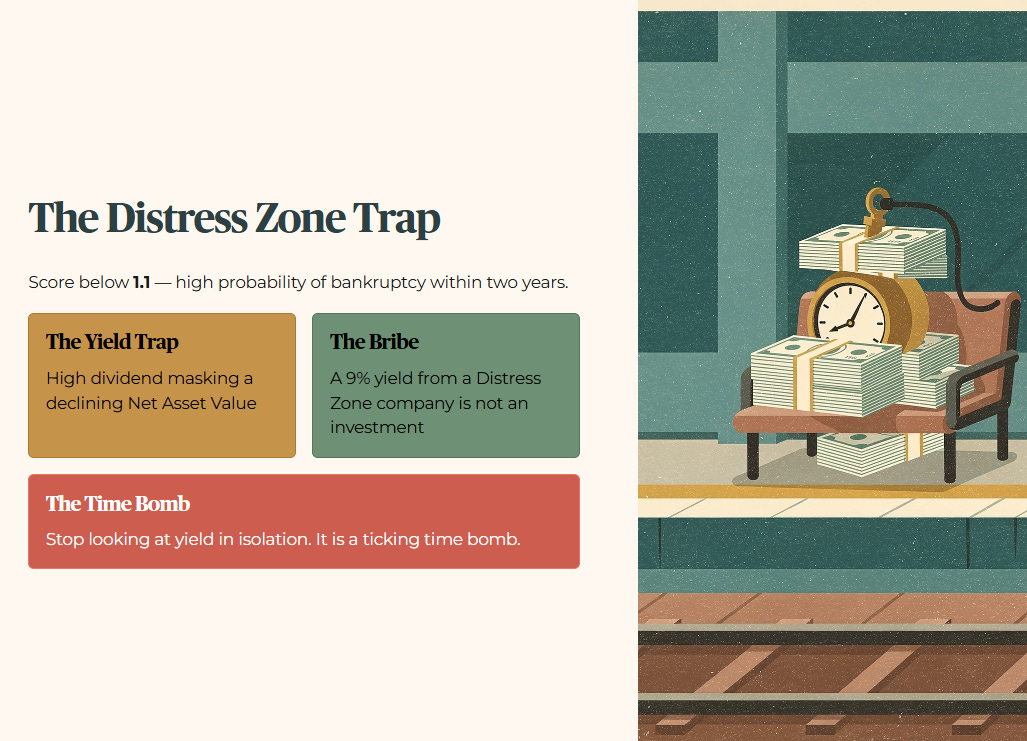
So what does this mean for you? It means you stop looking at the dividend yield in isolation. A 9% yield from a company in the Distress Zone is not an investment; it is a bribe to hold a ticking time bomb.
Section 3: Three SGX Snapshots
Let us put this theory into practice. I am going to run the Z-Score on three illustrative companies from our local exchange.
Strategic Stance: These are forensic illustrations based on my personal tracking. This is not a recommendation to buy, sell, or hold any security. We are simply lifting the hood to see how the engine runs.
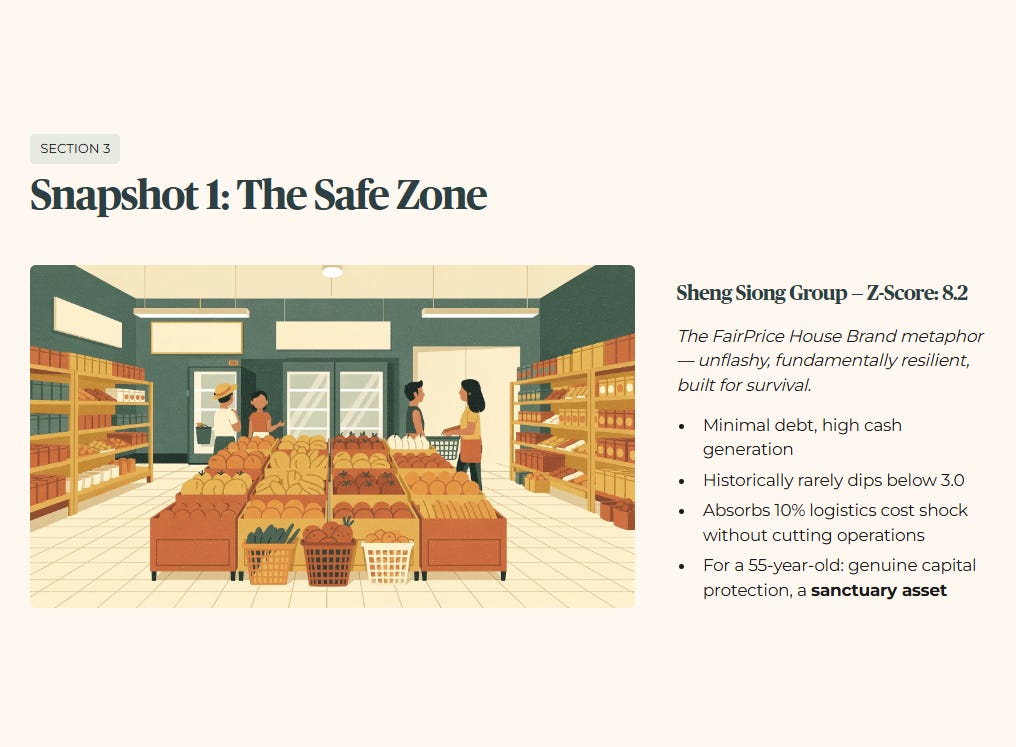
Snapshot 1: The Safe Zone Illustration (Sheng Siong Group)
When we run the Z-Score on a defensive consumer staple like Sheng Siong, the forensic picture looks like this. It is the FairPrice House Brand metaphor in action—unflashy, fundamentally resilient, and built for survival.
Layer 1 (Raw Fact): The company operates with minimal debt and high cash generation, yielding a Z-Score comfortably above 4.0 (Sheng Siong’s latest twelve months altman z-score is 8.2).
Layer 2 (Historical Benchmark): Historically, their score rarely dips below the 3.0 mark, indicating consistent financial discipline.
Layer 3 (Peer Context): Compared to regional retail peers carrying heavy expansion debt, they maintain a distinctly conservative posture.
Layer 4 (Forward Scenario): If we stress-test a 10% macro shift in logistics costs, the high X1X_1 X1 (working capital) means they absorb the shock without cutting operations.
Layer 5 (Wallet Impact): For a 55-year-old holding this for dividends, the capital protection is genuine. It acts as a sanctuary asset during volatility.
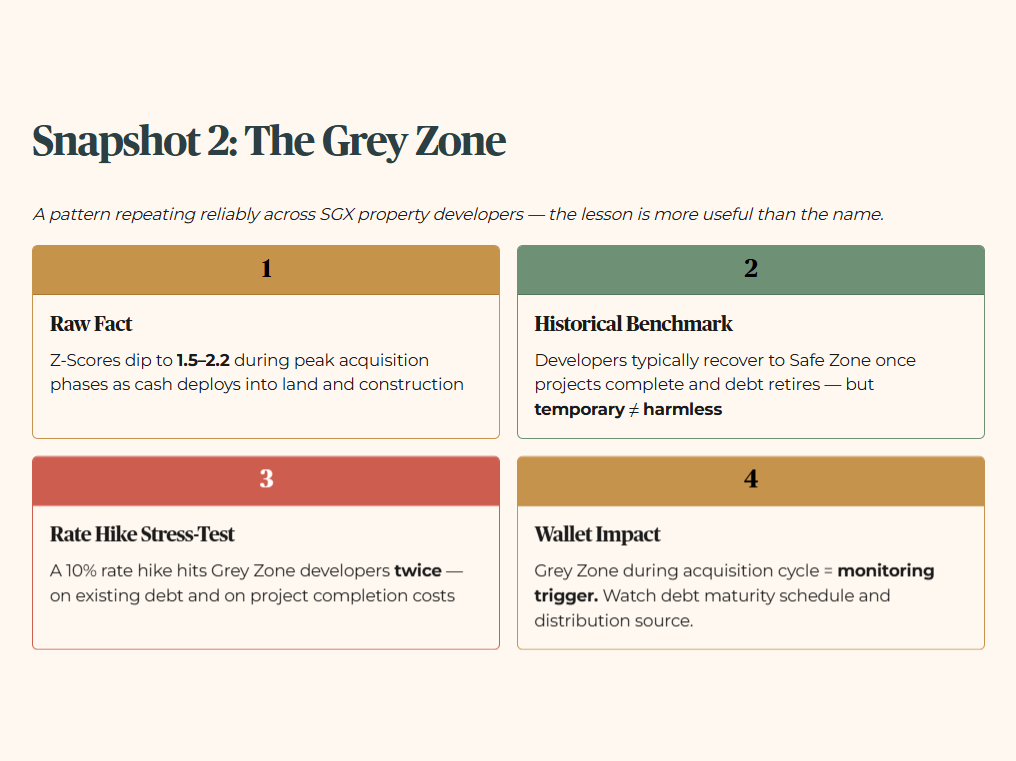
Snapshot 2: The Grey Zone Illustration (The Debt-Heavy Developer)
For the Grey Zone, rather than pinning this to a single ticker, let us look at a pattern that repeats itself reliably across the SGX property development sector — because the lesson is more useful than the name.
When a developer goes on an acquisition run — snapping up land banks, launching new projects across multiple markets, or buying out joint venture partners — their balance sheet transforms almost overnight. The asset base swells, but so does the debt. Working capital tightens because cash is being deployed faster than projects can be completed and sold. Retained earnings, while real, are being recycled straight back into the next land bid rather than sitting in the biscuit tin.
The result is a Z-Score that typically hovers between 1.5 and 2.2 — firmly in the Grey Zone — not because the business is failing, but because it is stretched. The stall owner has borrowed to open three new outlets simultaneously. The wok is still roaring, but the loan repayments are due every month regardless of whether the new outlets find their footing.
Layer 1 (Raw Fact): Working capital ratios compress during active development cycles as cash is deployed into land and construction. Z-Scores for SGX-listed developers have historically dipped into the 1.5–2.2 range during peak acquisition phases.
Layer 2 (Historical Benchmark): The same developers typically recover toward the Safe Zone once projects are completed, units are sold, and debt is retired. The Grey Zone is often temporary — but temporary does not mean harmless.
Layer 3 (Peer Context): Regional developers carrying cross-border exposure — China, Australia, UK — carry additional currency and demand risk that the Z-Score does not fully capture. The headline score can look manageable while the underlying geography is quietly deteriorating.
Layer 4 (Forward Scenario): A 10% rate hike stress-test during an active development cycle is where Grey Zone developers get into trouble. Rising financing costs hit them twice — once on existing debt, and again on the cost of completing projects already under construction.
Layer 5 (Wallet Impact): For a 55-year-old holding a property developer for dividend income, a Grey Zone score during an acquisition cycle is not an automatic sell signal. It is a monitoring trigger. Watch the debt maturity schedule. Watch whether distributions are being maintained from operating cash flow or quietly supported by asset recycling.
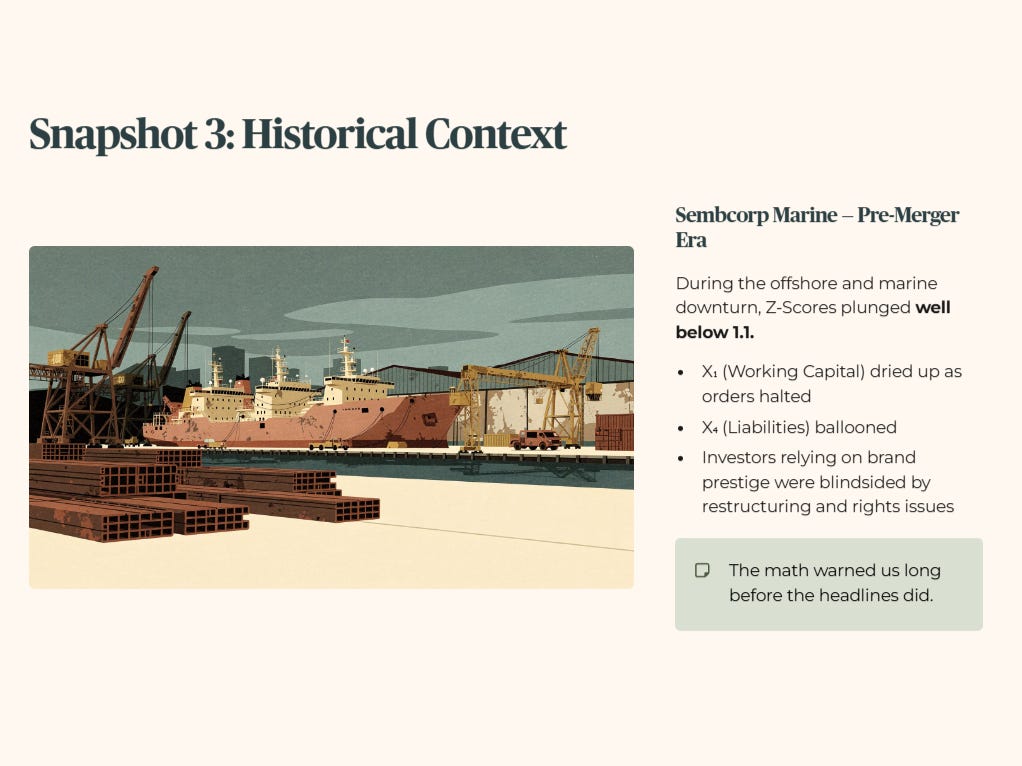
Snapshot 3: Historical Context (Sembcorp Marine, Pre-Merger Era)
For our third illustration, let’s look at a historical example—not a current call, but a textbook case of past distress. Years ago, during the offshore and marine downturn, companies in this sector saw their Z-Scores plunge well below 1.1. Their X1X_1 X1 (Working Capital) dried up as orders halted, and their X4X_4 X4 (Liabilities) ballooned. Investors who only looked at the historical prestige of the brand were caught entirely off guard when the restructuring and massive rights issues inevitably hit. The math warned us long before the headlines did.
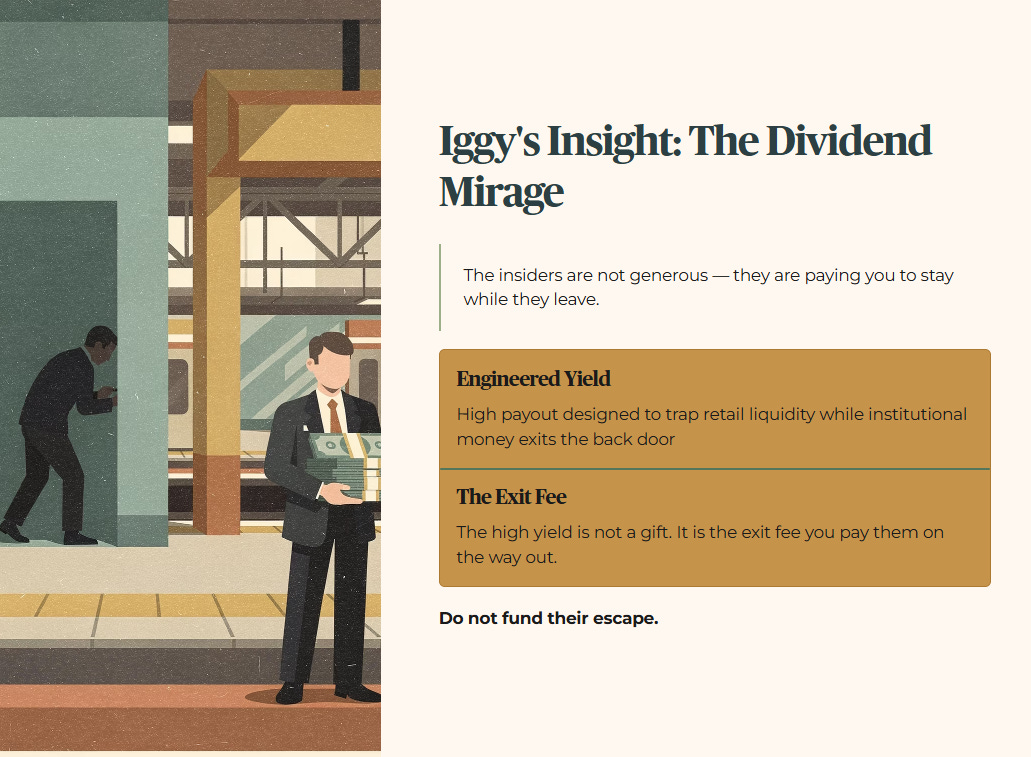
Iggy’s Insight: The Dividend Mirage The most dangerous trap in retail investing is buying a stock solely because the dividend yield is double digits. It feels like free money — the quarterly payout arrives, you see the number in your account, and every instinct says “this is working.” But if a company is sitting deep in the Distress Zone, that dividend is not a reward. It is an Engineered Yield — a mechanism designed to trap retail liquidity while institutional money quietly exits the back door. The insiders are not generous; they are paying you to stay while they leave. The high yield is not a gift. It is the exit fee you pay them on the way out. Do not fund their escape.
Section 4: The REIT Exception
Now, we must address the massive elephant in the room. Singaporean investors love Real Estate Investment Trusts (REITs). They are the cornerstone of our retirement portfolios. But if you run an Altman Z-Score on almost any REIT on the SGX, the formula will scream “DISTRESS ZONE!” and tell you the sky is falling.
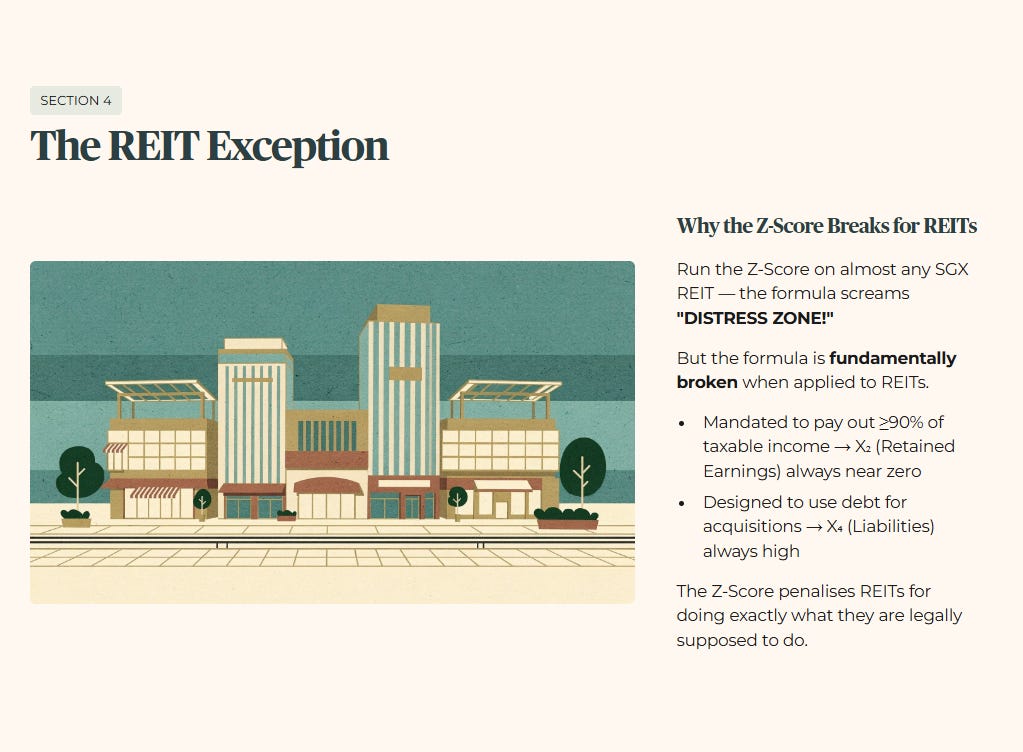
Why? Because the formula is fundamentally broken when applied to REITs.
REITs carry structural leverage by design. They are mandated by law to pay out at least 90% of their taxable income to unit holders to enjoy tax transparency. This means their X2X_2 X2 (Retained Earnings) will always be artificially near zero. They are also designed to use debt to acquire properties, meaning their X4X_4 X4 (Liabilities) will always be high. The Z-Score penalises them mechanically for doing exactly what they are legally supposed to do.
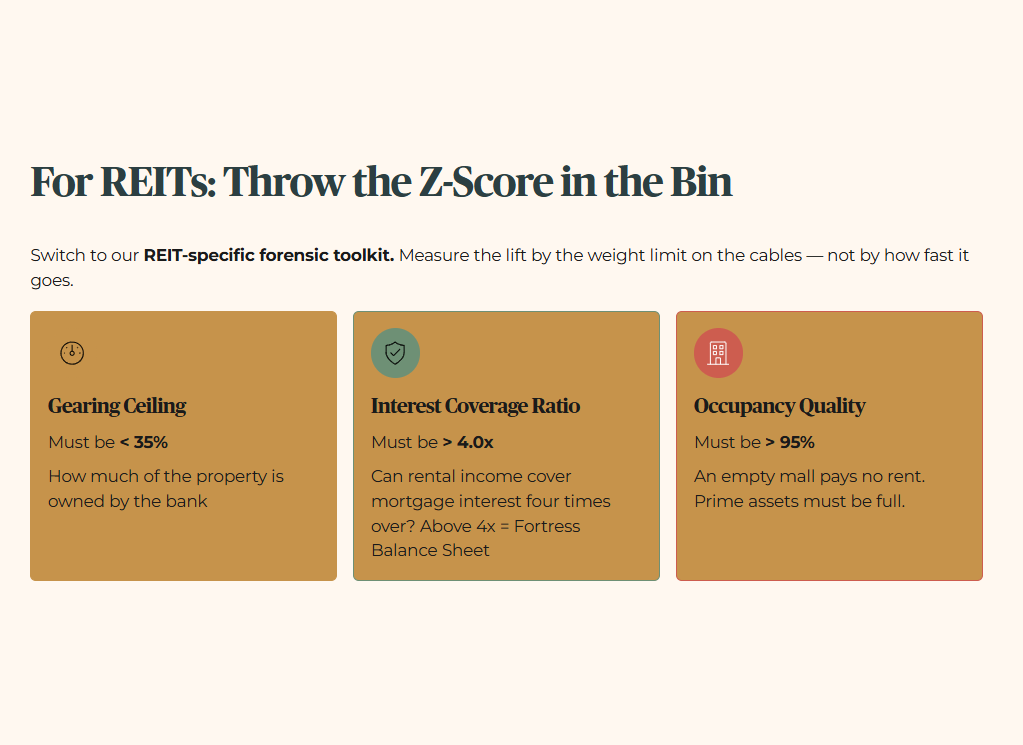
If you are looking at a REIT, throw the Z-Score in the bin. You must switch to our REIT-specific forensic toolkit. Think of this as the HDB Lift Upgrade—you do not measure a lift’s safety by how fast it goes, you measure it by the weight limit on the cables.
Furthermore, when evaluating any yield, remember our minimum standards. The asset must yield ≥150bps above our Iggy Forensic Floor of 3.2%. This gives us an absolute minimum yield hurdle of 4.7%.
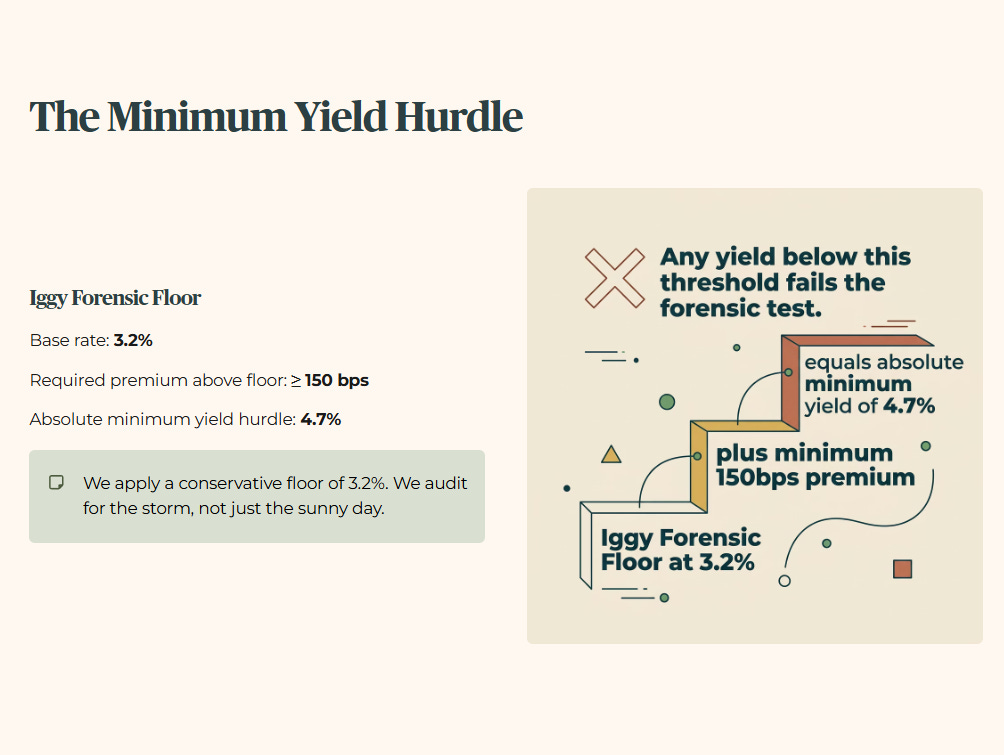
Note on the Stress-Test Buffer: For this audit, I apply a conservative floor of 3.2%. We audit for the storm, not just the sunny day.
Section 5: How To Run This Yourself
You do not need to sit at your dining table with a calculator and a stack of annual reports to figure this out. We use tools to do the heavy lifting. I rely on InvestingPro to automatically surface the Z-Score data, stress-test the balance sheets, and map out the Fair Value estimates. It pulls the raw data directly from the filings, so we avoid manual entry errors.
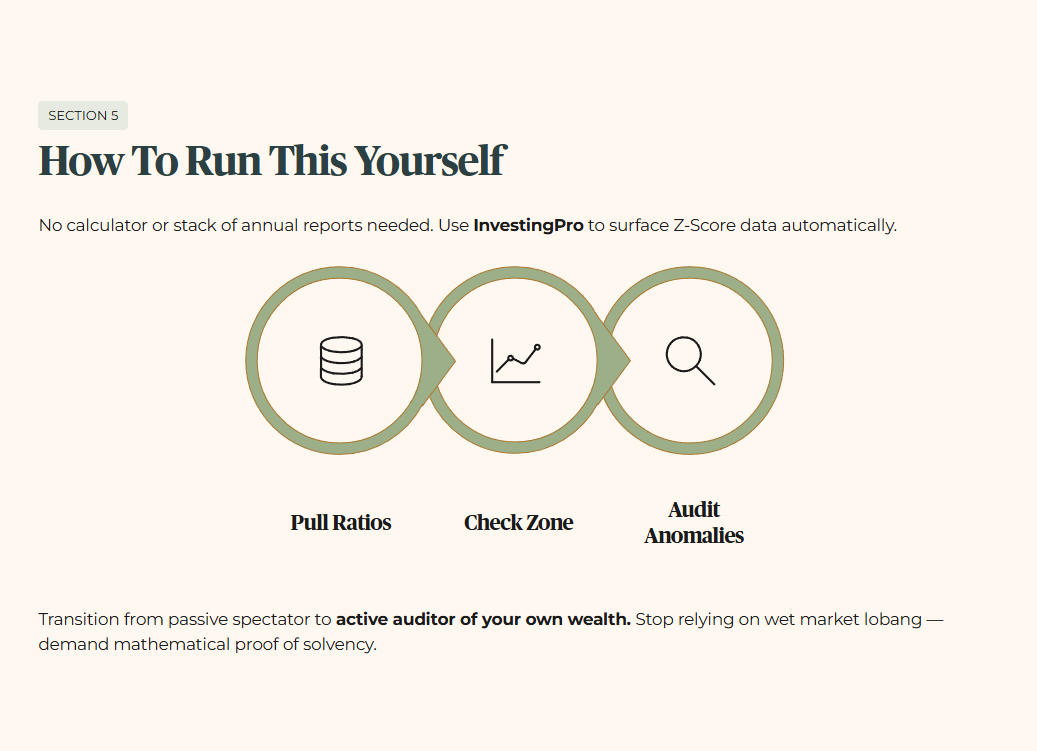
Here is the practical workflow for your own portfolio:
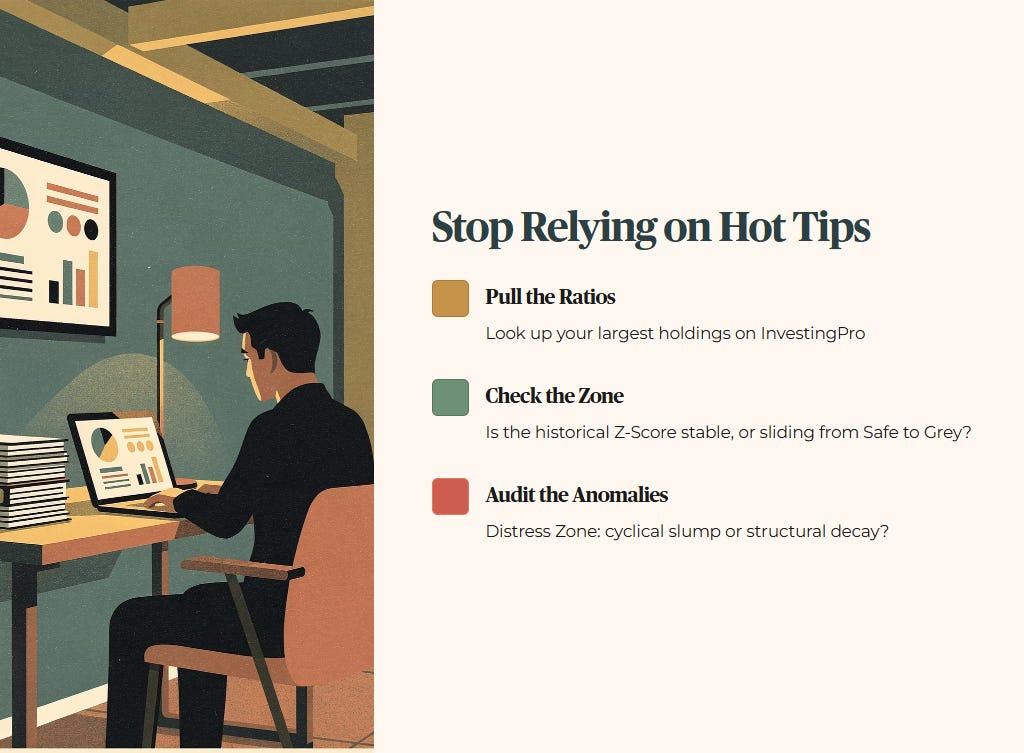
Pull the Ratios: Look up your largest holdings on InvestingPro.
Check the Zone: Look at the historical Z-Score trend. Is it stable, or has it been sliding from the Safe Zone into the Grey Zone over the last three quarters?
Audit the Anomalies: If a stock is in the Distress Zone, ask yourself why. Is it a cyclical slump, or structural decay?
So what does this mean for you? It means you transition from a passive spectator to an active auditor of your own wealth. You stop relying on hot tips from the wet market lobang and start demanding mathematical proof of solvency.
📊 This analysis is brought to you by Longbridge SG.
Fixing the analysis is the easy part. Fixing the execution requires the right tools.
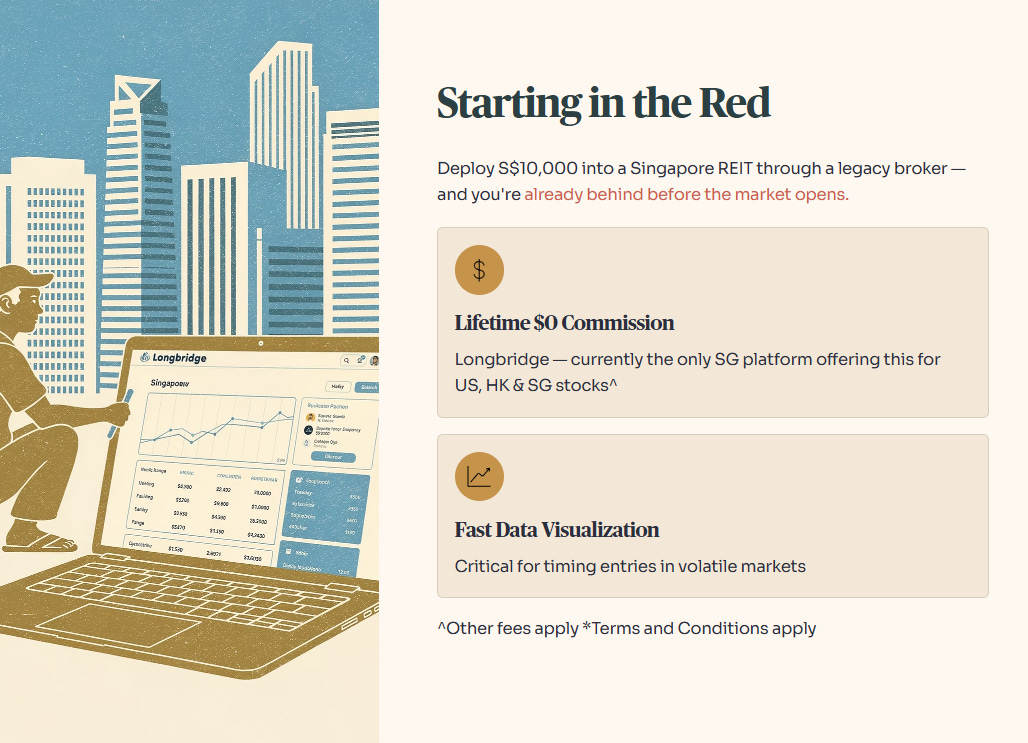
I’ve shifted my own deployment to for one forensic reason: they are currently the only platform in Singapore offering Lifetime S$0 Commission on US, HK, and SG stocks. For a DCA investor running monthly tranches, that single change eliminates the entire minimum commission drag we just calculated. Their data visualisation is also fast enough for volatile entry windows — which matters when you are trying to time a position, not just place one.
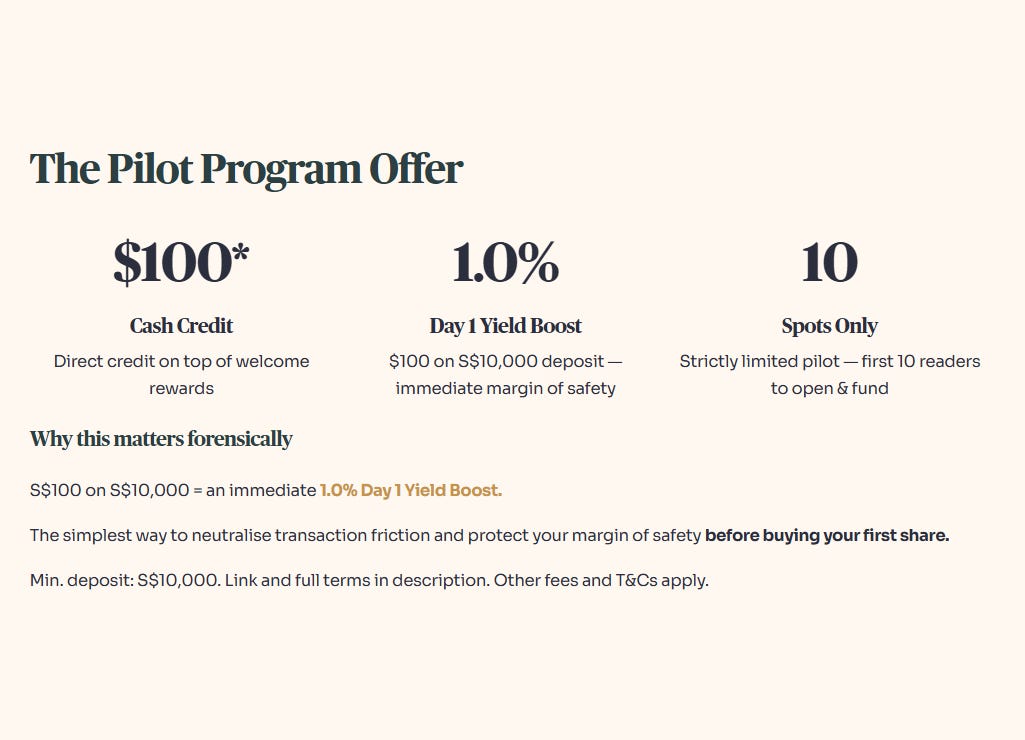
I’ve partnered with Longbridge on a specific pilot for this community. The first 10 readers to open and fund an account with a minimum of S$10,000 will receive a direct S$100 cash credit.
The forensic math: S$100 on a S$10,000 deployment is a 1.0% Day 1 Yield Boost — effectively neutralising your entry cost before you’ve bought a single share. For context, that’s better than the yield spread on several SGX blue chips I’ve reviewed this quarter.
This is strictly limited to 10 spots. Full terms and conditions are linked below — read them before committing, as standard platform fees apply.
Iggy’s Bottom Line
The Altman Z-Score is not a magic wand that tells you exactly when a stock will crash; it is a clinical distress early-warning system that strips away corporate marketing to reveal structural rot.
For a 55-year-old investor managing crucial CPF funds, relying purely on dividend history without checking the underlying solvency is financial negligence. Audit your holdings, respect the mathematical zones, and remember that protecting your capital from permanent loss is always more important than chasing a fragile yield.
“Great investors don’t guess; they follow a system.” .....
Consider this infographic your instant blueprint. I’ve distilled hours of research into a single visual workflow to help you make smarter decisions in seconds. Print it out and keep it near your trading desk.

Iggy’s Forensic Compliance Standards — Standard Disclaimer
This content is produced for educational and informational purposes only. I am not a financial advisor — I am a retail investor who applies forensic analysis to my own portfolio and shares that process publicly. Nothing here constitutes a recommendation to buy, sell, or hold any security, and no specific target prices or personalised financial advice are offered. All data is sourced from public filings and verified sources; where data is unverified it is explicitly flagged. All investments carry risk, including the potential loss of principal, and past performance is not indicative of future results. If you are making investment decisions involving CPF, SRS, or personal capital, please conduct your own due diligence or consult a MAS-licensed financial adviser before committing funds.
Important Partner Disclosure
This content is a paid collaboration with Longbridge Singapore. It is intended for general awareness and does not constitute investment advice or a recommendation for any specific financial product.
Licensing Note: The presenter is not a licensed financial adviser. Views expressed are solely those of the presenter and do not necessarily reflect the position of Longbridge Singapore. Investments involve risk; you may lose your principal. This advertisement has not been reviewed by the Monetary Authority of Singapore. Always seek independent professional advice if unsure.