This Week's Best Stock Was a Forensic Red Flag, Iggy's Weekly Winners & Losers | EP1665
A 16% weekly gain, a Zone 5 verdict, and the cash flow number behind it. Plus First Resources, SATS, Frencken, and the REIT that fell for no reason anyone can find.

The market rally this week has pushed the Straits Times Index to historic heights, but beneath this green surface lies a stark divergence between share price momentum and actual balance sheet realities. For heartland savers anchoring their retirement portfolios in dividend income, celebrating nominal price gains without scrutinising underlying cash flow is a dangerous strategy.


The Macro Pulse
This Week’s Forensic Movers, The Gainers
Gainers Dashboard
This Week’s Forensic Warnings, The Losers
Losers Dashboard
The Forensic Yield Spread Monitor
The Macro Connector
Iggy’s Weekly Verdict
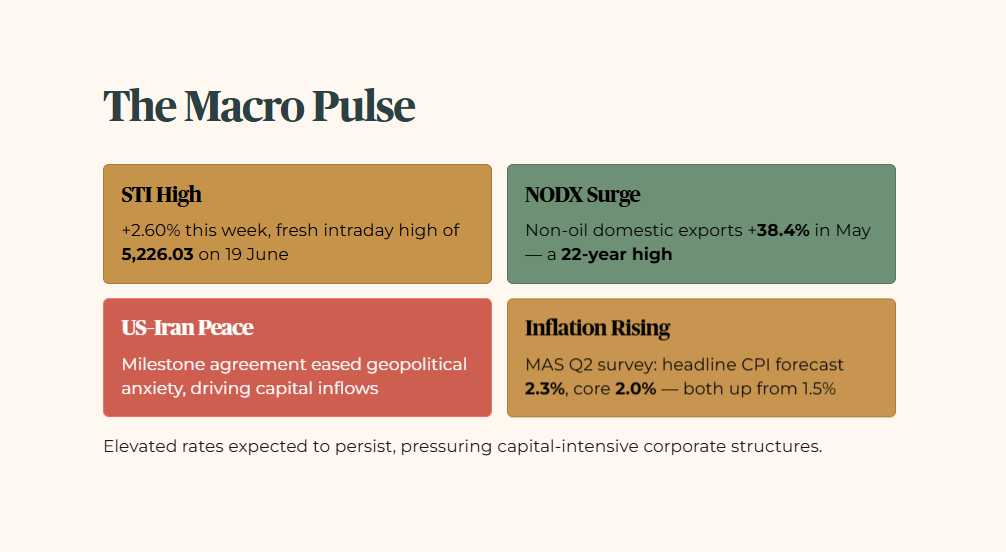
The Macro Pulse
The Straits Times Index rose 2.60 percent this week, touching a fresh intraday historical high of 5,226.03 on June 19. This local equity expansion was heavily supported by regional macroeconomic indicators, with Singapore non-oil domestic exports growing 38.4 percent in May to mark a 22-year high. The primary driver of this market direction was a milestone peace agreement between the United States and Iran, which eased global geopolitical anxieties and triggered capital inflows into regional indices. However, the latest Monetary Authority of Singapore Q2 2026 Survey of Professional Forecasters showed economists raising full-year median headline inflation projections sharply to 2.3 percent, with core inflation expectations climbing to 2.0 percent. With both figures up from 1.5 percent in the March survey, the domestic interest rate environment is expected to remain elevated for longer, placing immediate pressure on capital-intensive corporate structures.
This Week’s Forensic Movers, The Gainers
Featured Gainer: CSE Global (544)
Layer 1: Raw Fact
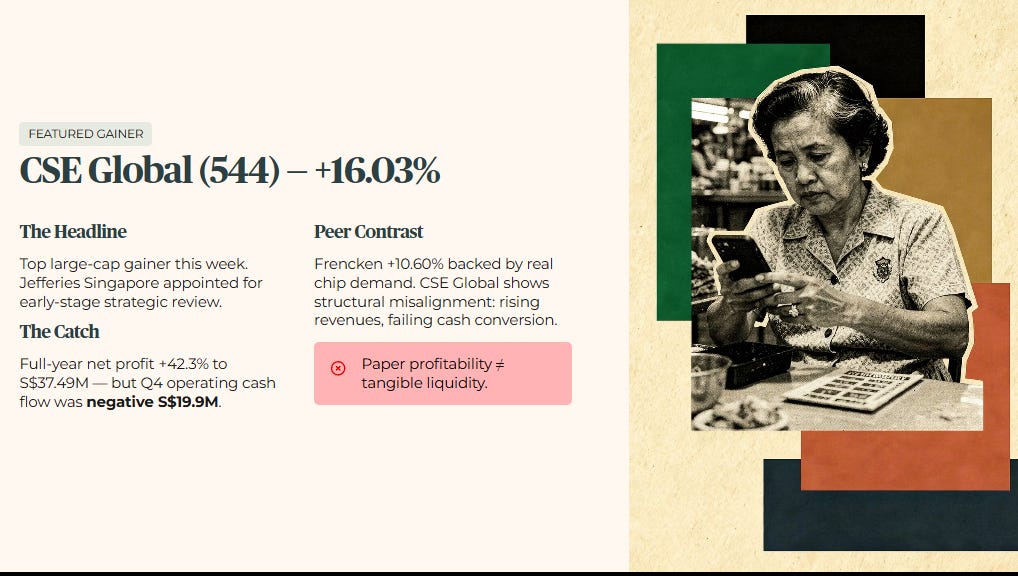
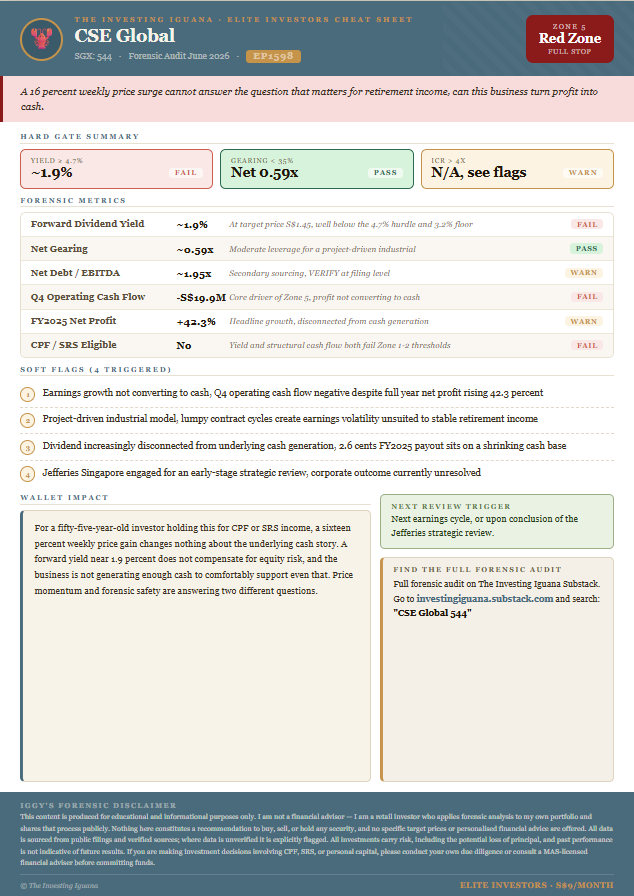
CSE Global posted a weekly share price increase of 16.03 percent, closing as the top gainer among large-cap Singapore counters while simultaneously appointing Jefferies Singapore to conduct an early-stage strategic review of corporate options.
Layer 2: Historical Benchmark
This price surge sits in sharp opposition to historical cash conversion benchmarks for the business, where the three-year historical average shows project-driven cyclicality. While full-year net profit rose 42.3 percent to S$37.49 million, fourth-quarter operating cash flow dropped to negative S$19.9 million, indicating that paper profitability is failing to translate into tangible liquidity.
Layer 3: Peer Context
Comparing this cash conversion mismatch against an engineering and industrial peer like Frencken Group reveals a significant divergence in financial health. Frencken managed a 10.60 percent price increase backed by cyclical chip demand, whereas CSE Global exhibits structural misalignment where rising revenues fail to support healthy operational cash flows.
Layer 4: Forward Scenario
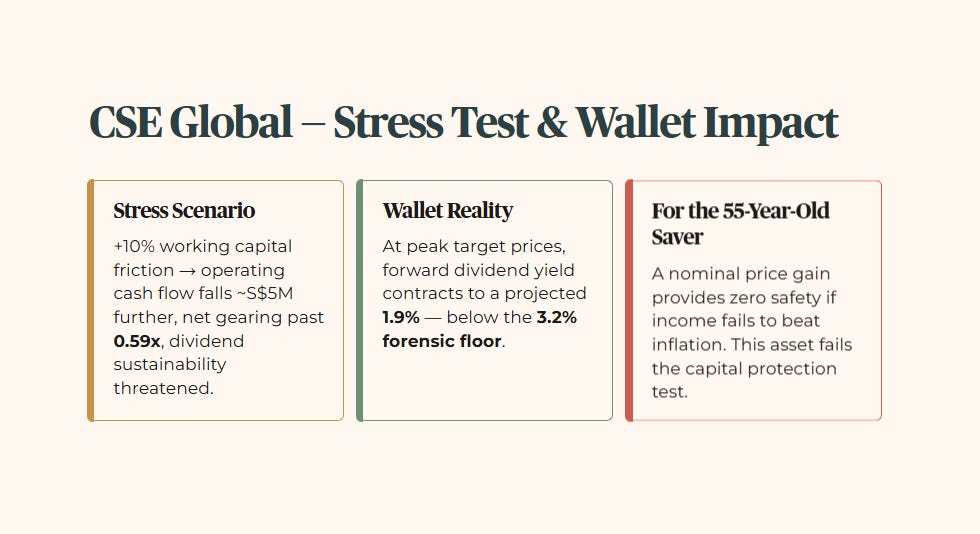
A stress-test scenario involving a 10 percent increase in working capital friction, triggered by a prolonged global supply chain slowdown, would reduce operating cash flow by an estimated S$5 million further. This would widen the deficit, forcing the company to draw down on its credit lines, pushing net gearing past the current 0.59x level and threatening the sustainability of its dividend distributions.
Layer 5: Wallet Impact
For a fifty-five-year-old heartland investor counting on stable quarterly income, a nominal price gain provides zero safety if the forward dividend yield contracts to a projected 1.9 percent at peak target prices. Accepting equity volatility for a return that falls below the 3.2 percent forensic floor means this asset fails to protect personal capital against inflation.

Iggy’s Forensic Zone: Zone 5, Red Zone.
This is the clearest lesson of the week. A sixteen percent weekly gain and a Zone 5 verdict are not in conflict, they are answering two different questions. The price tells you what the market thinks might happen if the strategic review unlocks value. The zone tells you whether the underlying business currently generates enough cash to pay you reliably while you wait and find out. For a retirement income portfolio, only the second question matters. Chasing this momentum without structural cash flow support exposes retail capital to sudden distribution corrections.
Remaining Gainers
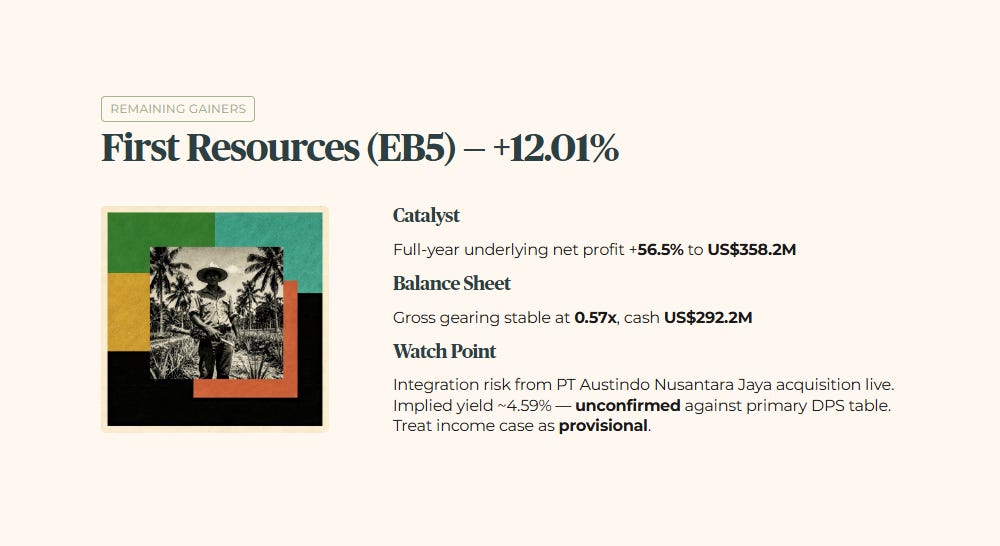
First Resources (EB5): The counter advanced 12.01 percent on the back of full-year underlying net profit rising 56.5 percent to US$358.2 million. Forensically, gross gearing remains stable at 0.57x with US$292.2 million in cash balances, though integration risk from the PT Austindo Nusantara Jaya acquisition remains a live factor. The implied dividend yield commonly cited around 4.59 percent could not be confirmed against the primary DPS table this week [VERIFY], so treat any income case here as provisional until that figure locks.
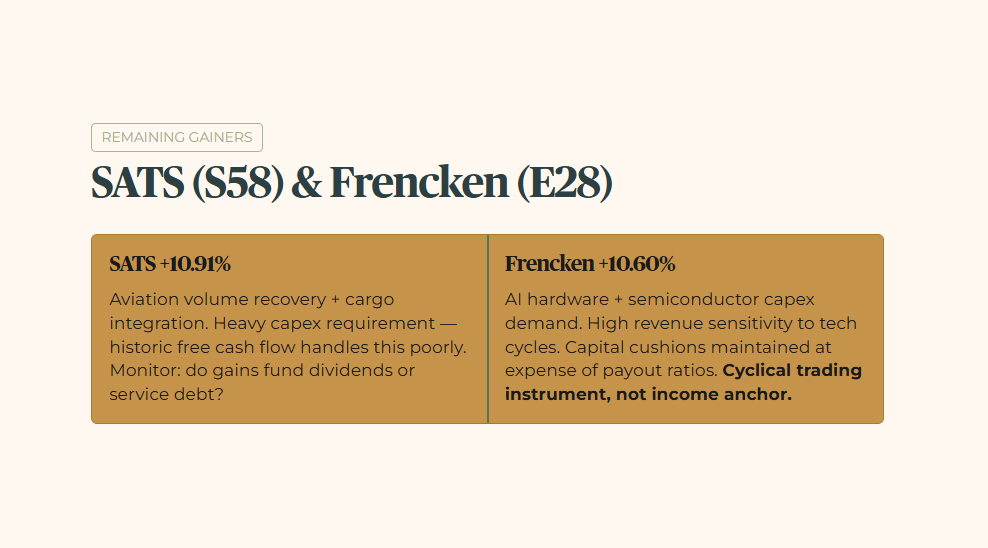
SATS (S58): Share price moved up 10.91 percent following aviation volume recovery and cargo integration metrics. From an auditing stance, this expansion requires heavy capital expenditure that historic free cash flow handles poorly. Heartland portfolios must monitor whether these gains lead to sustained dividend distributions or are absorbed by debt service.
Frencken (E28): Capital appreciation hit 10.60 percent on accelerating global semiconductor capital expenditure and artificial intelligence hardware demand. The forensic reality shows high revenue sensitivity to global tech cycles, meaning capital cushions must be maintained at the expense of high payout ratios. Investors must treat this as a cyclical trading instrument rather than a permanent sanctuary asset for passive income.
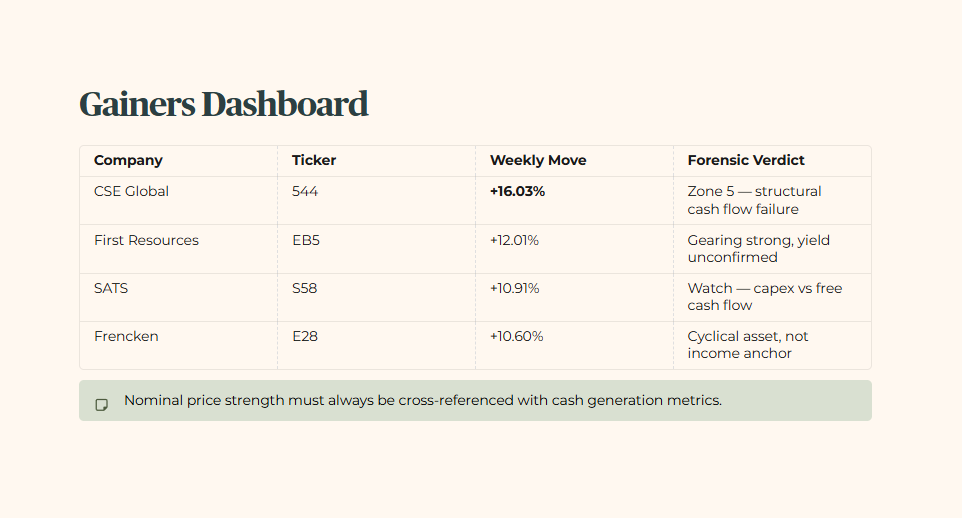
Gainers Dashboard
Nominal price strength must always be cross-referenced with cash generation metrics to separate sustainable turnarounds from temporary momentum traps.
This Week’s Forensic Warnings, The Losers
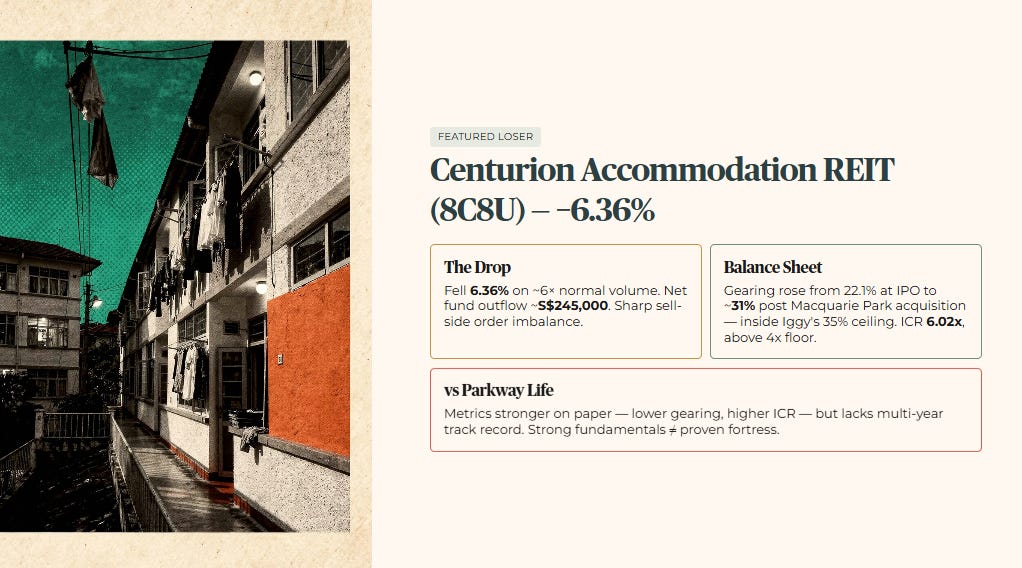
Featured Loser: Centurion Accommodation REIT (8C8U)
Layer 1: Raw Fact
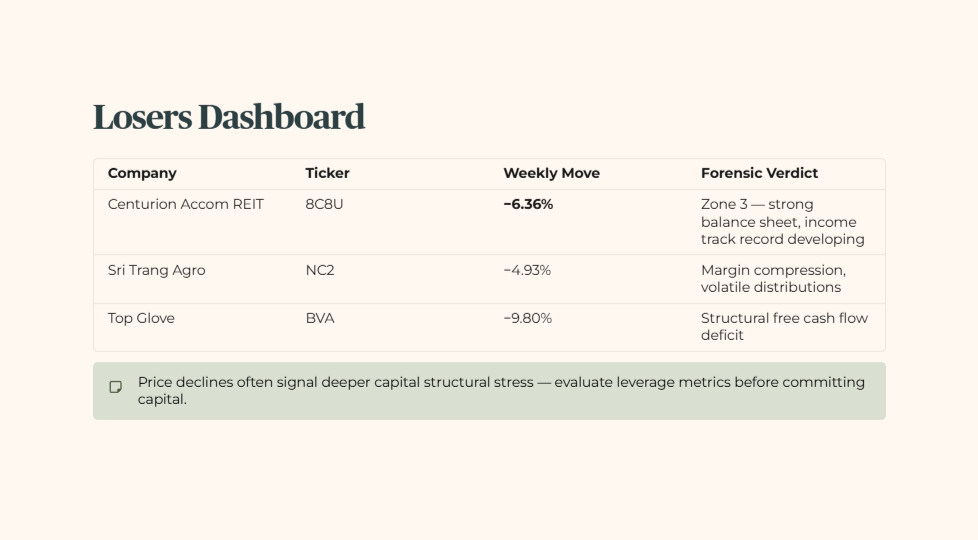
Centurion Accommodation REIT, a specialised living-sector REIT holding purpose-built worker and student accommodation across Singapore, the United Kingdom, and Australia, fell 6.36 percent this week on unusually heavy volume, nearly six times normal turnover, with a sharp sell-side order imbalance and a net fund outflow of approximately S$245,000.
Layer 2: Historical Benchmark
This is a young listing with limited history. Aggregate leverage stepped up from 22.1 percent at IPO to approximately 31 percent following the recent Macquarie Park acquisition in Australia, still comfortably inside Iggy’s 35 percent ceiling. Interest coverage has eased slightly from 6.6x to 6.02x over the same period, well clear of the 4x floor. Revenue, net property income, and distributable income have all come in above IPO forecasts in both reported periods to date.
Layer 3: Peer Context
Against a seasoned sanctuary asset like Parkway Life REIT, which carries a long operating history and structured rental indexation, CAREIT’s balance sheet metrics are actually stronger on paper, lower gearing, higher ICR, but it lacks the multi-year track record that lets Iggy treat a yield figure with full confidence. Strong fundamentals without a long history are not the same as a proven fortress.
Layer 4: Forward Scenario
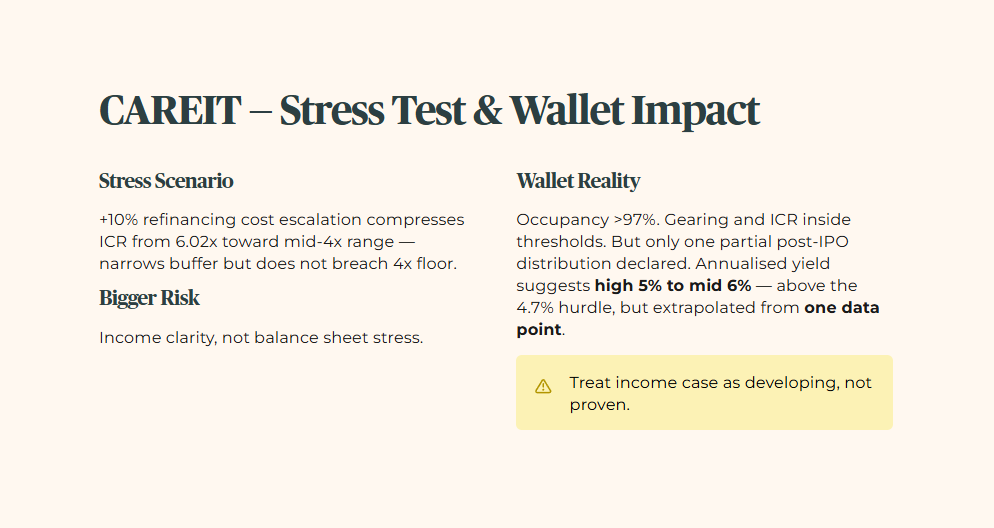
A stress-test scenario applying a 10 percent escalation in refinancing costs, driven by persistent domestic inflation, would compress the interest coverage ratio from 6.02x toward the mid-4x range, narrowing the buffer but not breaching the 4x floor outright. The bigger near-term risk is income clarity rather than balance sheet stress.
Layer 5: Wallet Impact
For an investor allocating SRS capital, the headline numbers look attractive on the surface: occupancy above 97 percent across both worker and student accommodation segments, gearing and ICR both comfortably inside Iggy’s thresholds. But the only declared distribution so far covers a partial post-IPO period. Annualising that figure suggests a yield in the high five to mid six percent range at current prices, which would clear the 4.7 percent hurdle, but this is an extrapolation from one data point, not a confirmed track record. Treat any income case here as developing, not proven.
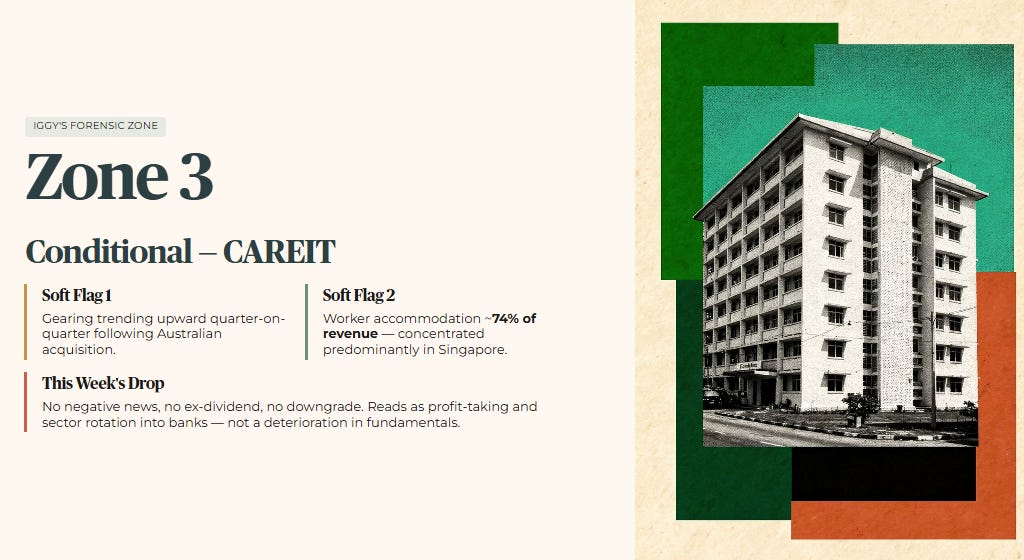
Iggy’s Forensic Zone: Zone 3, Conditional.
Two soft flags keep this at Zone 3 despite genuinely strong hard-gate numbers: gearing is trending upward quarter on quarter following the Australian acquisition, and the worker accommodation segment alone accounts for roughly 74 percent of recent revenue, a likely single-market concentration risk given that segment sits predominantly in Singapore. Neither flag is a red light. Together, they mean this is one more cycle of confirmed distributions away from a stronger zone, not a stock in trouble. This week’s drop shows no negative company news, no ex-dividend explanation, and no downgrade, it reads as profit-taking and sector rotation into banks rather than a deterioration in fundamentals.
Remaining Losers
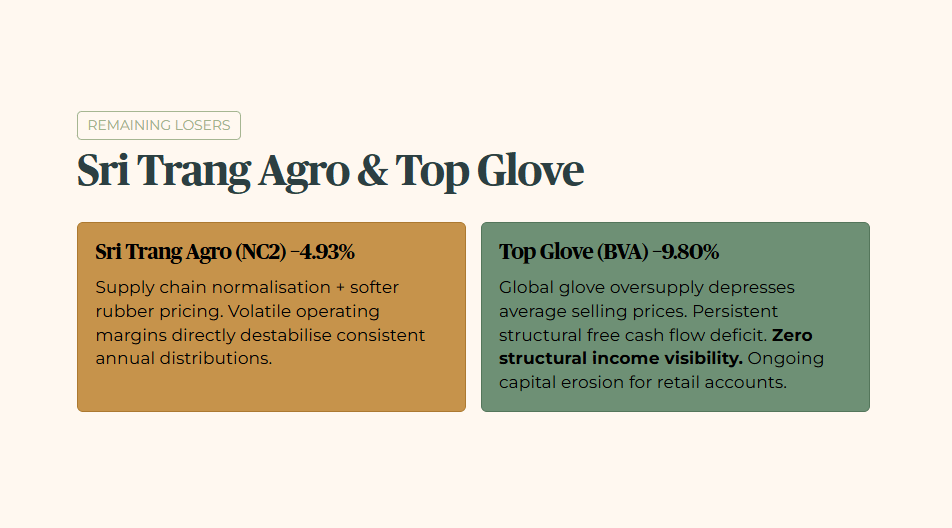
Sri Trang Agro (NC2): The stock declined 4.93 percent due to supply chain normalisation and softer agricultural commodity pricing. Forensically, the balance sheet remains exposed to volatile natural rubber cycles, leading to unpredictable operating margins. Heartland wealth platforms should note that this volatility directly destabilises consistent annual distribution models.
Top Glove (BVA): Share value contracted 9.80 percent as global glove manufacturing oversupply continues to depress average selling prices. The forensic audit shows persistent challenges in restoring positive structural free cash flow across consecutive reporting windows. For retail accounts, this represents ongoing capital erosion with zero structural income visibility.
Losers Dashboard
Price declines often signal deeper capital structural stress, requiring close evaluation of leverage metrics before any capital commitments are made.
The Window Is Already Open
The Window Closes Fast. In this market, the difference between a “Sanctuary” and a “Yield Trap” is decided in a single trading session. By the time this analysis reaches you as a free subscriber, the entry window Iggy identified has already opened — and often closed.
Iggy’s Elite Investors don’t just get the report earlier. They get it when the numbers still matter — zero-day forensic breakdowns, the full “Red Zone” watchlist, and institutional-grade cheatsheets at the moment the setup is live, not after the market has already priced it in.

For S$9/month — less than a kopi and kaya toast set at Raffles Place — you stop being the Exit Liquidity and start being the Analyst.
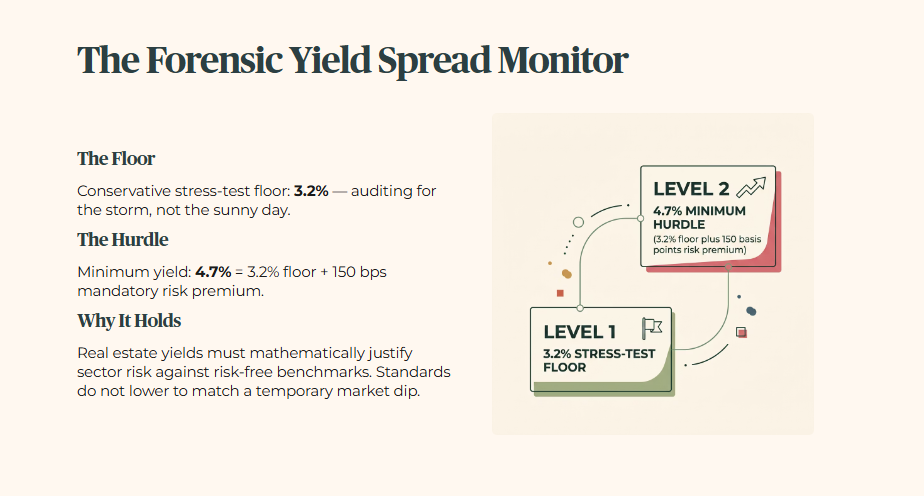
The Forensic Yield Spread Monitor
The relationship between real estate yields and risk-free benchmarks dictates whether sector risk is mathematically justified.
Note on the Stress-Test Buffer: For this audit, I apply a conservative floor of 3.2 percent. We audit for the storm, not just the sunny day. I do not lower my standards to match a temporary market dip. My floor remains at 3.2 percent to ensure sanctuary assets can withstand a return to long-term average interest rates. The minimum yield hurdle is 4.7 percent, that is the 3.2 percent floor plus 150 basis points of mandatory risk premium.
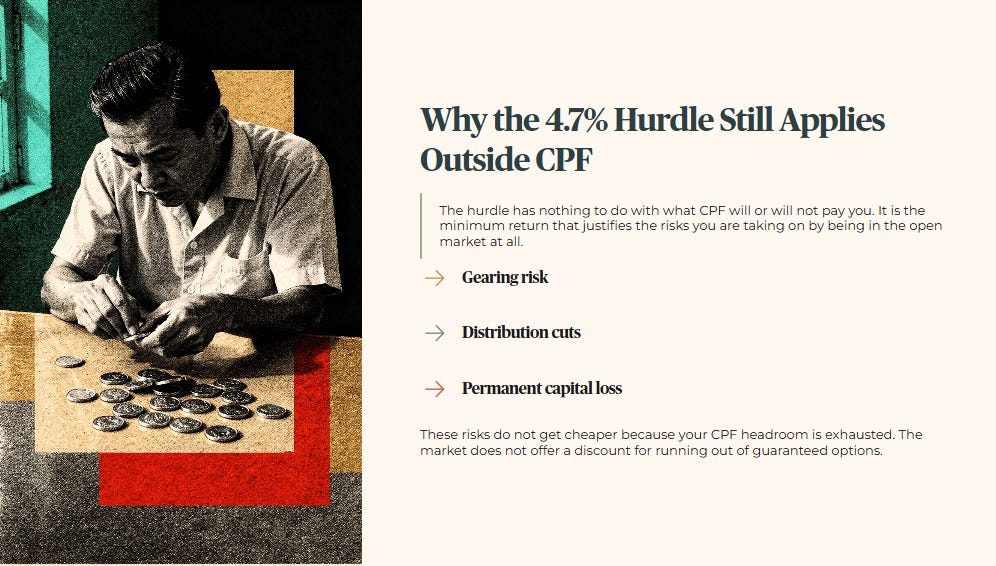
A common question worth addressing directly: if CPF SA is already maxed out, why does the 4.7 percent yield hurdle still apply to the dollars sitting outside the CPF system? The answer is that the hurdle has nothing to do with what CPF will or will not pay you. It is the minimum return that justifies the risks you are taking on by being in the open market at all, gearing risk, distribution cuts, and the possibility of permanent capital loss. Those risks do not get cheaper because your CPF headroom is exhausted. The market does not offer you a discount for running out of guaranteed options.
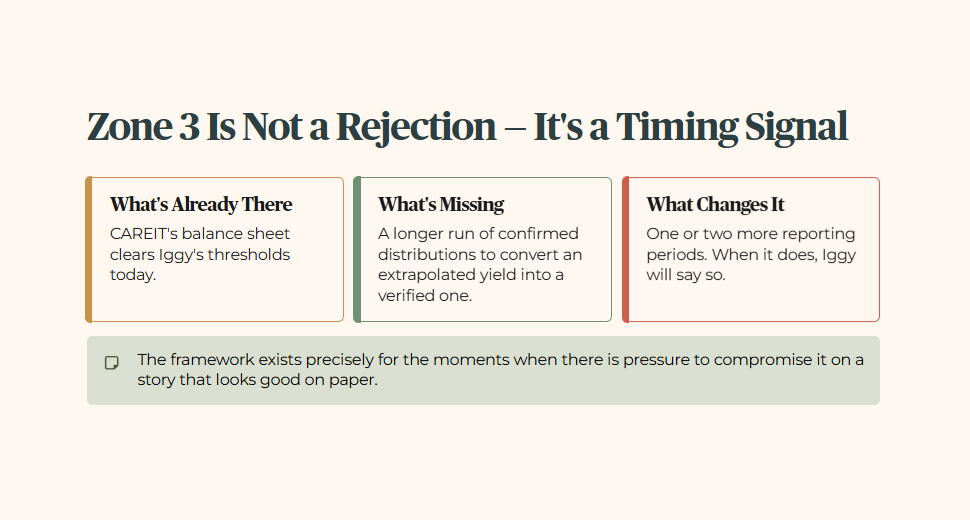
The Zone 3 verdict for Centurion Accom REIT is not a permanent rejection. It is a forensic timing signal. The balance sheet already clears Iggy’s thresholds. What is missing is a longer run of confirmed distributions to convert an extrapolated yield into a verified one. That changes with the next one or two reporting periods. When it does, Iggy will say so. Until then, the framework holds, because the framework exists precisely for the moments when there is pressure to compromise it on a story that looks good on paper.
The Macro Connector
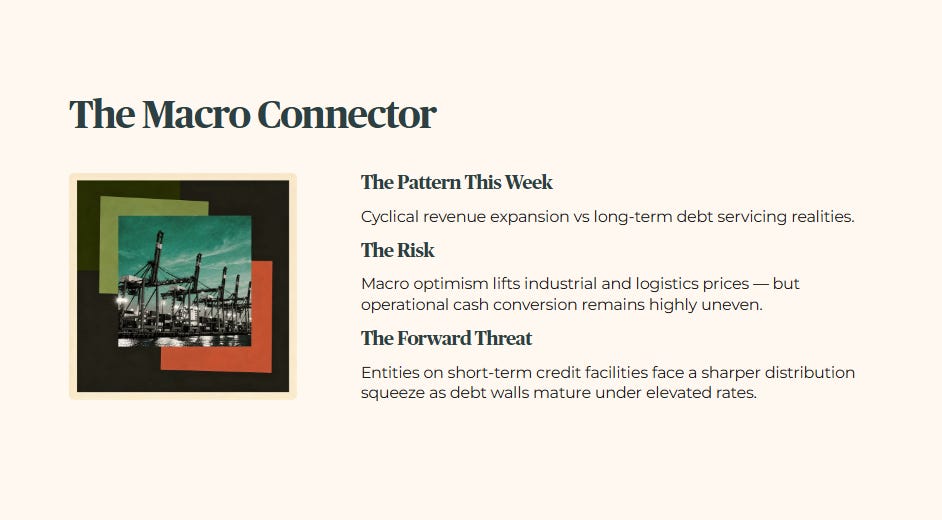
The unifying pattern across this week’s market movers is the clear tension between cyclical revenue expansion and long-term debt servicing realities. While macro optimism around global trade volumes has temporarily driven up industrial and logistics share prices, underlying operational cash conversion remains highly uneven. Companies operating with weak cash generation capability are finding that expanding top-line revenue is insufficient to offset the structural costs of elevated interest rates. This environment creates a forward risk where entities relying on short-term credit facilities face a sharper distribution squeeze as their debt walls mature.
Iggy’s Weekly Verdict
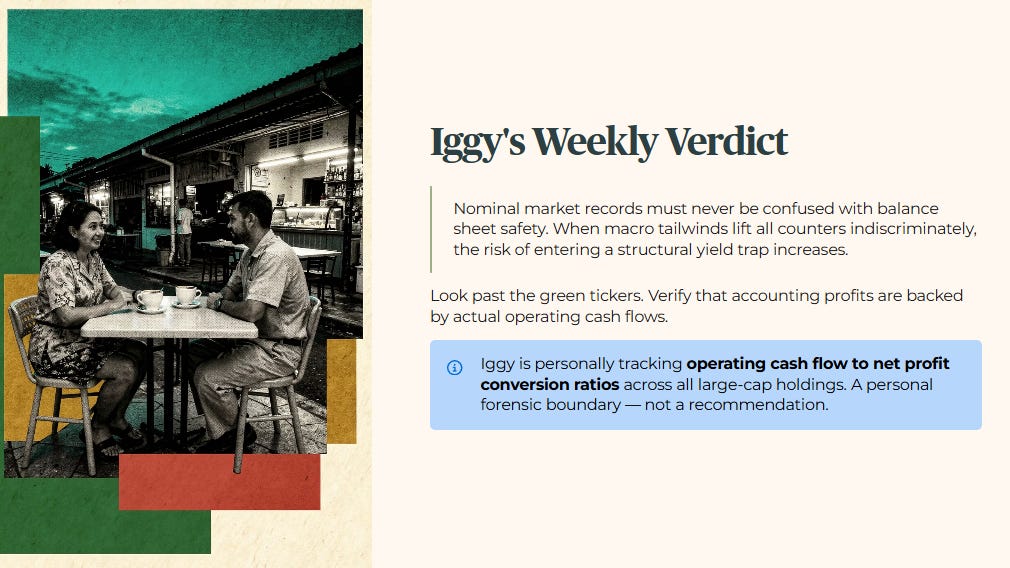
The most vital takeaway for a retail income investor this week is that nominal market records must never be confused with balance sheet safety. When macro tailwinds lift all counters indiscriminately, the risk of entering a structural yield trap increases. We must look past the green daily tickers to verify that accounting profits are backed by actual operating cash flows. This directly connects to the active Private Credit Gating Crisis thesis in the Iggy Operational Log, where structural liquidity constraints continue to shadow leveraged structures.
For my own portfolio construction, I am tracking operating cash flow to net profit conversion ratios across all large-cap corporate holdings. This is a personal forensic boundary, not a recommendation.
YOUR FORENSIC VERDICT, ONE PAGE.
The full audit is above. This is the Iggy Forensic Audit distilled to one A4 page — every number that matters, every flag that triggered, one clear verdict. Save it, print it, pull it out when this stock crosses your radar again, or when you need to refer to these data points for your retirement planning.

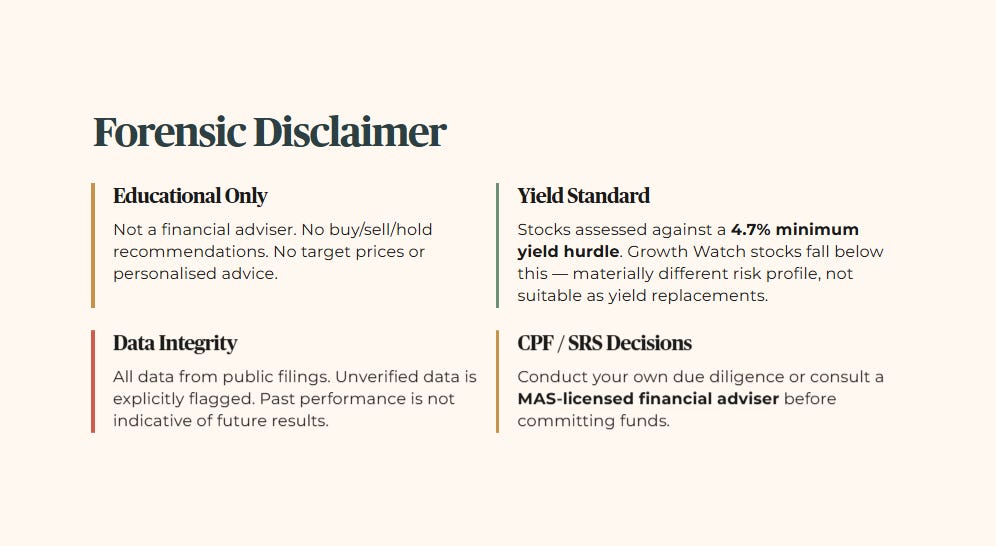
Iggy’s Forensic Disclaimer
This content is produced for educational and informational purposes only. I am not a financial advisor — I am a retail investor who applies forensic analysis to my own portfolio and shares that process publicly. Nothing here constitutes a recommendation to buy, sell, or hold any security, and no specific target prices or personalised financial advice are offered. Stocks assessed under Iggy’s Forensic Yield Standard are benchmarked against a 4.7% minimum yield hurdle; stocks flagged as Growth Watch fall below this threshold but demonstrate clean balance sheet metrics and an identifiable growth catalyst — these carry a materially different risk profile and are not suitable as yield replacements for income-dependent investors. All data is sourced from public filings and verified sources; where data is unverified it is explicitly flagged. All investments carry risk, including the potential loss of principal, and past performance is not indicative of future results. If you are making investment decisions involving CPF, SRS, or personal capital, please conduct your own due diligence or consult a MAS-licensed financial adviser before committing funds.