

UI Boustead REIT: Is This 7.4% High-Yield Industrial REIT a Day-One Leverage Trap? | EP1644
One Hard Gate Failure That Three Brokers Chose to Ignore: 8.7% Yield, 36.5% Gearing — Only One Number Matters


UI Boustead REIT: The Truth Behind Maybank’s Aggressive Buy Call on This 8.7% Yield | EP1644
I am Iggy, forensic investor, ranked eighth on Tiger Brokers among Singapore retail investors, and your guide through the SGX market jungle. UI Boustead REIT is a newly listed name that came to my attention when Maybank initiated coverage with an aggressive analyst rating.
When a fresh REIT lands on the mainboard and a major broker immediately puts a buy call on it, that is exactly the kind of moment that deserves a proper forensic audit before any retirement capital moves.

In This Article:
Section 1 — The Analyst’s Case
Section 2 — Iggy’s Forensic Screen
Financial Health Checklist
Section 3 — The Dividend Trajectory
Dividend Trajectory
Section 4 — The Forensic Gap
Iggy’s Insight Box 1
Section 5 — What To Watch Next
Iggy’s Insight Box 2
Forensic Classification: Speculative Income Vehicle. Suitability — Accumulation: Fail | Transition: Fail | Drawdown: Fail.
Closing — The Forensic Stance
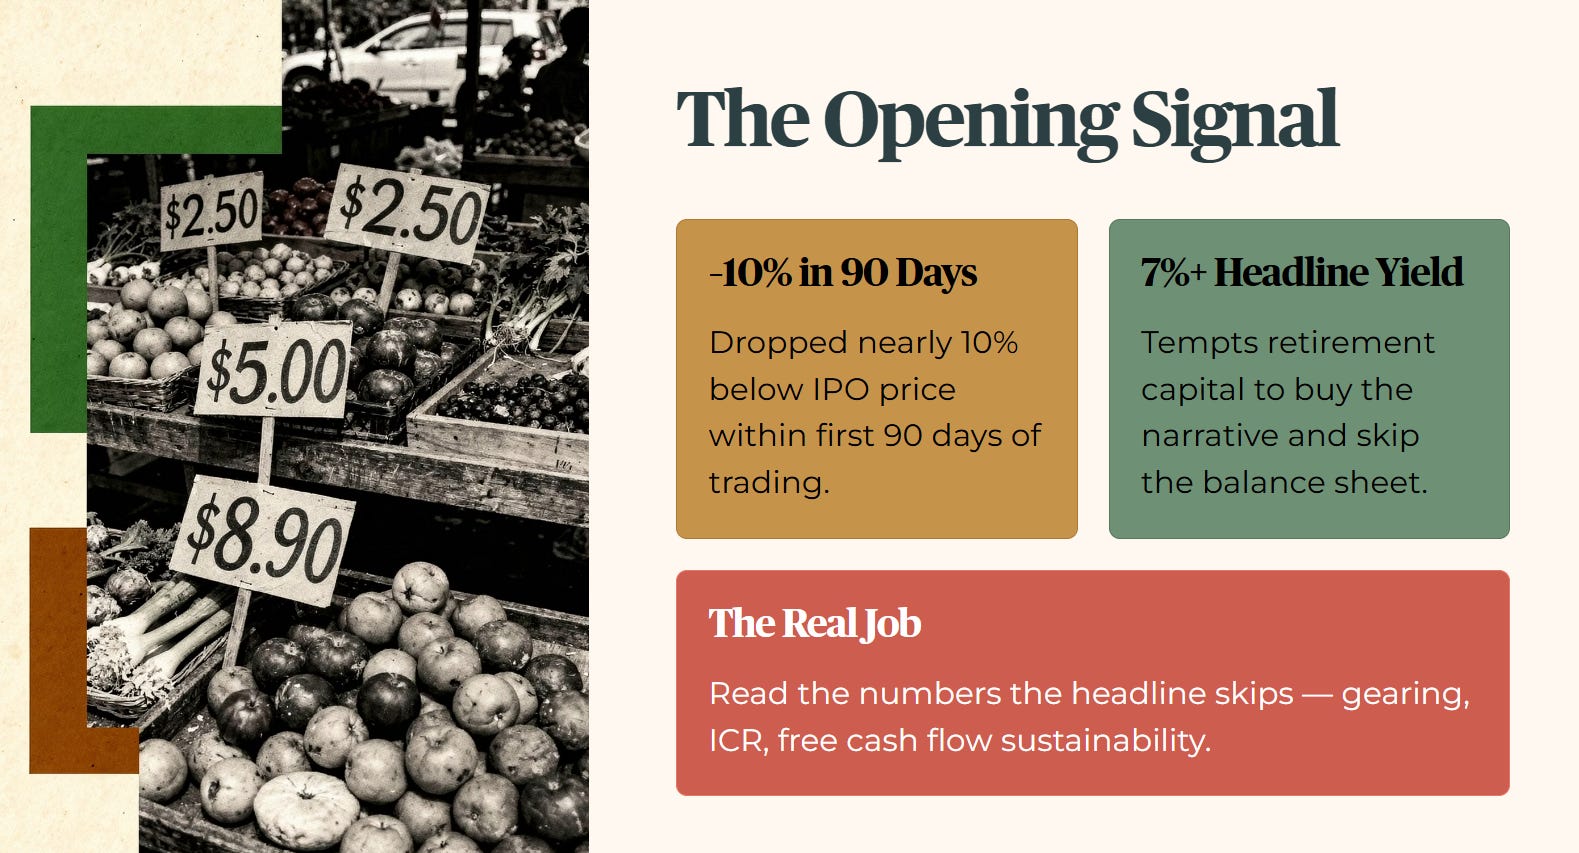
A newly listed REIT dropping nearly ten percent below its Initial Public Offering price within its first ninety days of trading is a number that should make every income investor stop and look closely. When a fresh asset vehicle hits the mainboard with a headline forward distribution yield of over seven percent, the immediate temptation for retirement capital is to buy the narrative and skip the balance sheet audit, applying the same forensic balance sheet thresholds I use for my own retirement capital.
The open market has a funny way of testing a sponsor’s assumptions before the ink on the prospectus is even dry. Looking at the initial trading data for UI Boustead REIT while tracking the blistering run of the broader Straits Times Index brings us back to the core reality of income investing in Singapore. Finding a steady home for your Supplementary Retirement Scheme capital requires a framework that cares deeply about structural debt walls, not broker enthusiasm. My job is simple, even if the balance sheet is not. I read the numbers that the headline skips, the interest coverage, the gearing, the free cash flow sustainability, so that the Singaporean building or living off a dividend portfolio gets the same forensic clarity that institutional money takes for granted.
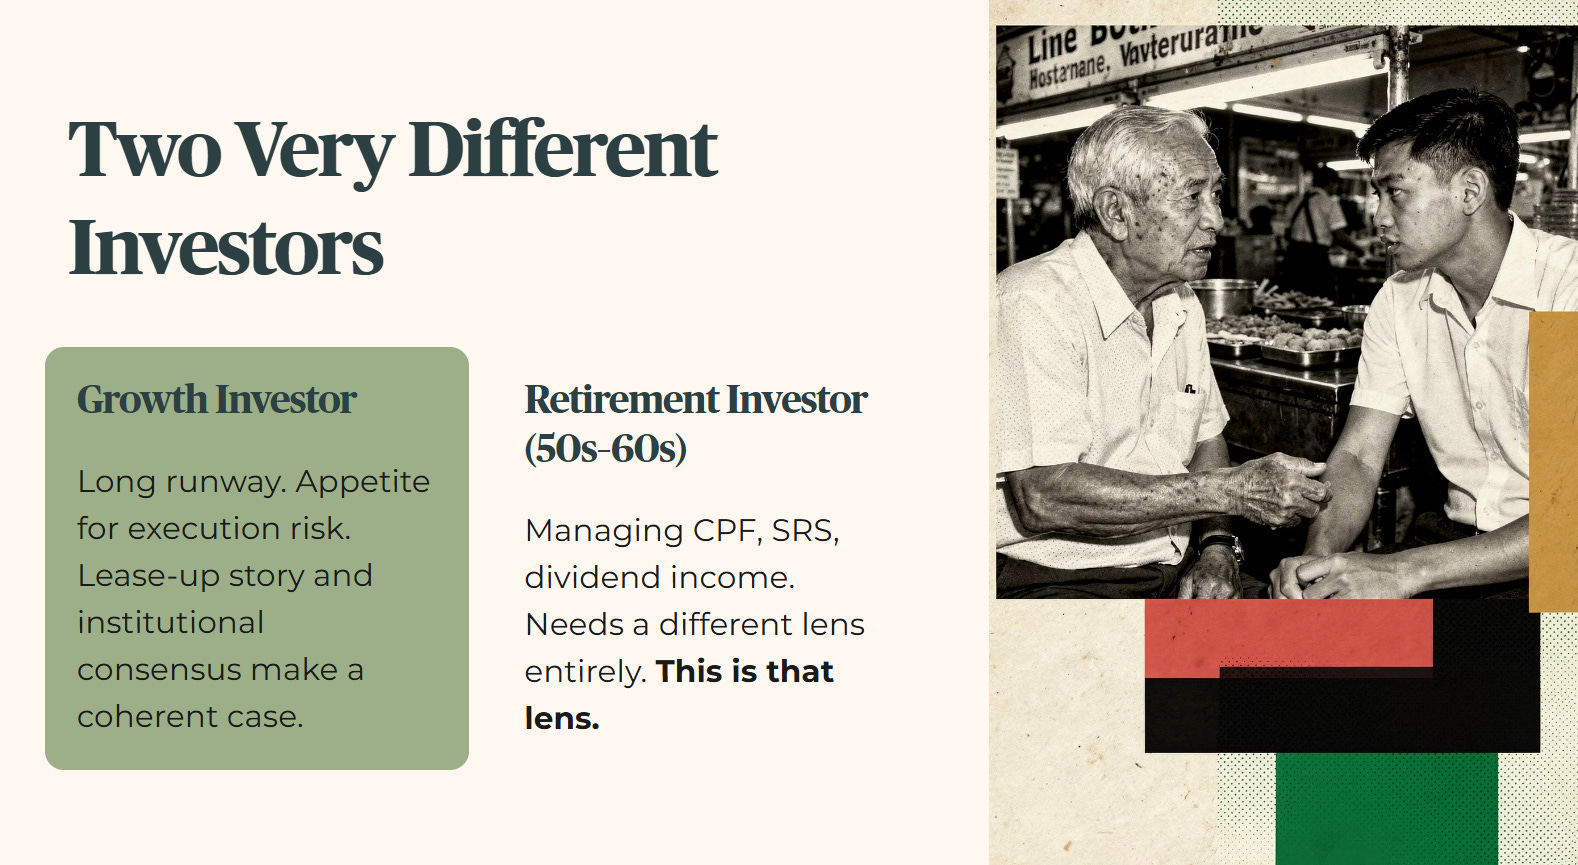
This REIT is aimed at two very different types of investors. For the growth investor with a long runway and appetite for execution risk, the lease-up story and the institutional buy consensus make a coherent case. For the Singaporean in their fifties or sixties managing CPF, SRS, and dividend income, the framework applies a different lens entirely. What follows is that second lens.
Section 1 — The Analyst’s Case
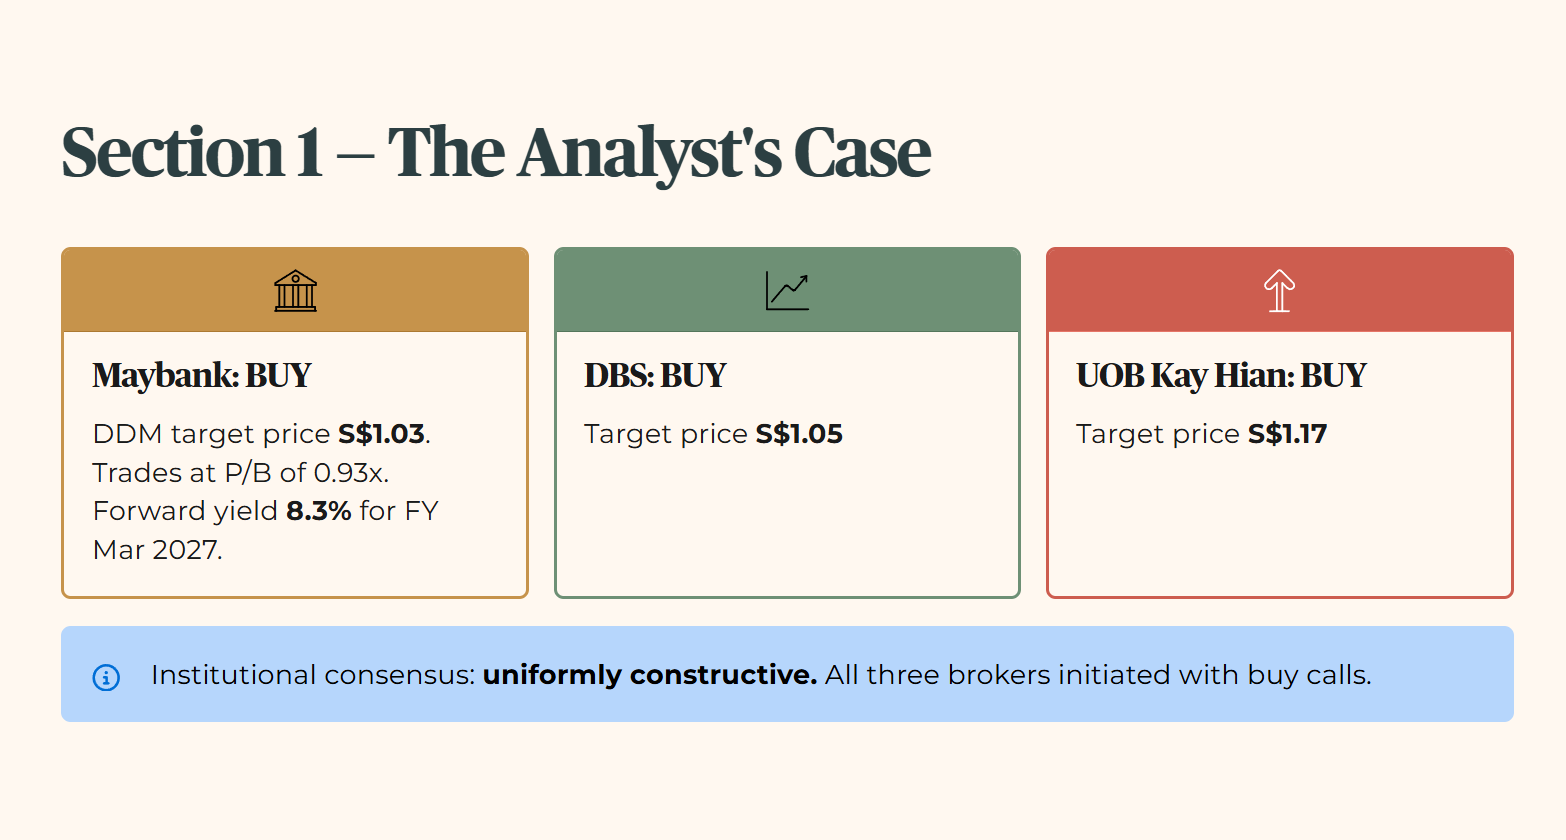
Maybank has initiated coverage on UI Boustead REIT with a BUY rating and a Dividend Discount Model based target price of S$1.03. The Dividend Discount Model is a valuation method that estimates a fair price based on projected future payouts. The analyst house rests its investment thesis on an attractive valuation entry point, noting that the REIT trades at a price-to-book ratio of 0.93x, a comparison of what the market is paying versus what the assets are actually worth on the books based on Maybank’s NAV estimate at the time of initiation, and projects a forward distribution yield of 8.3% for the financial year ending 31 March 2027.
This valuation discount is framed as a significant mispricing relative to industrial and logistics peers on the Singapore Exchange. For context, two other brokers have also initiated with buy calls: DBS with a target price of S$1.05 and UOB Kay Hian with a target price of S$1.17. The institutional consensus on this name is uniformly constructive.
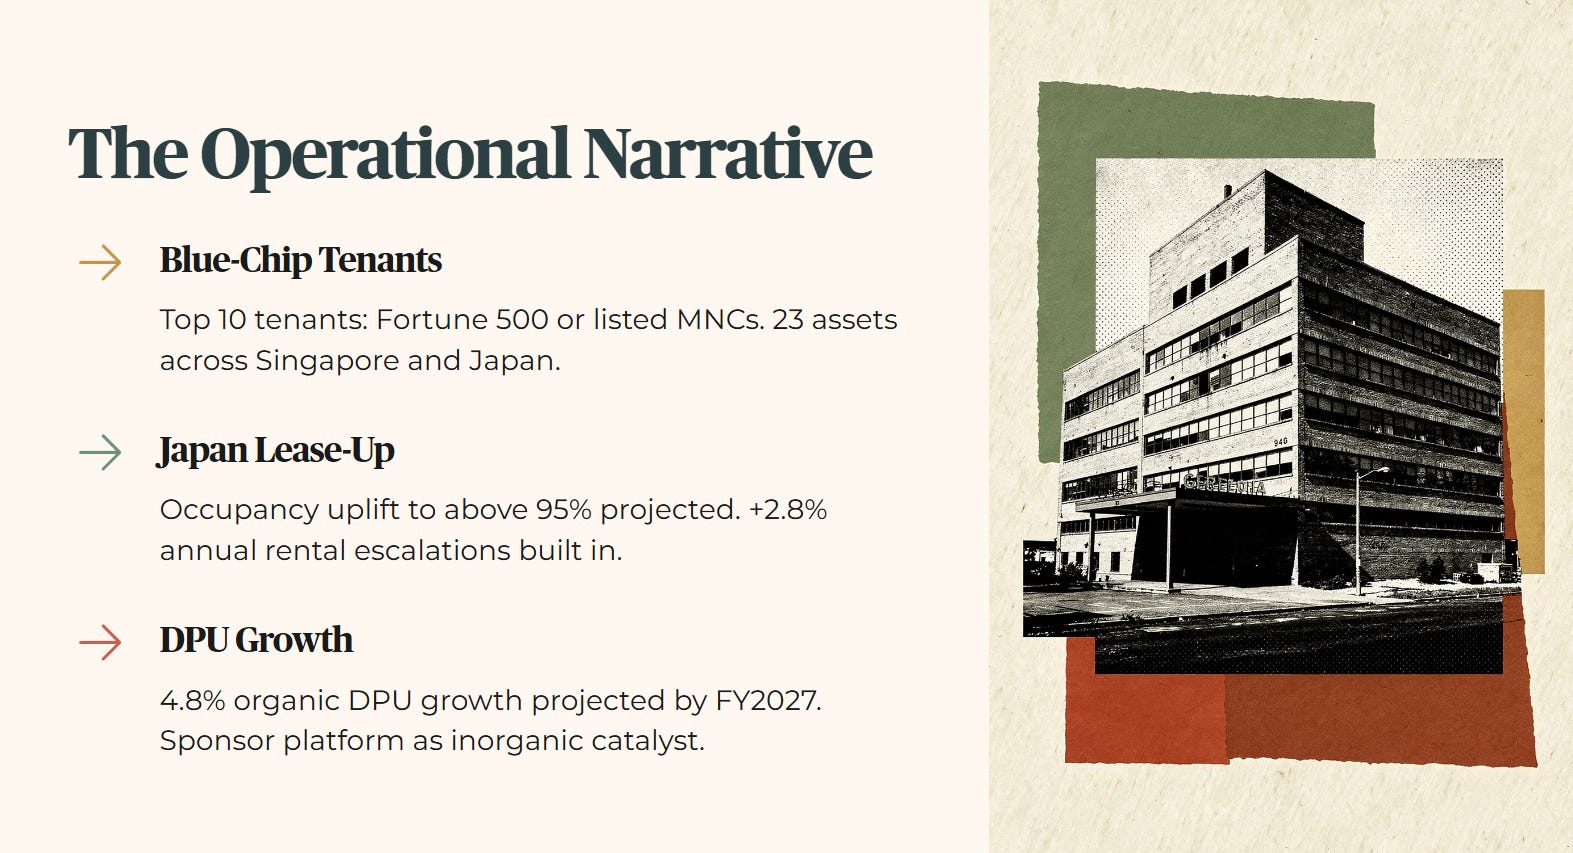
Operationally, the institutional narrative focuses heavily on the high-quality, technology-focused nature of the tenant base. The broker highlights that the majority of gross rental income is derived from hi-tech, value-add, and innovation-driven corporate tenants, with the top ten tenants dominated by Fortune 500 status or listed multinational corporation status. This concentration of blue-chip corporate credit is projected to provide absolute income resilience across the REIT’s portfolio of twenty-three assets in Singapore and Japan.
Organic growth is projected to accelerate through the lease-up of vacant industrial spaces in Japan, where occupancy was the primary drag at the time of listing. Maybank expects total portfolio occupancy to rise above 95%, which, when combined with built-in annual rental escalations averaging 2.8%, should drive a visible organic Distribution Per Unit growth rate of 4.8% by the 2027 financial year. The Distribution Per Unit is the cash payout each unit holder receives. Furthermore, the sponsor’s Pan-Asian industrial real estate platform is flagged as an active catalyst for future inorganic asset acquisitions.
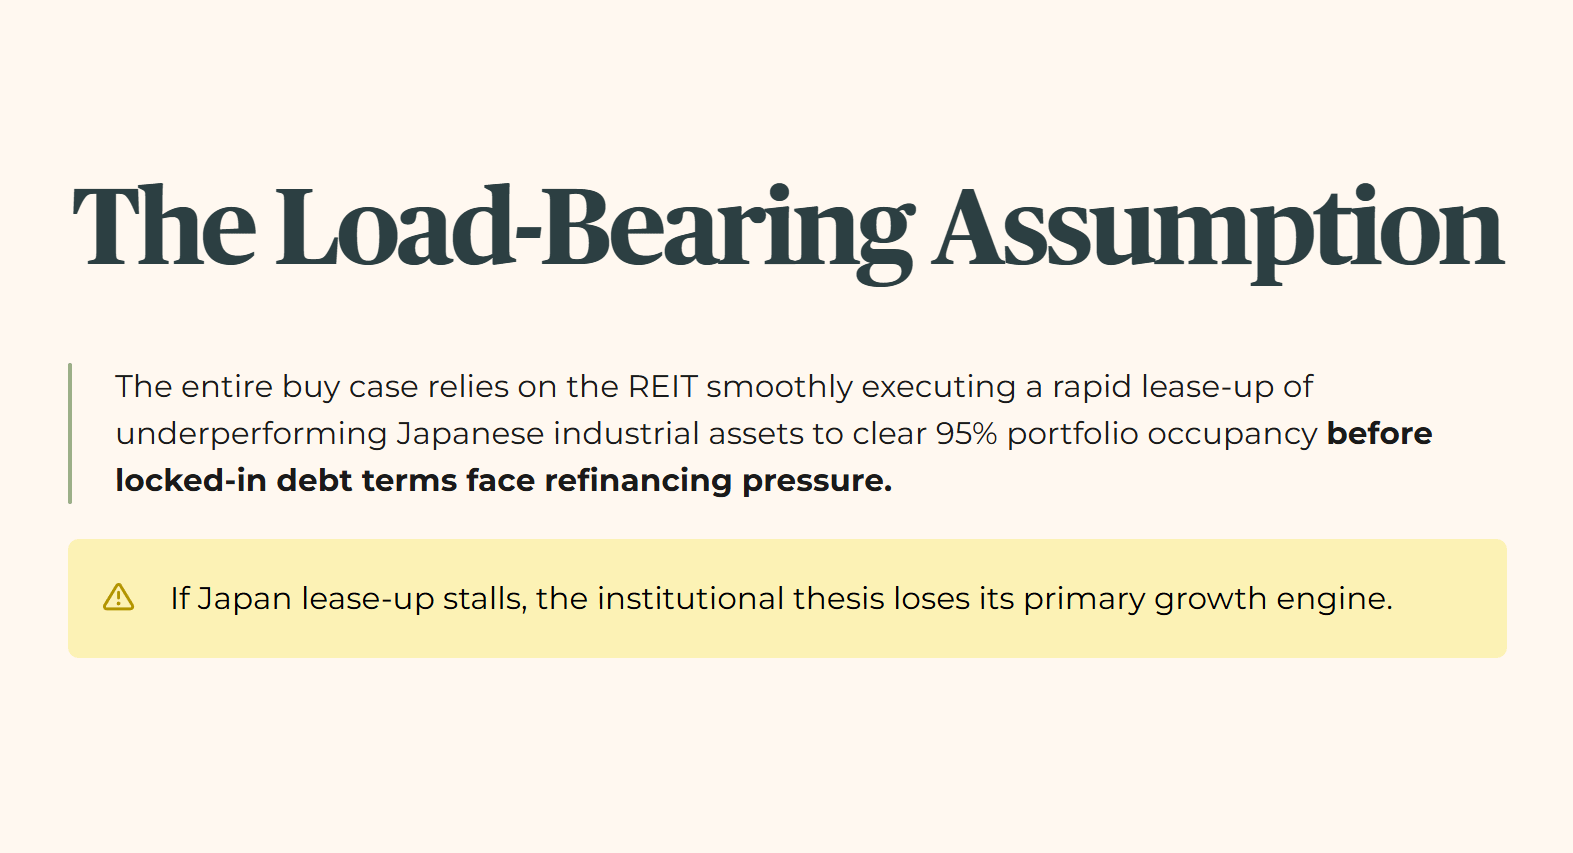
THE LOAD-BEARING ASSUMPTION: The broker’s entire buy case relies on the assumption that the REIT can smoothly execute a rapid lease-up of its underperforming Japanese industrial assets to clear a 95% portfolio occupancy target before its locked-in debt terms face refinancing pressure.
Section 2 — Iggy’s Forensic Screen
When we apply Iggy’s personal forensic standards to the actual numbers from the prospectus balance sheet, the institutional growth narrative collides directly with our structural leverage guardrails.
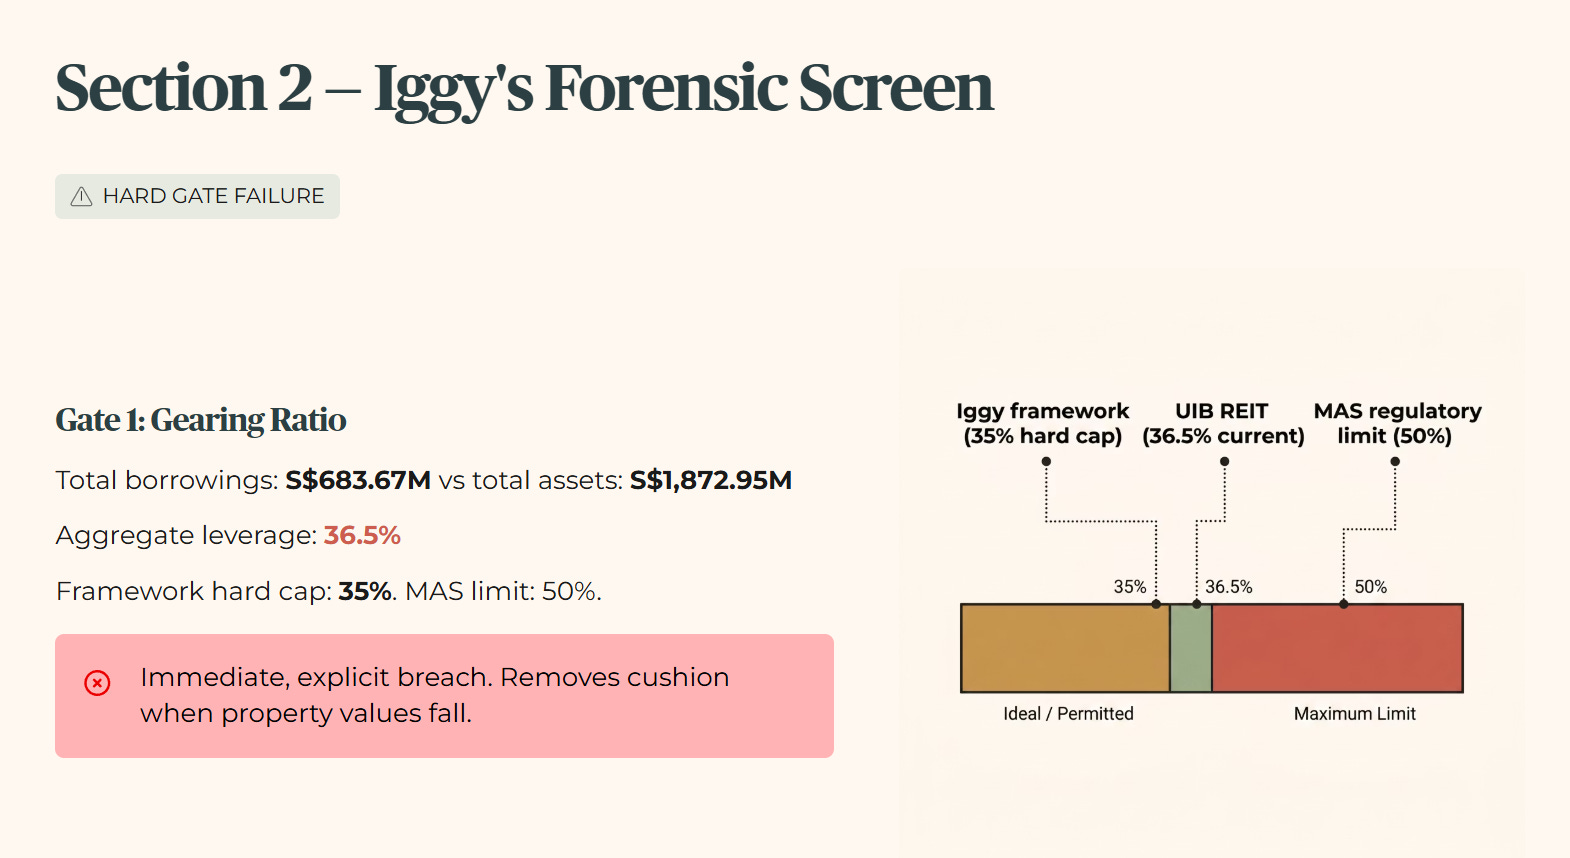
Our first balance sheet gate is the Gearing Ratio, the proportion of the REIT’s assets funded by borrowed money. UI Boustead REIT reports total borrowings of S$683.67M against total assets of S$1,872.95M, resulting in an aggregate leverage ratio of 36.5%. This is an immediate, explicit breach of our hard framework ceiling of 35%. It removes the cushion a manager needs when property values fall. While the Monetary Authority of Singapore maintains a regulatory leverage limit of 50%, our conservative retail framework views any debut above 35% as a serious structural weakness.
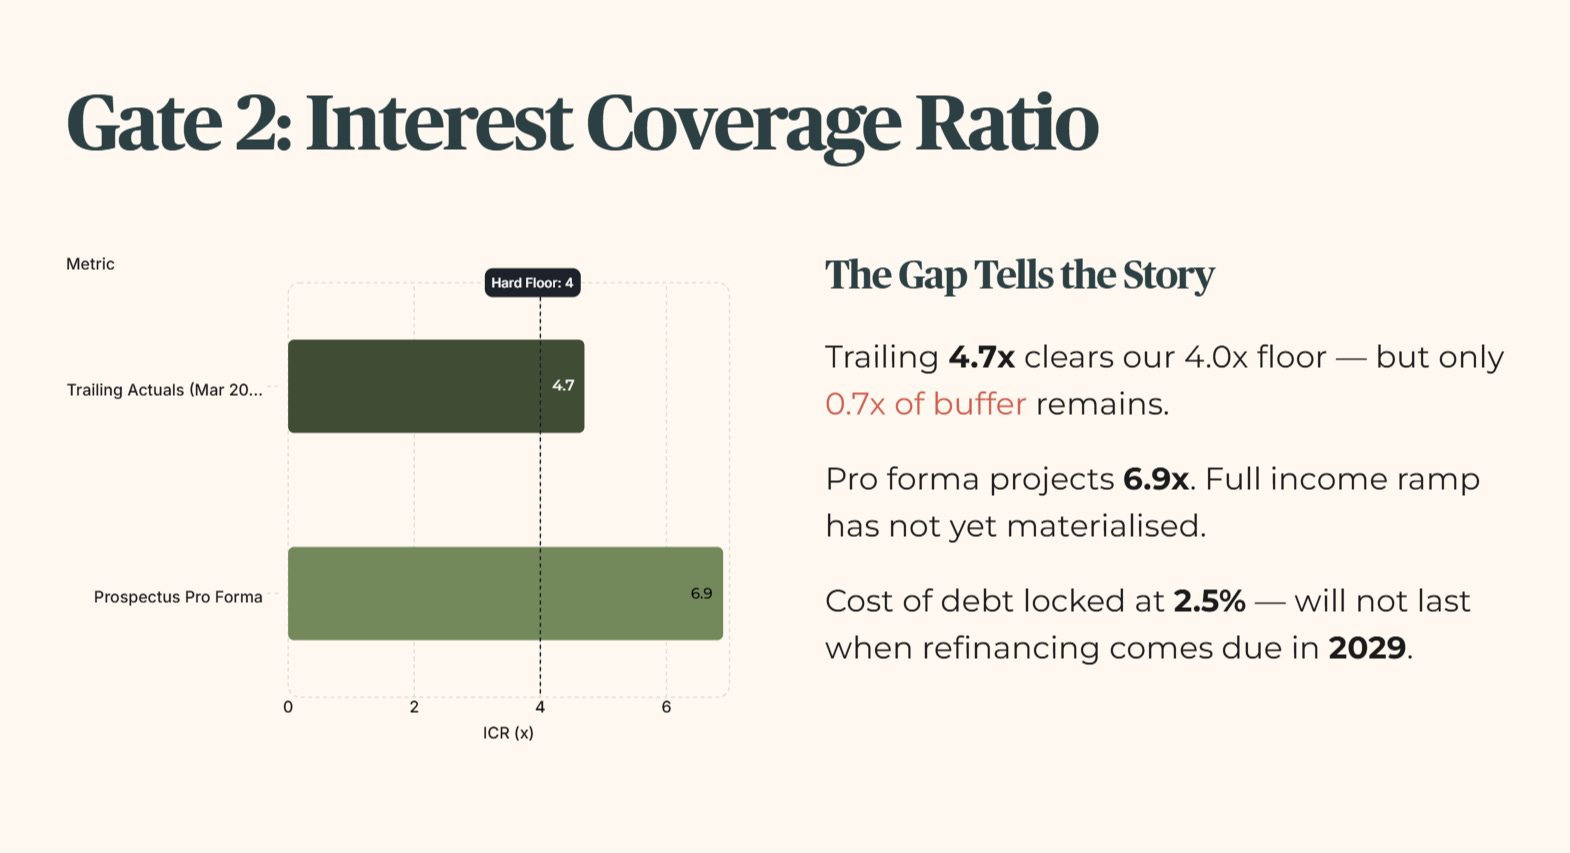
Our second balance sheet gate is the Interest Coverage Ratio, the measure of whether rental income can comfortably cover debt repayments. Here the picture is more nuanced. The trailing actuals as at 31 March 2026 deliver an interest coverage ratio of 4.7x. This clears our hard framework floor of 4.0x, but the margin is thin, only 0.7x of buffer between current performance and the level where income can no longer comfortably service debt. For reference, the annualized prospectus pro forma projects a ratio of 6.9x, a figure the REIT’s CEO has referenced in investor communications. The gap between 4.7x delivered and 6.9x projected tells us the full income ramp has not yet materialized. Both figures clear our floor. Only one of them reflects what has actually been earned so far. The thin trailing coverage is driven by an exceptionally low weighted average cost of debt of 2.5% locked in at listing, a rate that will not last forever when refinancing comes due in 2029.
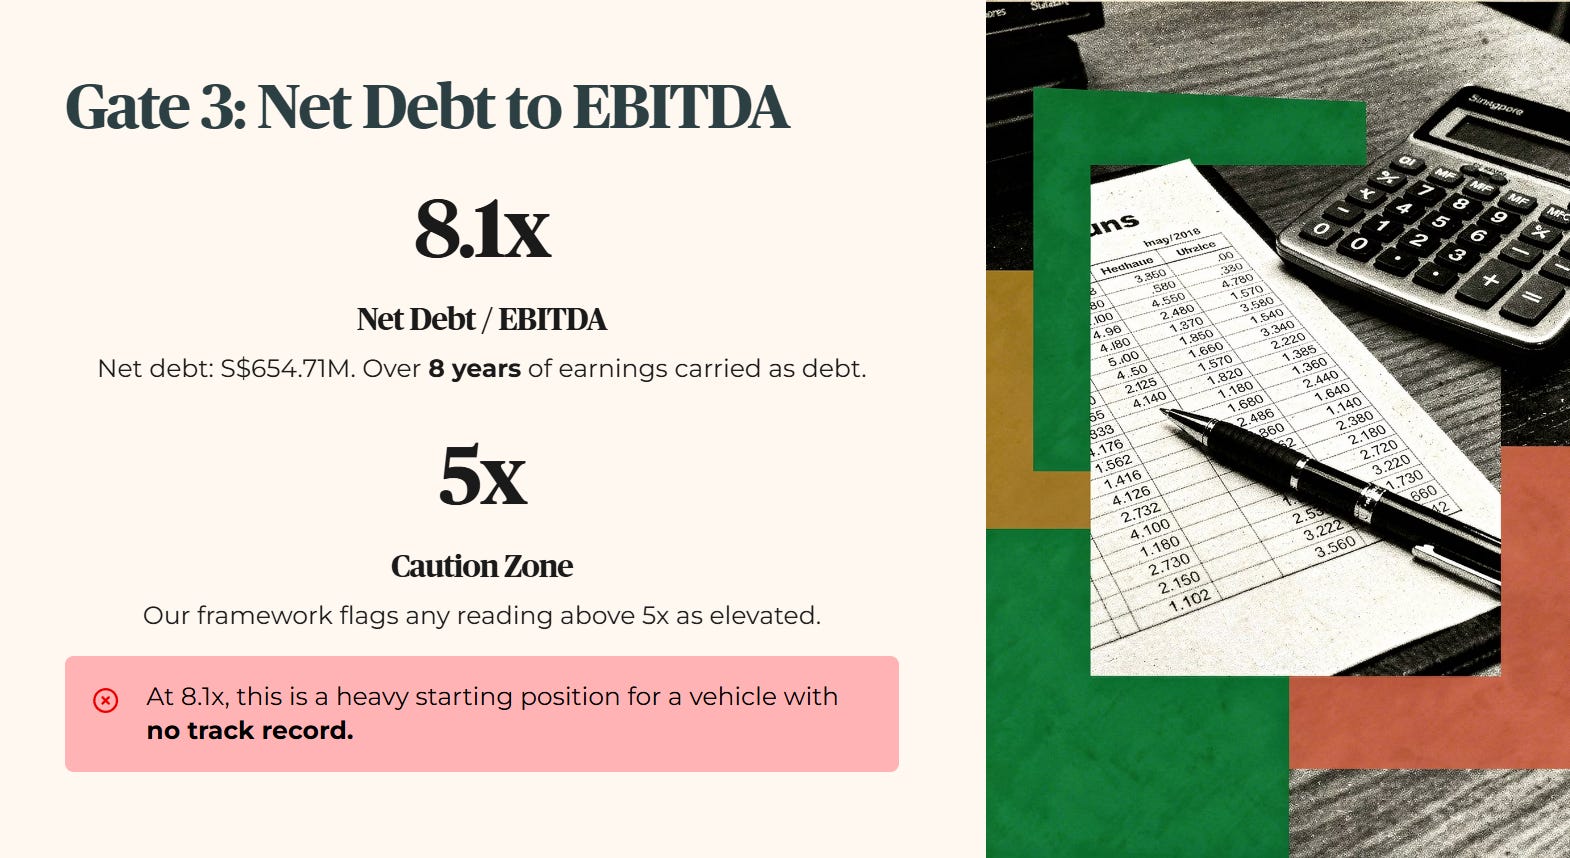
The final corporate leverage gate is the Net Debt to EBITDA ratio, a measure of how many years of operating earnings it would take to repay all borrowings. The higher this number, the more indebted the vehicle is relative to its earnings power. With total net debt sitting at S$654.71M against annualized operating cash flows, the multiple lands at approximately 8.1x. Our caution zone flags any reading above 5x as elevated. At 8.1x, this REIT is carrying over eight years’ worth of earnings as debt. That is a heavy starting position for a vehicle with no track record.
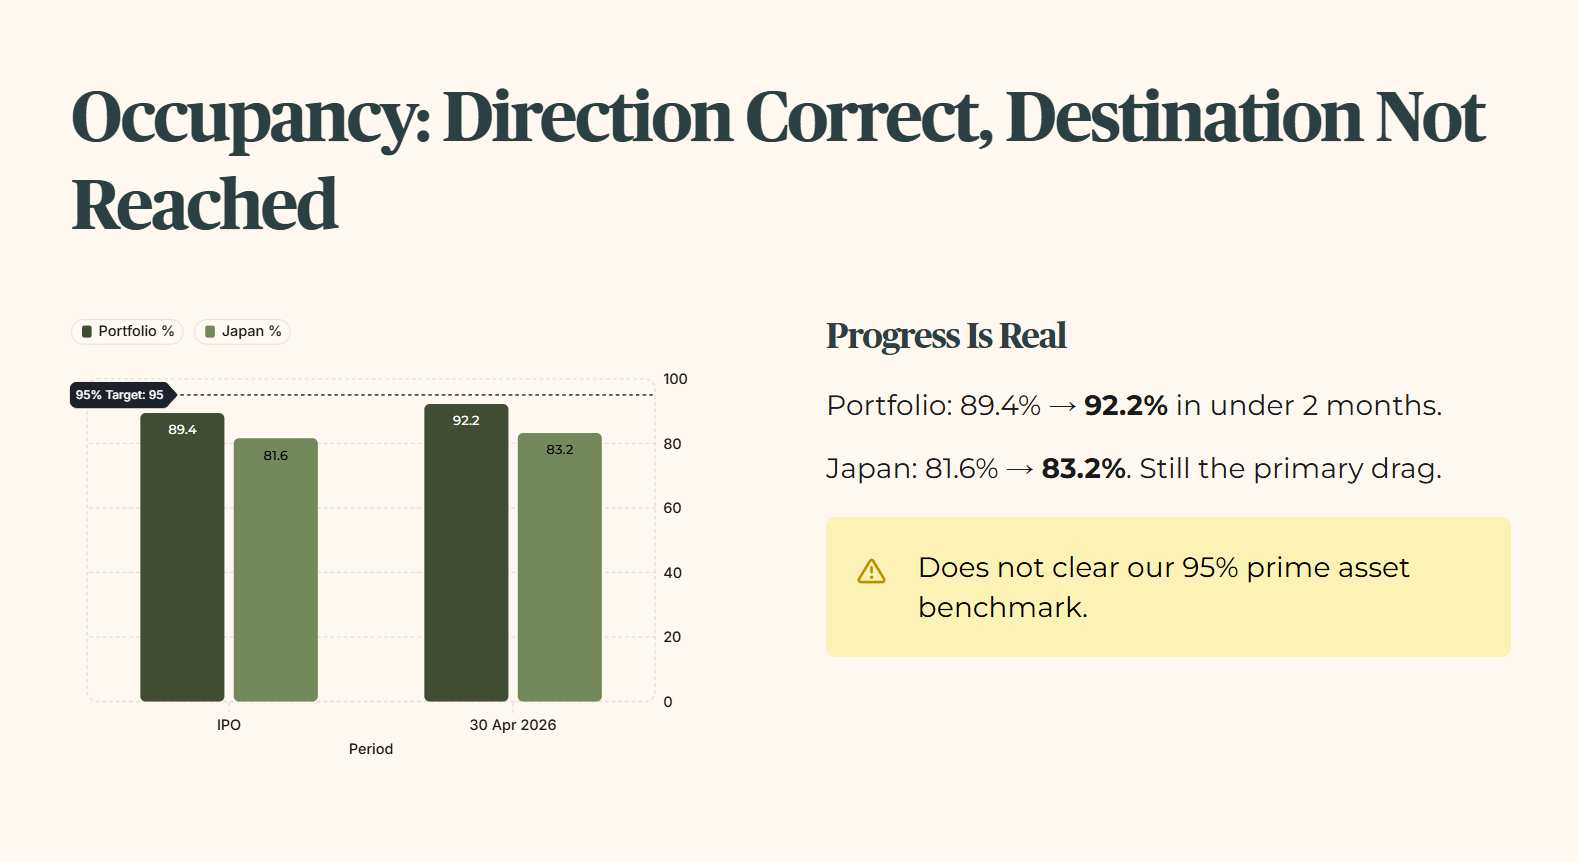
On the operational side, the portfolio committed occupancy at the time of the IPO prospectus stood at 89.4%. Since listing, the management team has made visible progress, signing new and renewed leases to push committed occupancy to 92.2% as at 30 April 2026. That improvement is real and worth acknowledging. It does not, however, clear our prime asset occupancy benchmark of 95%. The Japanese property segment remains the drag, where occupancy stood at approximately 81.6% at IPO and has since improved to 83.2% as at 30 April 2026. The direction of travel is correct. The destination has not yet been reached.
Financial Health Checklist
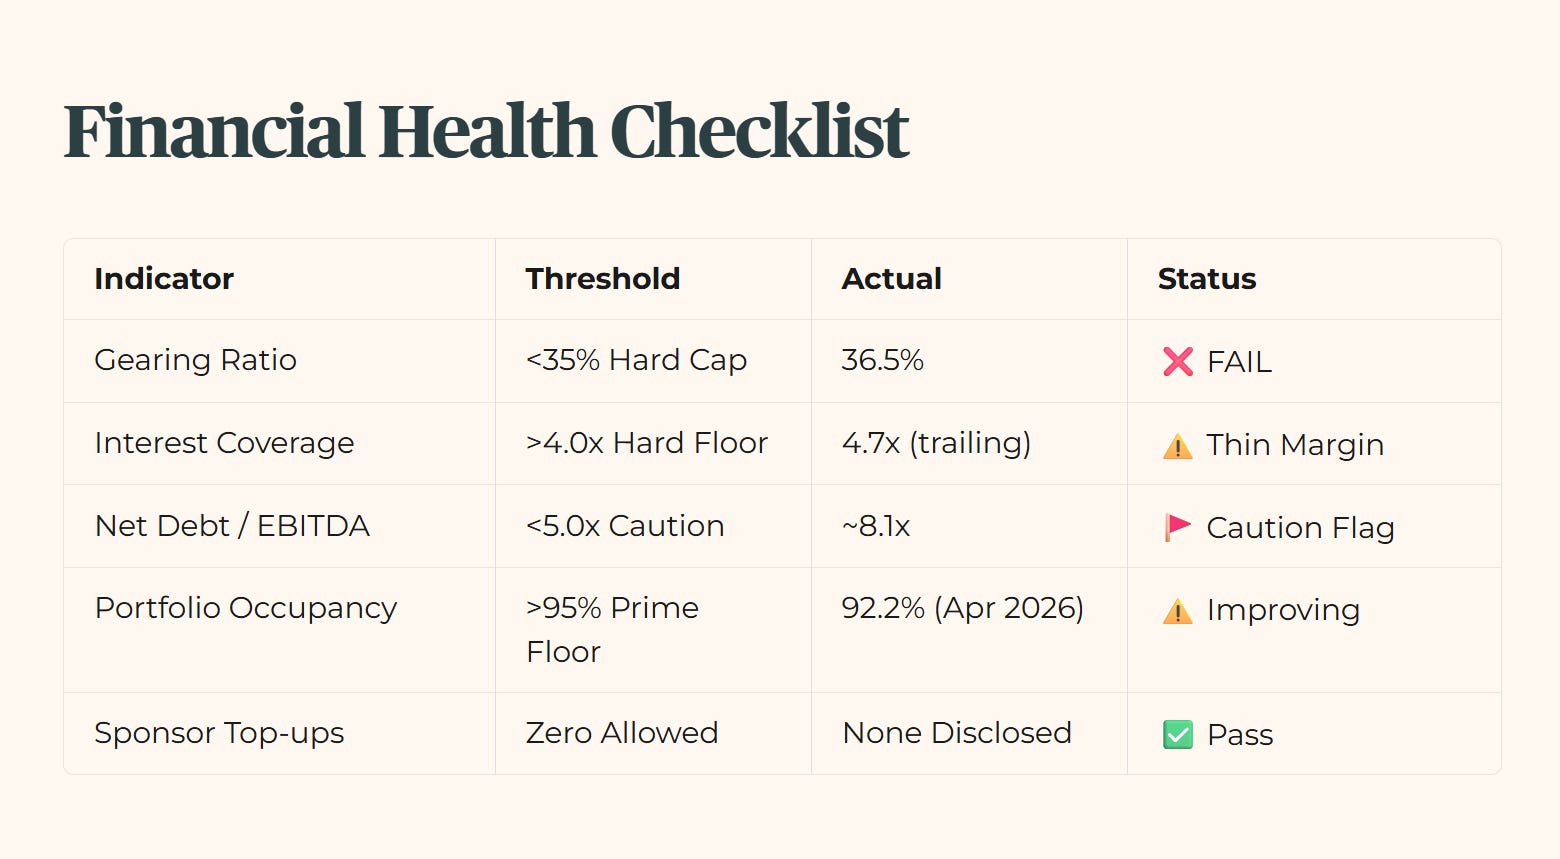
Before assigning our final structural rating, we count the total number of soft flags triggered under the framework. UI Boustead REIT triggers exactly three soft flags: occupancy below 95% for prime assets, a structural data gap for historical revenue and net profit trends due to its short operating history since listing in March 2026, and a data gap for an active InvestingPro consensus Fair Value calculation.
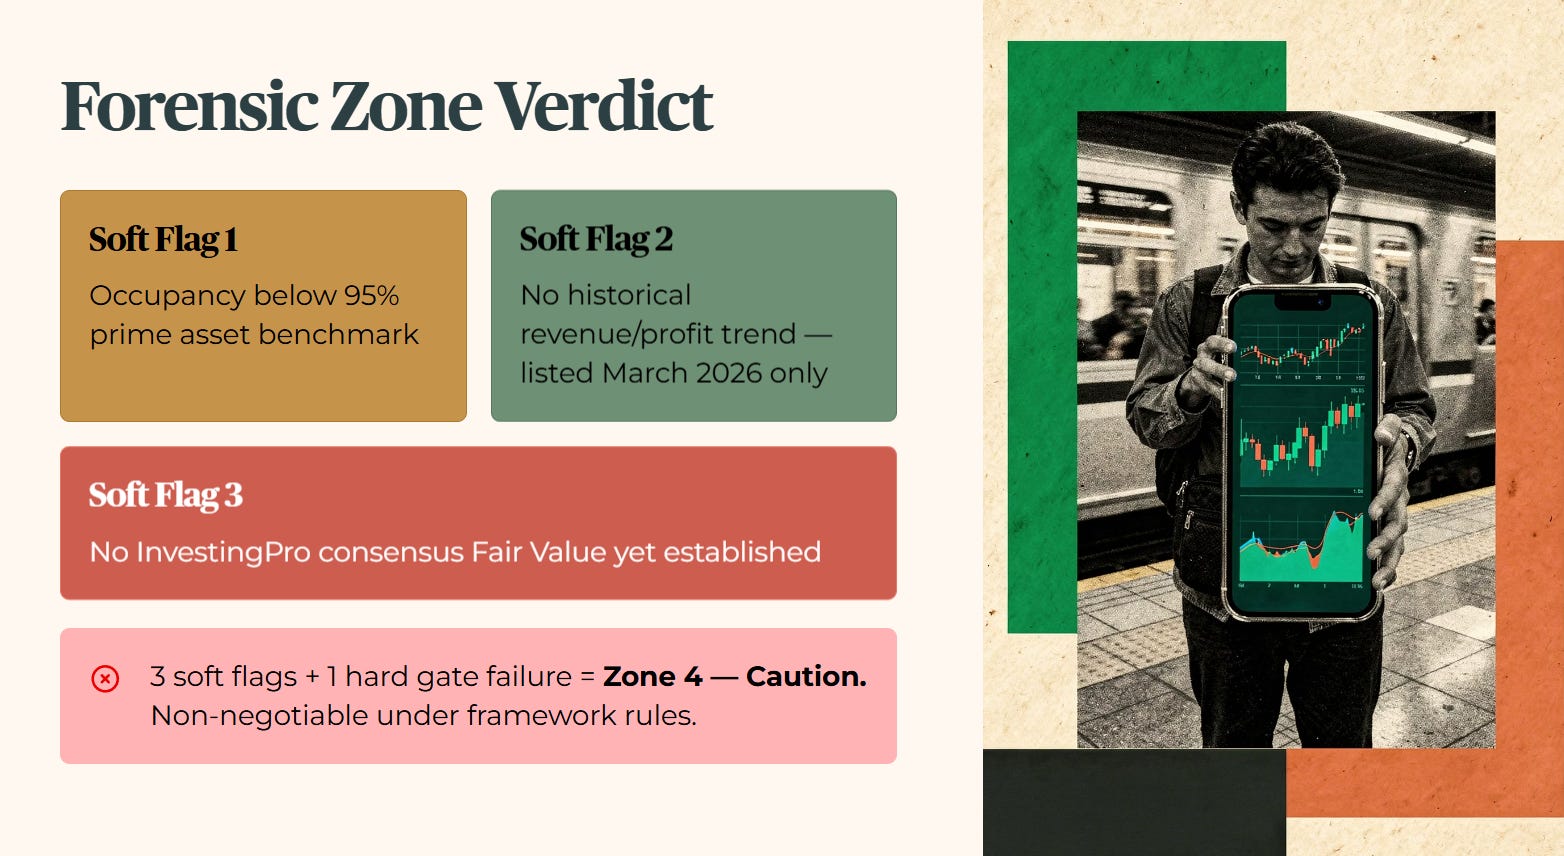
Under the non-negotiable rules of our framework, the presence of three soft flags combined with a hard leverage gate failure automatically places this REIT into a definitive Zone 4 Caution assignment.
Iggy’s Forensic Zone: Zone 4 — Caution.
Section 3 — The Dividend Trajectory
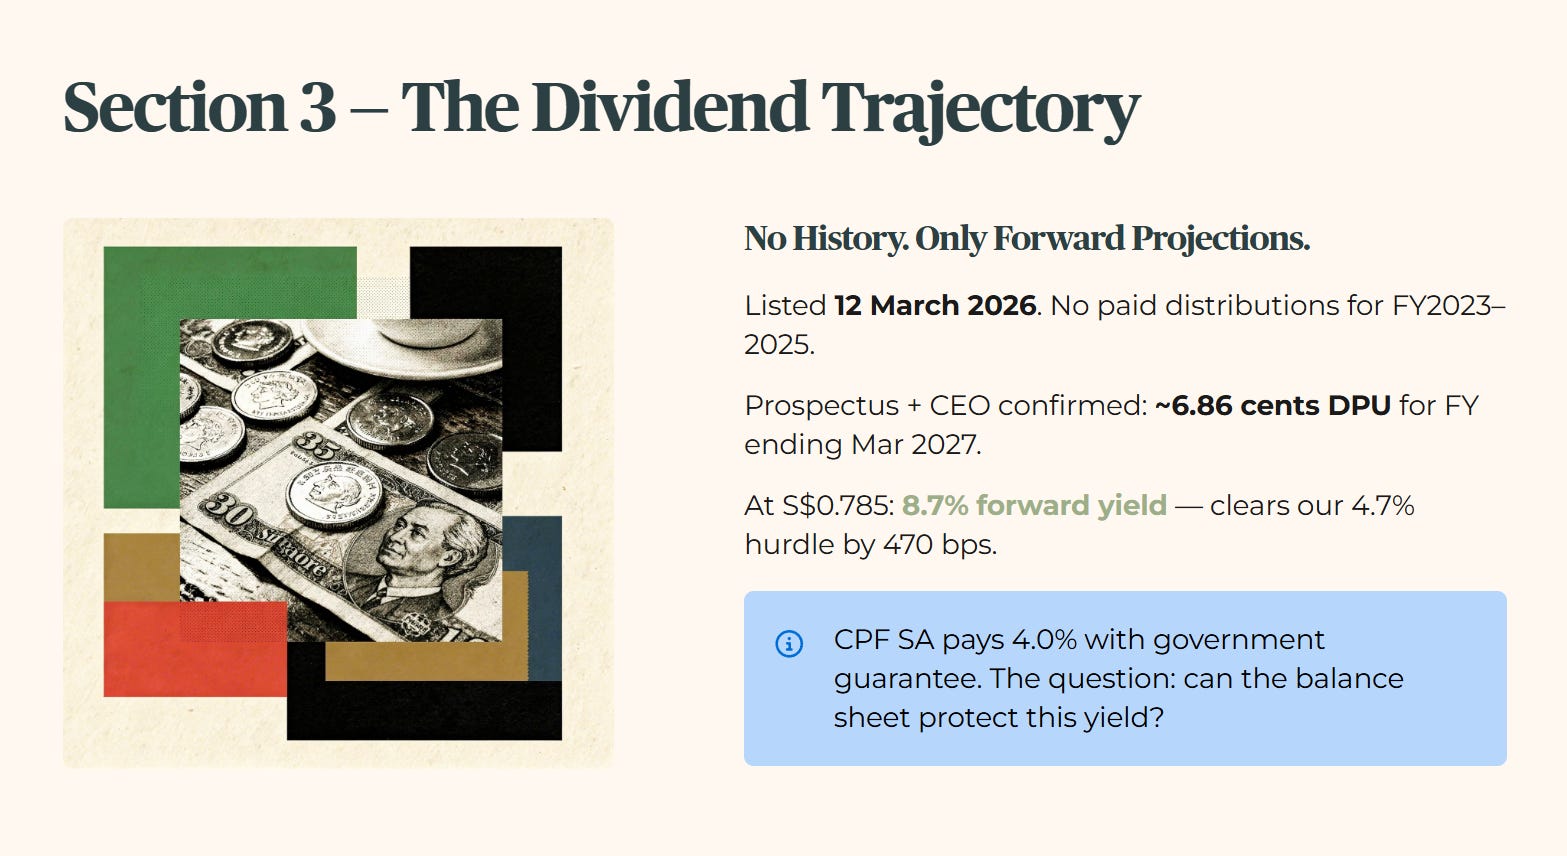
Because UI Boustead REIT only commenced trading on the Singapore Exchange on 12 March 2026, there is an absolute trailing history data gap for paid distributions. The trust did not exist as a listed entity during fiscal years 2023, 2024, or 2025. Any analysis of its distribution trajectory must therefore evaluate the forward projections established in the initial public offering prospectus against the current market price of S$0.785.
The prospectus projects a full-year Distribution Per Unit of approximately 6.86 cents for the financial year ending 31 March 2027, confirmed independently by the REIT’s CEO in post-listing investor communications. At the current market price of S$0.785, that translates to a forward distribution yield of 8.7%. For context, CPF SA currently pays 4.0% with a government guarantee behind it. The 8.7% forward yield clears that benchmark by 470 basis points, but only if the distribution holds. The yield clears our Minimum Yield Hurdle of 4.7%, which is the minimum income return I require before any stock qualifies for a retirement portfolio. On income alone, the numbers work. The question is whether the balance sheet can protect them.
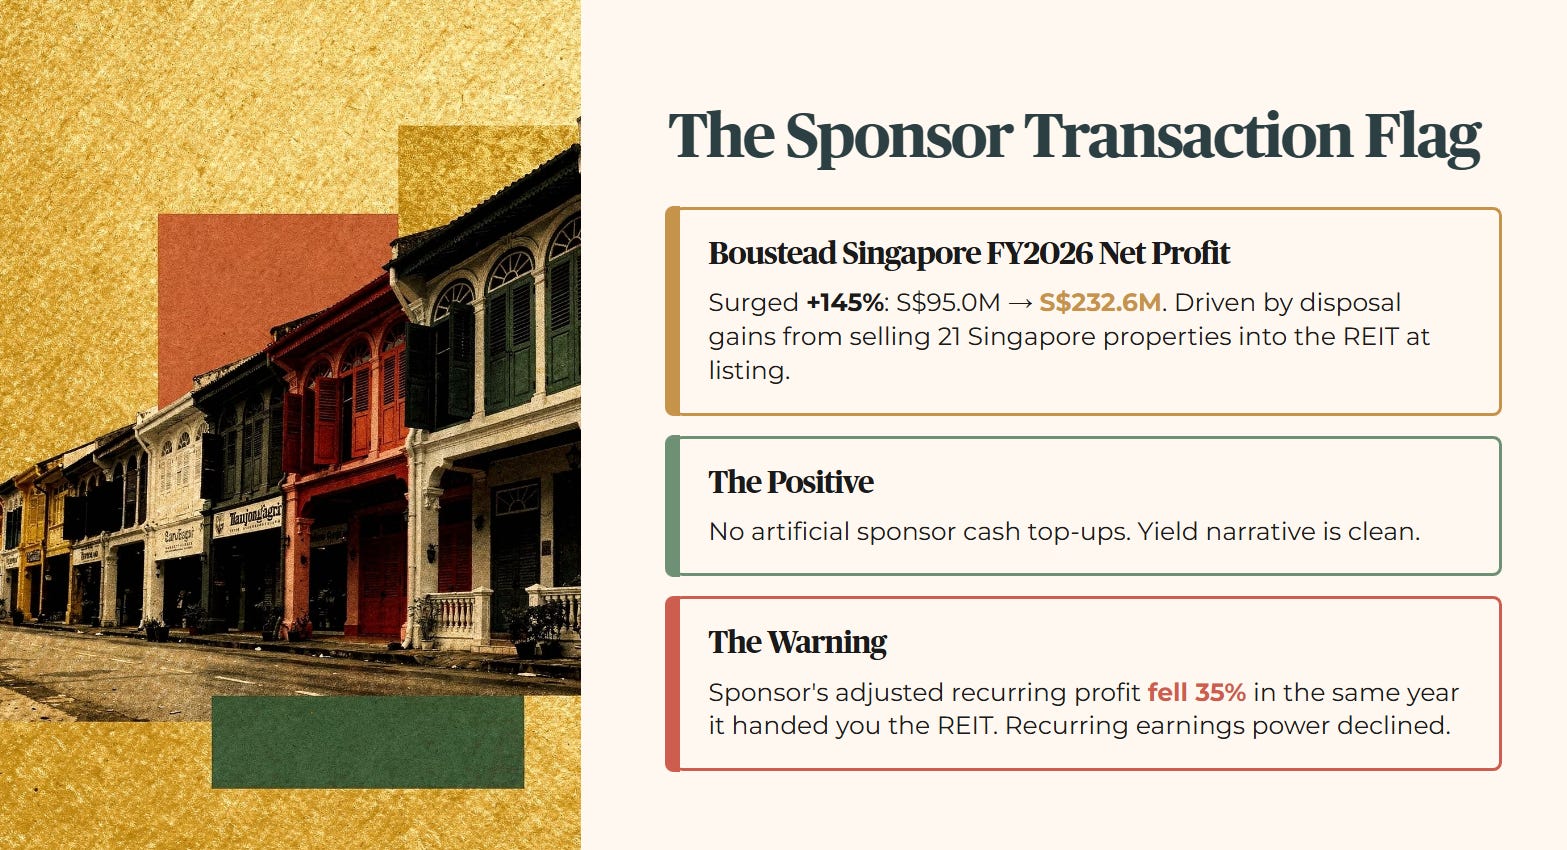
Forensically, we must highlight a major related party transaction flag. The parent sponsor, Boustead Singapore, reported a 145% surge in its own net profit for FY2026, climbing from S$95.0M to S$232.6M. The company explicitly attributed this surge primarily to asset disposal gains from selling twenty-one Singapore properties into UI Boustead REIT at listing. This tells us two things. The initial yield narrative is clean of artificial sponsor cash top-ups, which is positive. But the listing was highly transactional, allowing the sponsor to crystallize immense one-off cash gains while passing a 36.5% leveraged vehicle down to retail unitholders. Boustead’s own adjusted net profit, stripping out the disposal gains, fell 35% year on year. The sponsor’s recurring earnings power declined in the same year it handed you the REIT.
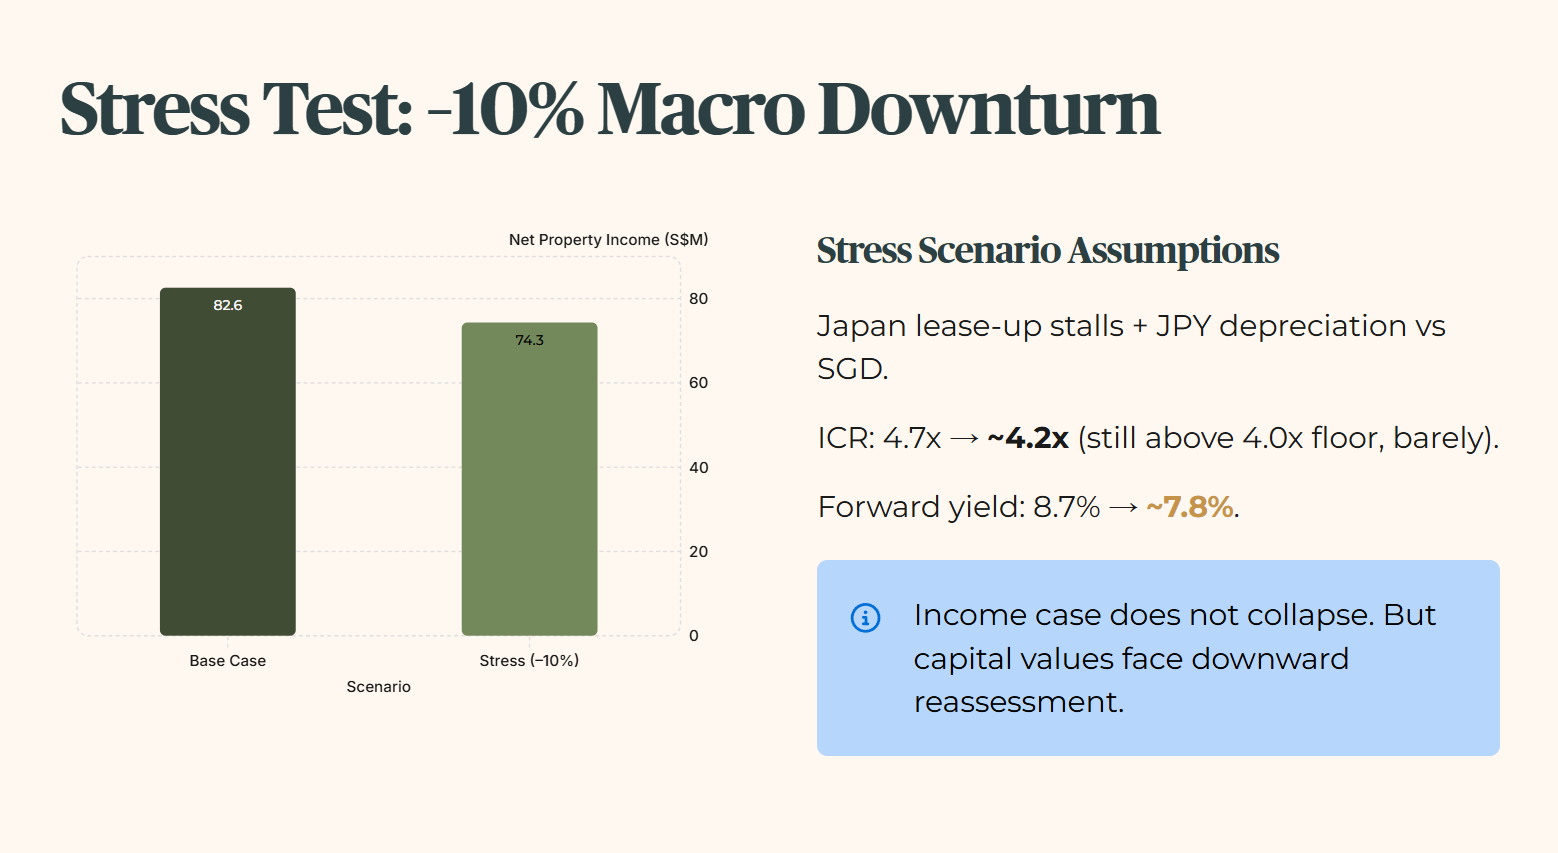
To stress test this distribution trajectory, we model a harsh 10% macro downturn hitting net property income, driven by a failure to continue the lease-up momentum in Japan and modest currency depreciation of the Japanese Yen against the Singapore Dollar. Under this scenario, annualized operating income would compress from S$82.59M to S$74.33M.
Because the REIT’s debt interest expense is locked at S$12.04M with zero refinancing requirements until the 2029 financial year, the interest coverage ratio would decline from 4.7x to approximately 4.2x under this stress scenario, still above the 4.0x floor, but with almost no remaining buffer. This 10% operational hit would drop the forward distribution yield from 8.7% down to approximately 7.8%. Your income cheque shrinks, but the income case does not collapse. Capital values, however, would likely face corresponding downward reassessment.
The next section applies this same 10% income shock directly to the 4.7x interest coverage and 36.5% gearing breach to show whether this REIT’s balance sheet can genuinely carry an 8.7% yield through a real downturn.
