



UOB Earned SGD 1.25 Billion, Below Estimates. What the Bank’s Own Documents Say Moved the Line 🦖
UOB reported its third quarter on 4 November. Here are the lines that moved, in the bank’s own words, and what the release leaves unsaid.
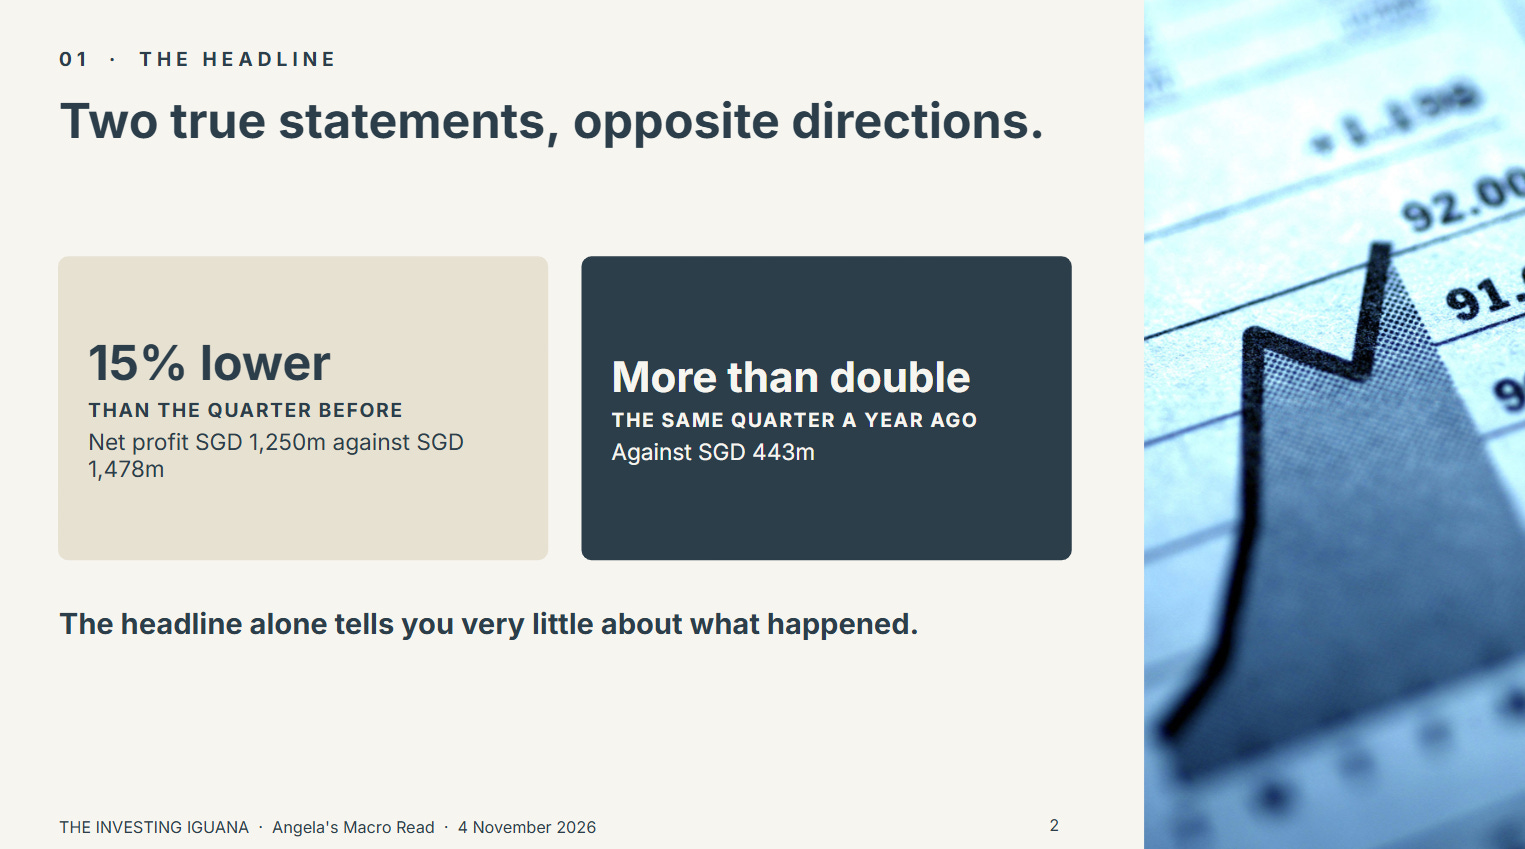
UOB reported net profit of SGD 1.25 billion for the third quarter, 15% lower than the quarter before and more than double the same quarter a year ago. Both statements are true, and they point in opposite directions, so the headline on its own tells you very little about what happened.
What I found worth slowing down for is that UOB’s own documents explain the fall from the previous quarter in one sentence. I want to walk through that sentence and the lines around it before anyone fits them into a story.
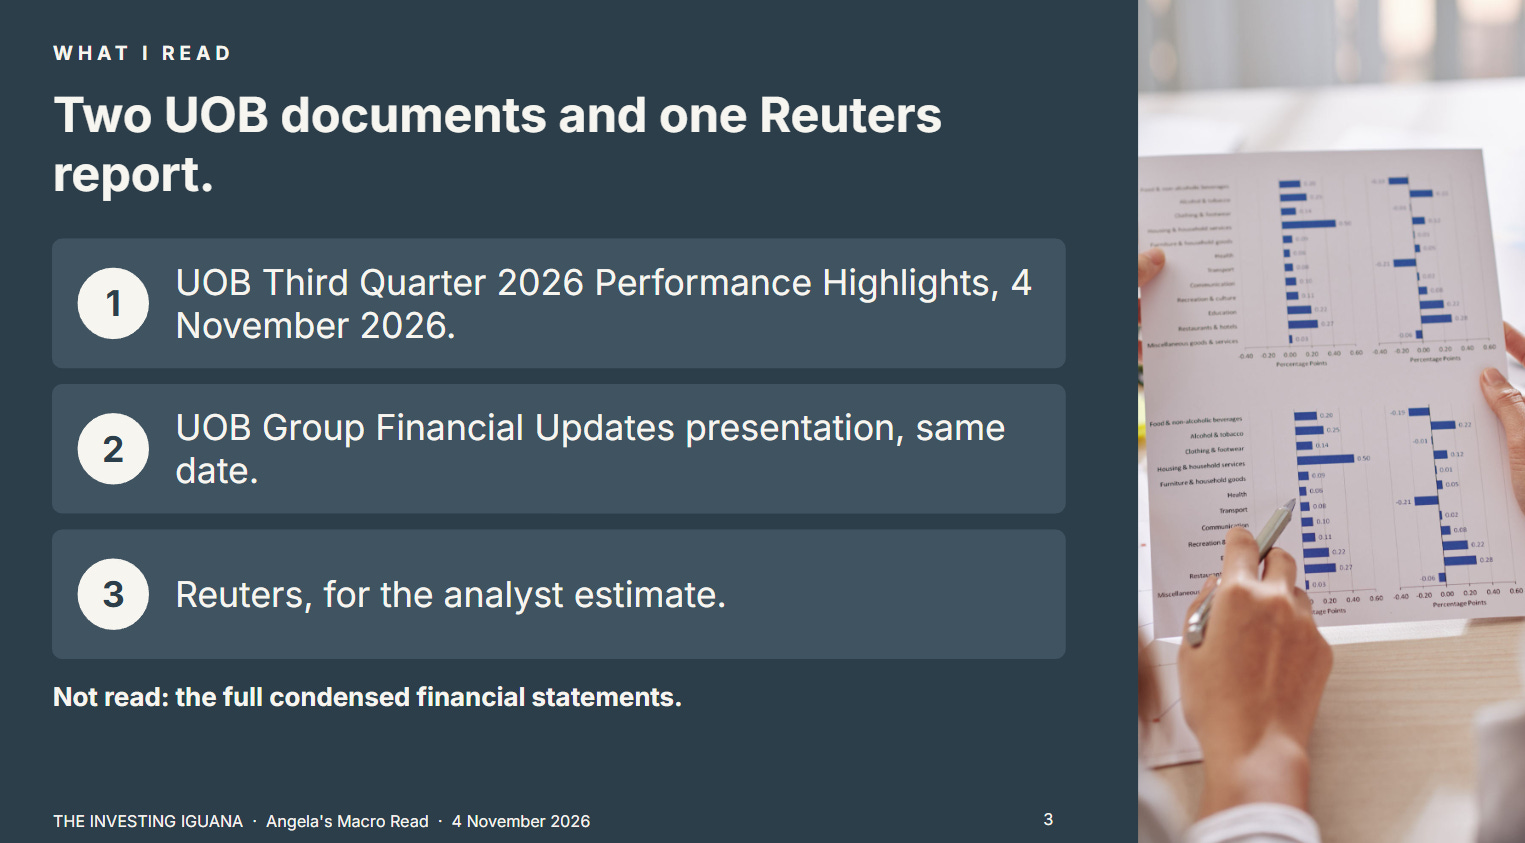
I am not a bank analyst, and I take no view on what UOB’s shares will do or whether anyone should own them. I read two documents the bank published on 4 November 2026: the Third Quarter 2026 Performance Highlights and the Group Financial Updates presentation for the nine months and third quarter ended 30 September 2026. I also read Reuters’ report of the results for the analyst estimate. I have not read the full condensed financial statements, so anything that sits only in them is outside this piece. If you own UOB, or a fund or an ETF that holds it, the practical question is which lines changed since last quarter and what the bank said about why.
What This Piece Does
It sets out UOB’s third quarter in the bank’s own figures, beside the previous quarter and the same quarter a year ago.
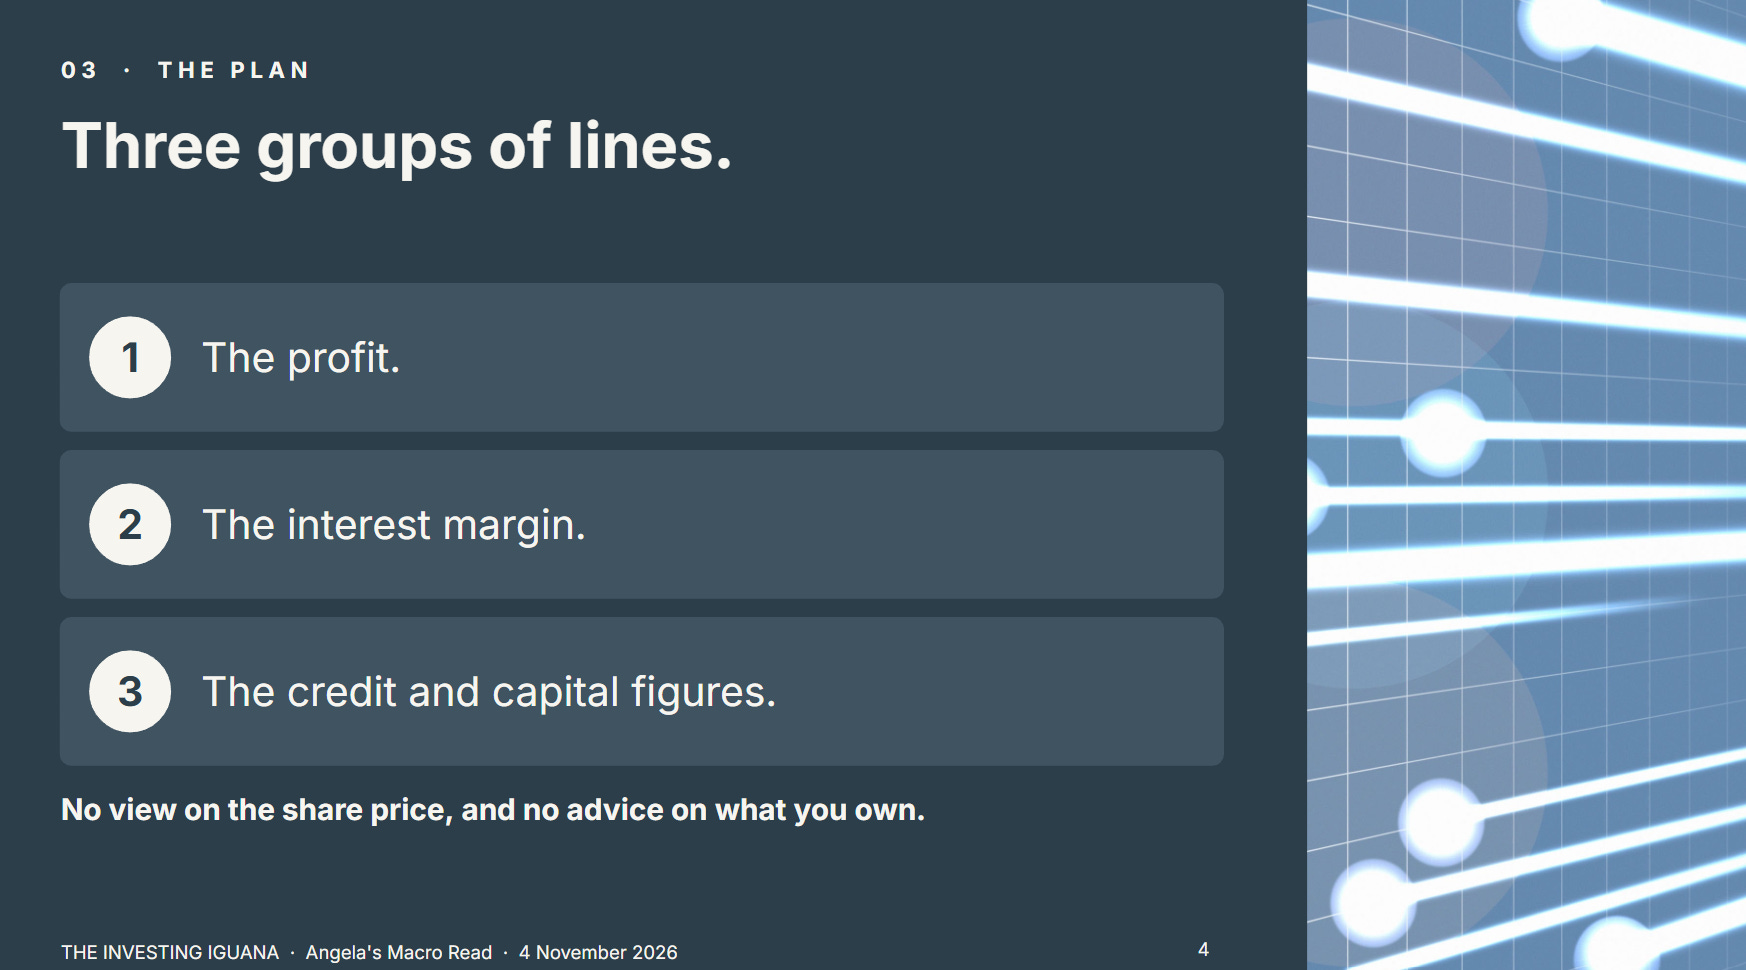
It reads three groups of lines: the profit, the interest margin, and the credit and capital figures.
It says what the two documents do not say, and where Iggy’s report on the Singapore banks picks up.
The whole piece is free to read. Nothing here is advice on your own holdings.

What This Piece Does
The Quarter in One Table
Why Profit Fell From the Last Quarter
UOB’s one-sentence reason
What analysts expected
What the Margin Says
Angela’s Observation
What the Credit and Capital Lines Say
The ratios UOB leads with
A line further into the presentation
The outlook UOB gave
What the Two Documents Do Not Say
Angela’s Observation
Iggy’s Forensic Read
Sources
The Quarter in One Table
All figures are UOB’s own, in SGD million unless shown as a percentage, from the Performance Highlights.
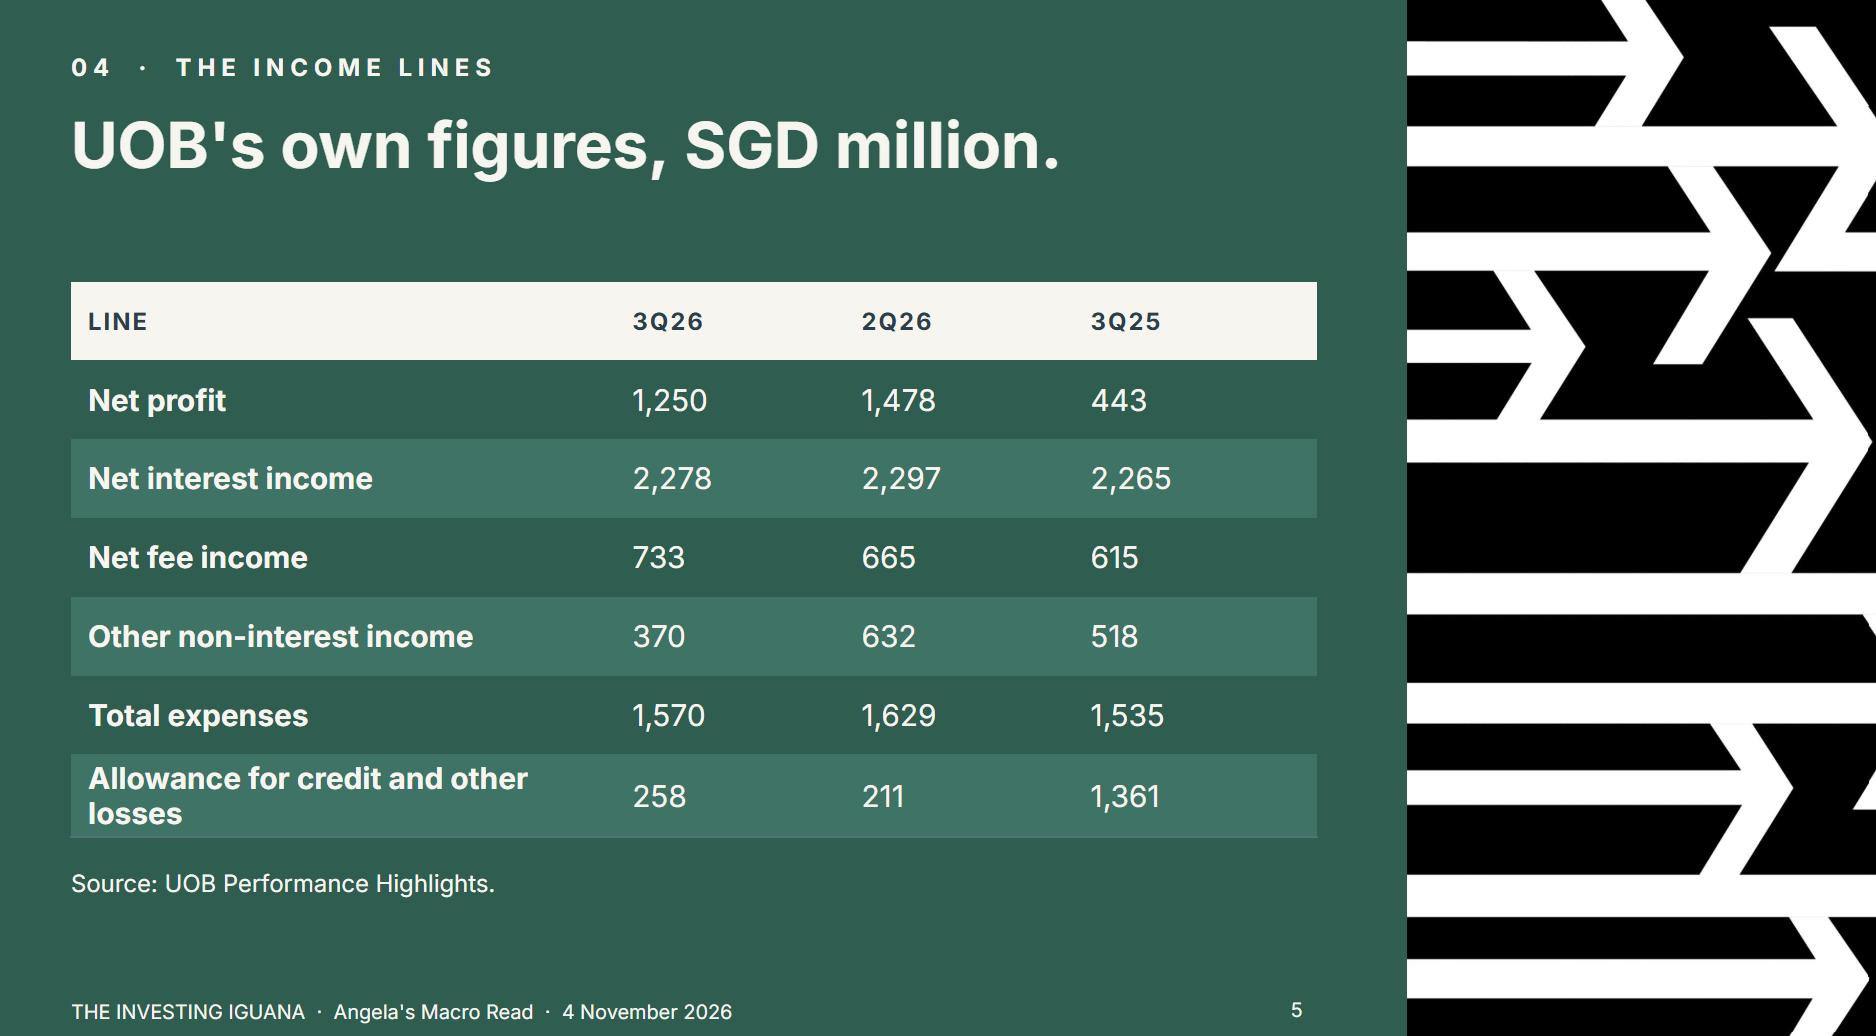
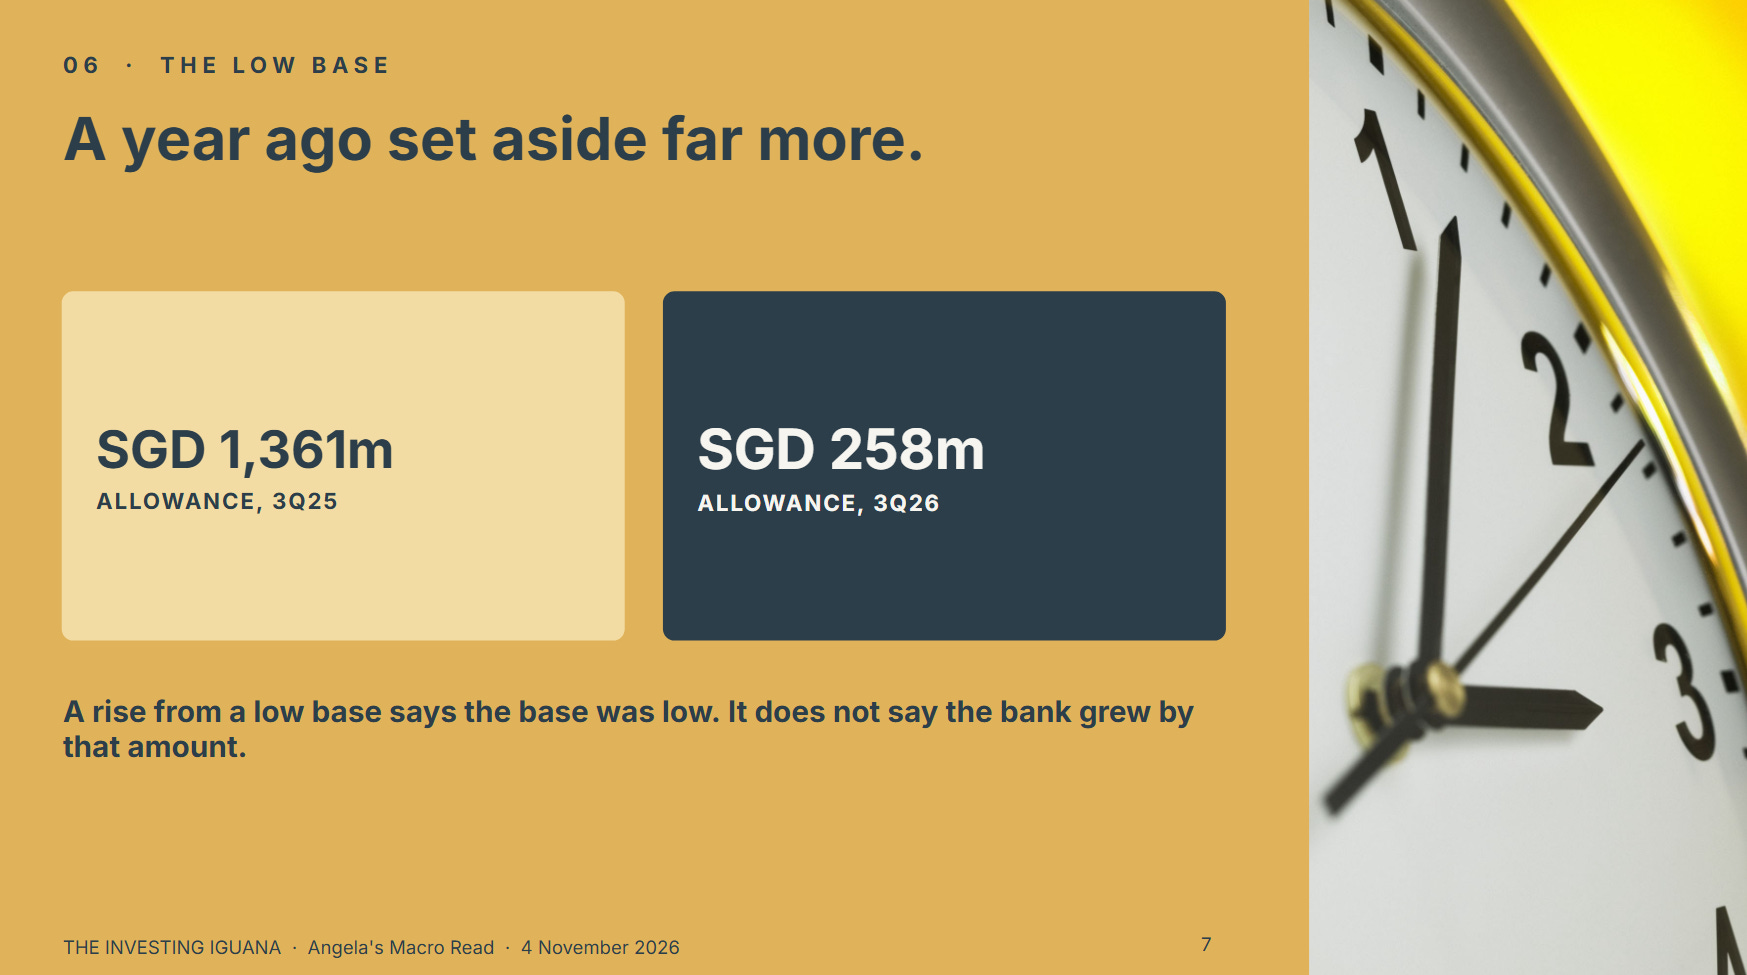
Two columns do different jobs. Against the previous quarter, profit fell. Against a year ago, it rose a long way, and the reason is in the allowance row: UOB set aside SGD 1,361 million in the third quarter of 2025 and SGD 258 million in this one. UOB describes the nine-month rise as recovering from a lower base that included pre-emptive provisioning. A rise from a low base says the base was low. It does not say the bank grew by that amount.
Why Profit Fell From the Last Quarter
UOB’s one-sentence reason
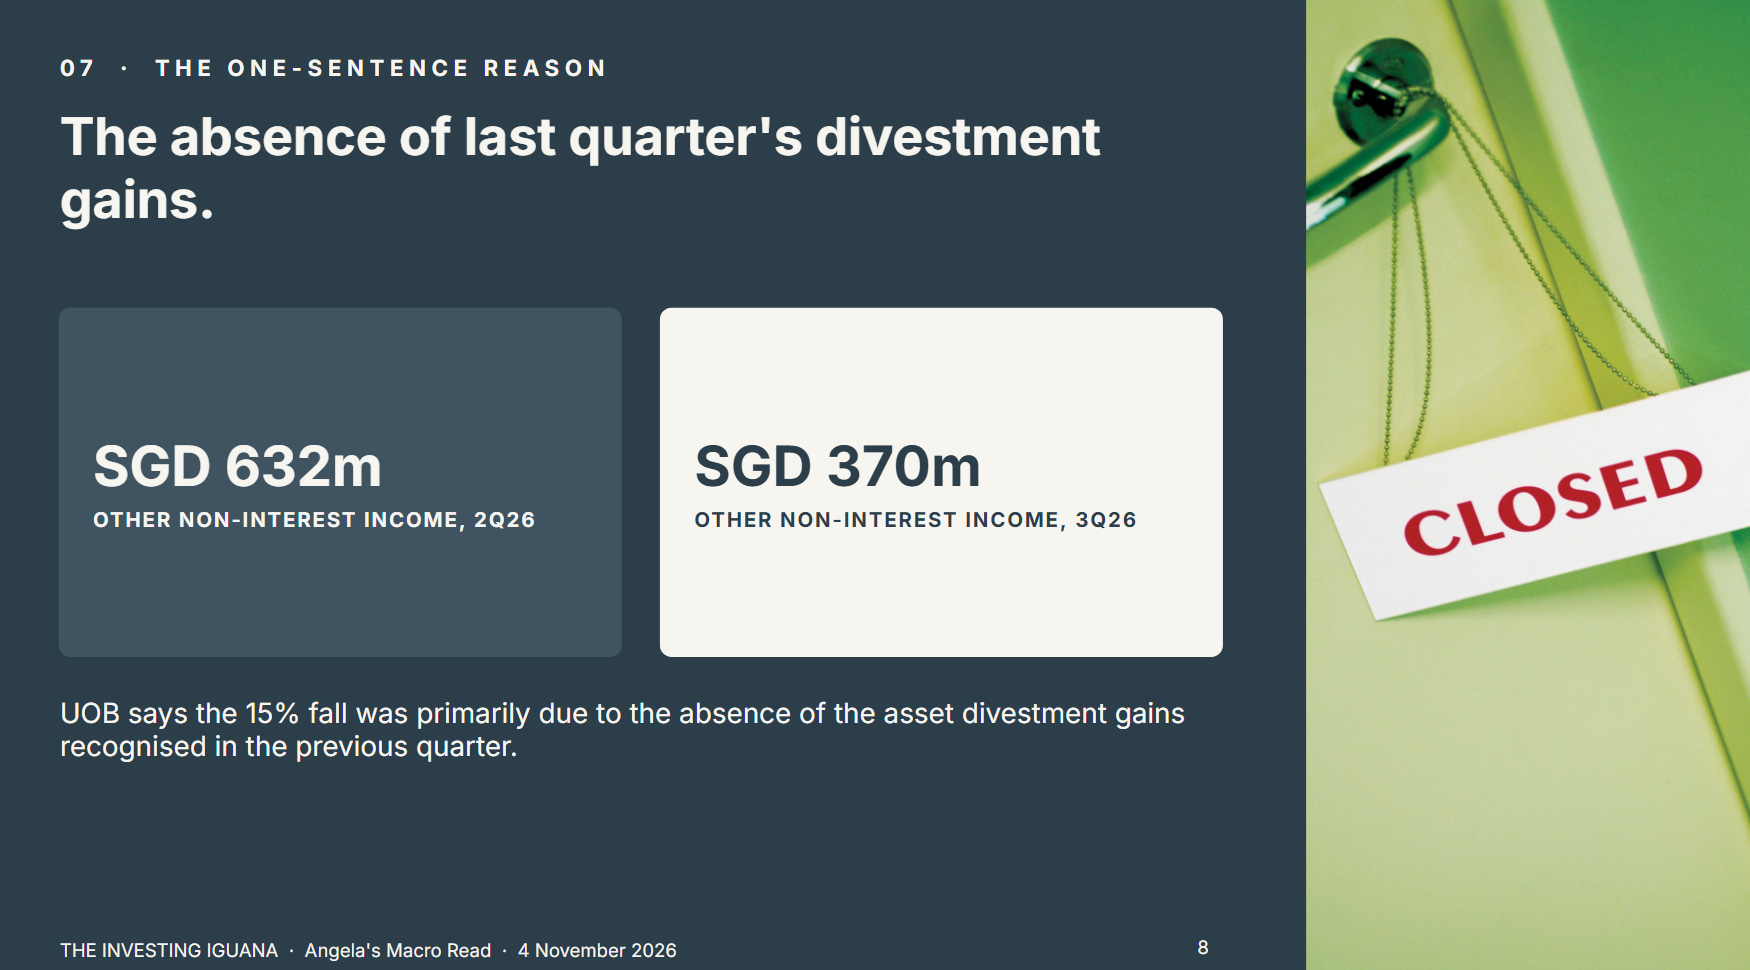
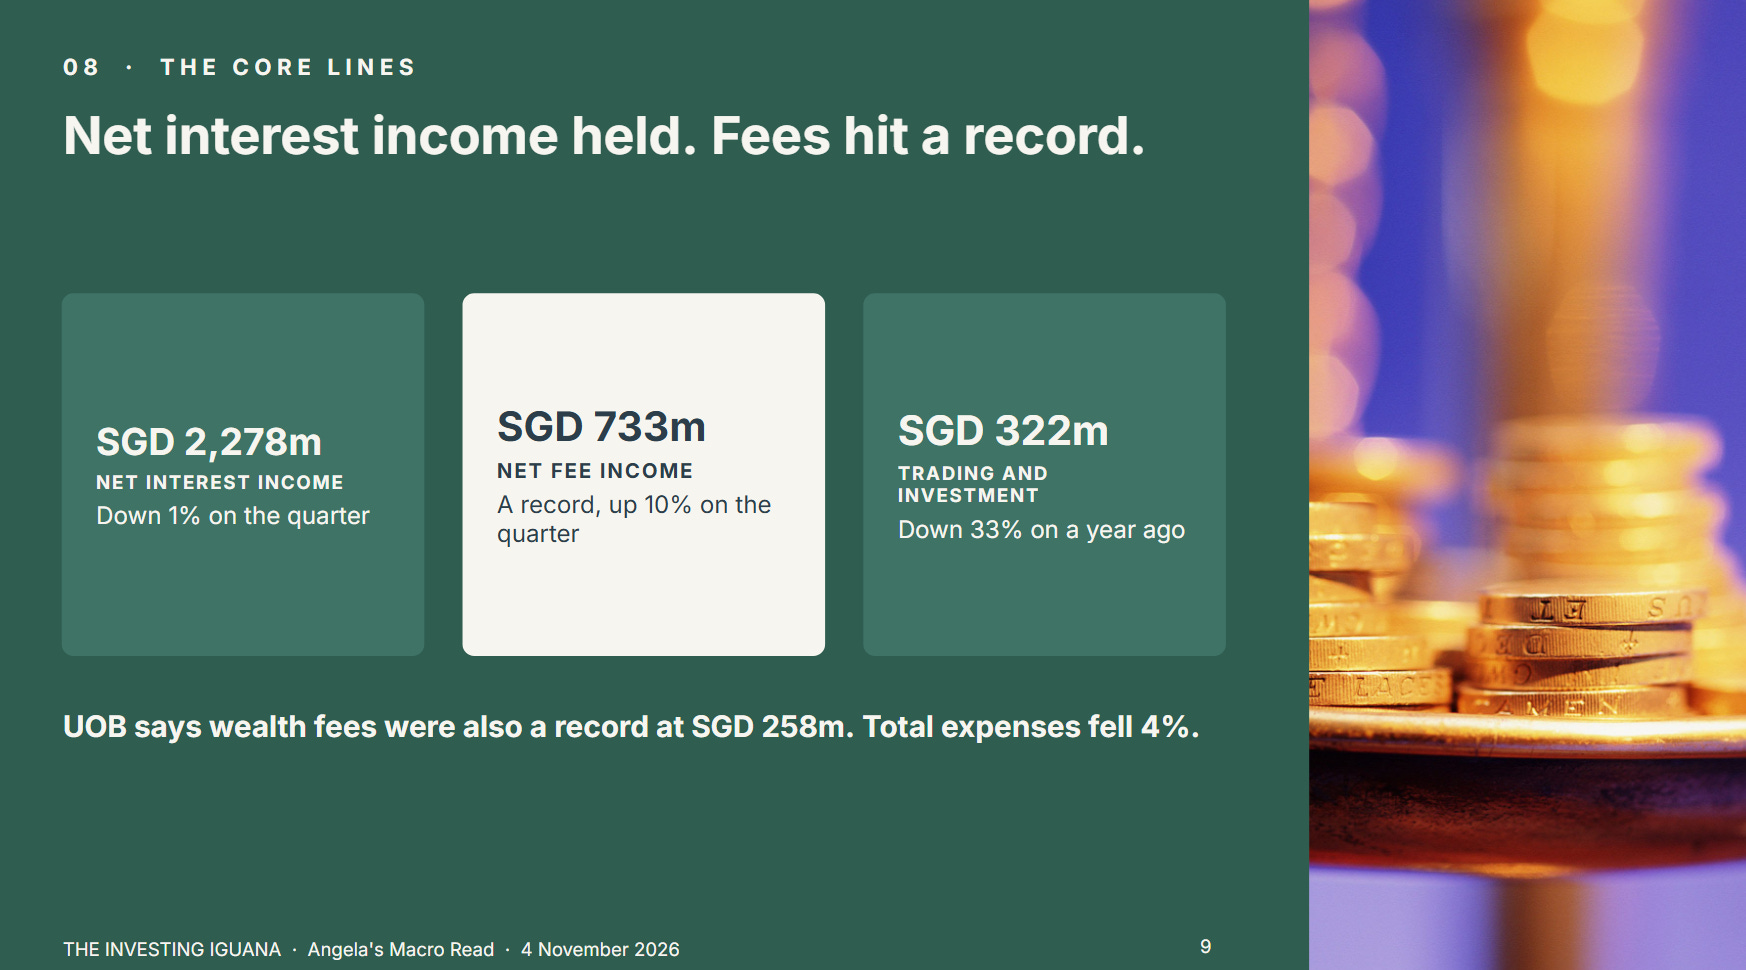
UOB says the fall of 15% from the second quarter was primarily due to the absence of the asset divestment gains recognised in that quarter. The table shows where it landed: other non-interest income was SGD 370 million against SGD 632 million. UOB adds that this line was also lower because of lower trading and investment income, which was SGD 322 million, down 33% from a year ago and described by UOB as moderating amid less favourable market conditions.
The lines that most readers think of as the core business held up better. Net interest income was SGD 2,278 million against SGD 2,297 million, down 1%, and UOB says loan growth of 3% offset the pressure on margin. Net fee income reached a record SGD 733 million, up 10% on the quarter and 19% on the year, and UOB says wealth fees were also a record at SGD 258 million. Total expenses fell 4%. Operating profit was SGD 1,811 million against SGD 1,965 million, 8% lower.
What analysts expected
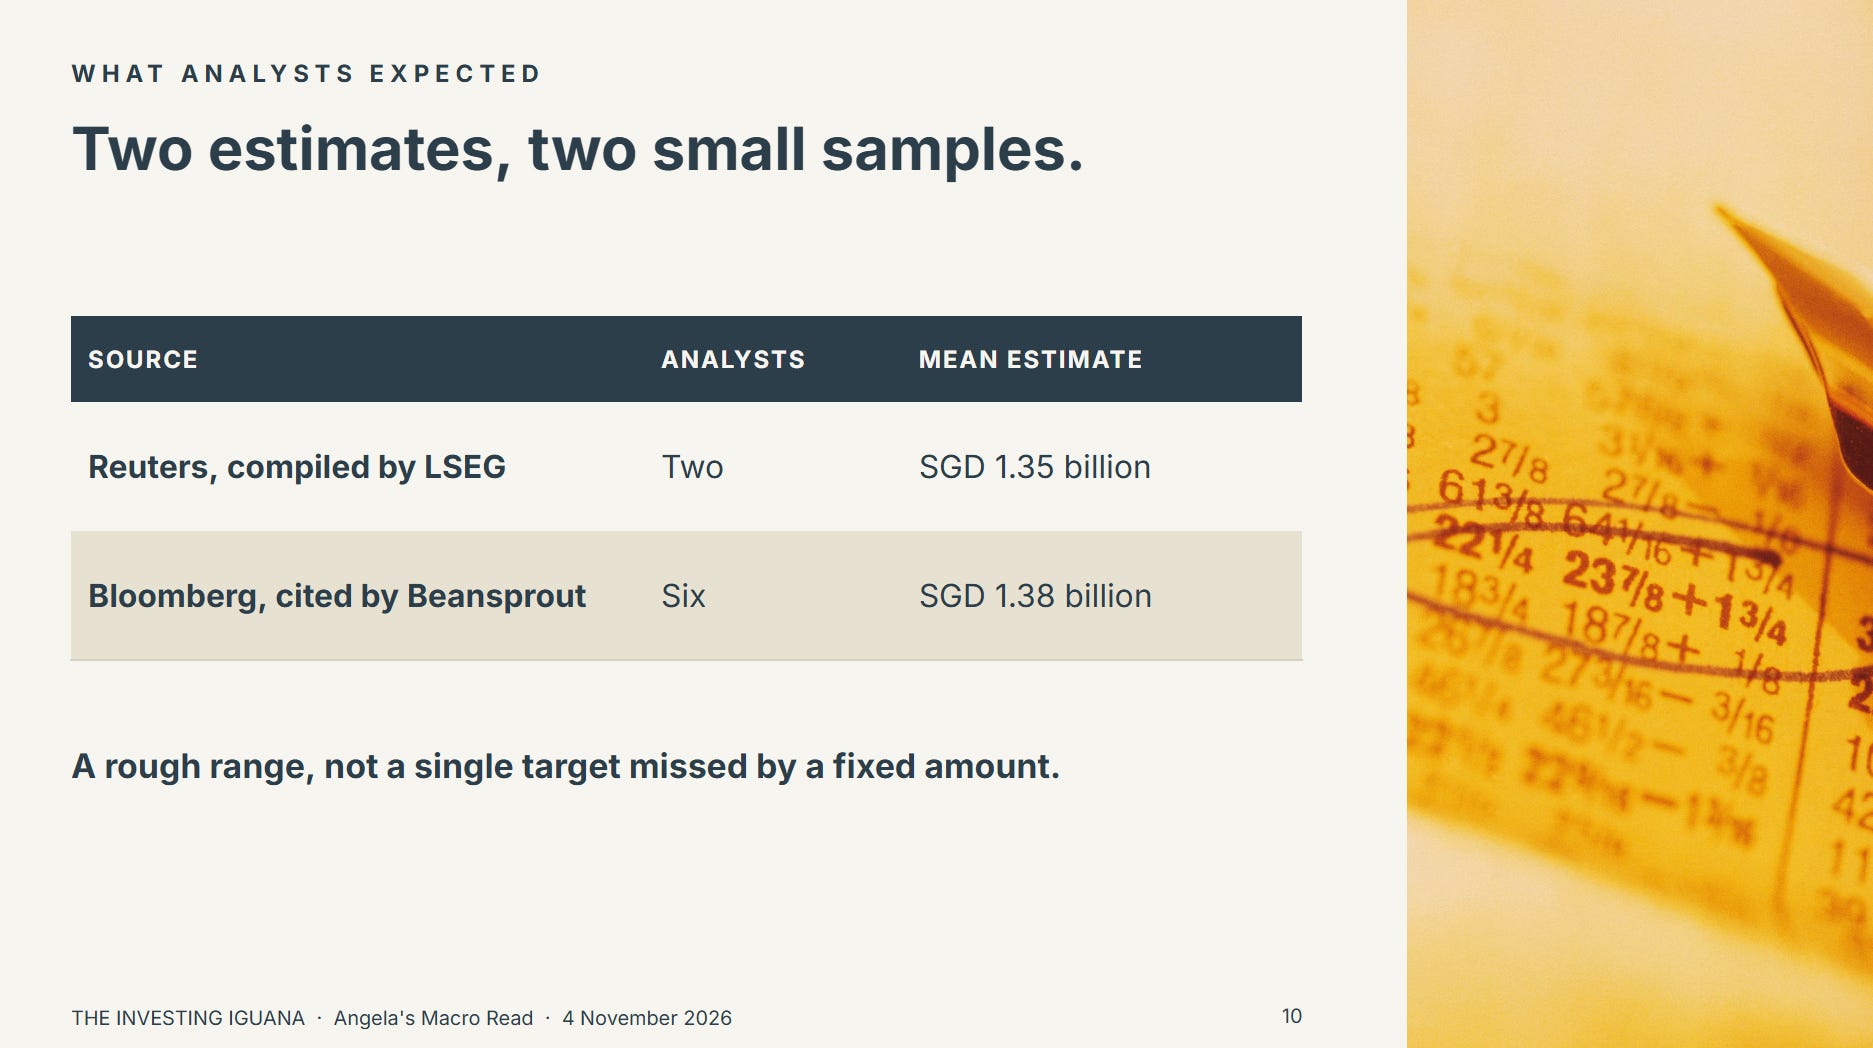
Reuters reported that the mean estimate of two analysts compiled by LSEG was SGD 1.35 billion, and the result fell short of it. Beansprout, in its summary of the results, cites a Bloomberg consensus of SGD 1.38 billion from six analysts. The two figures differ and both come from small samples, so I treat them as a rough range and not as a single target the bank missed by a fixed amount.
What the Margin Says
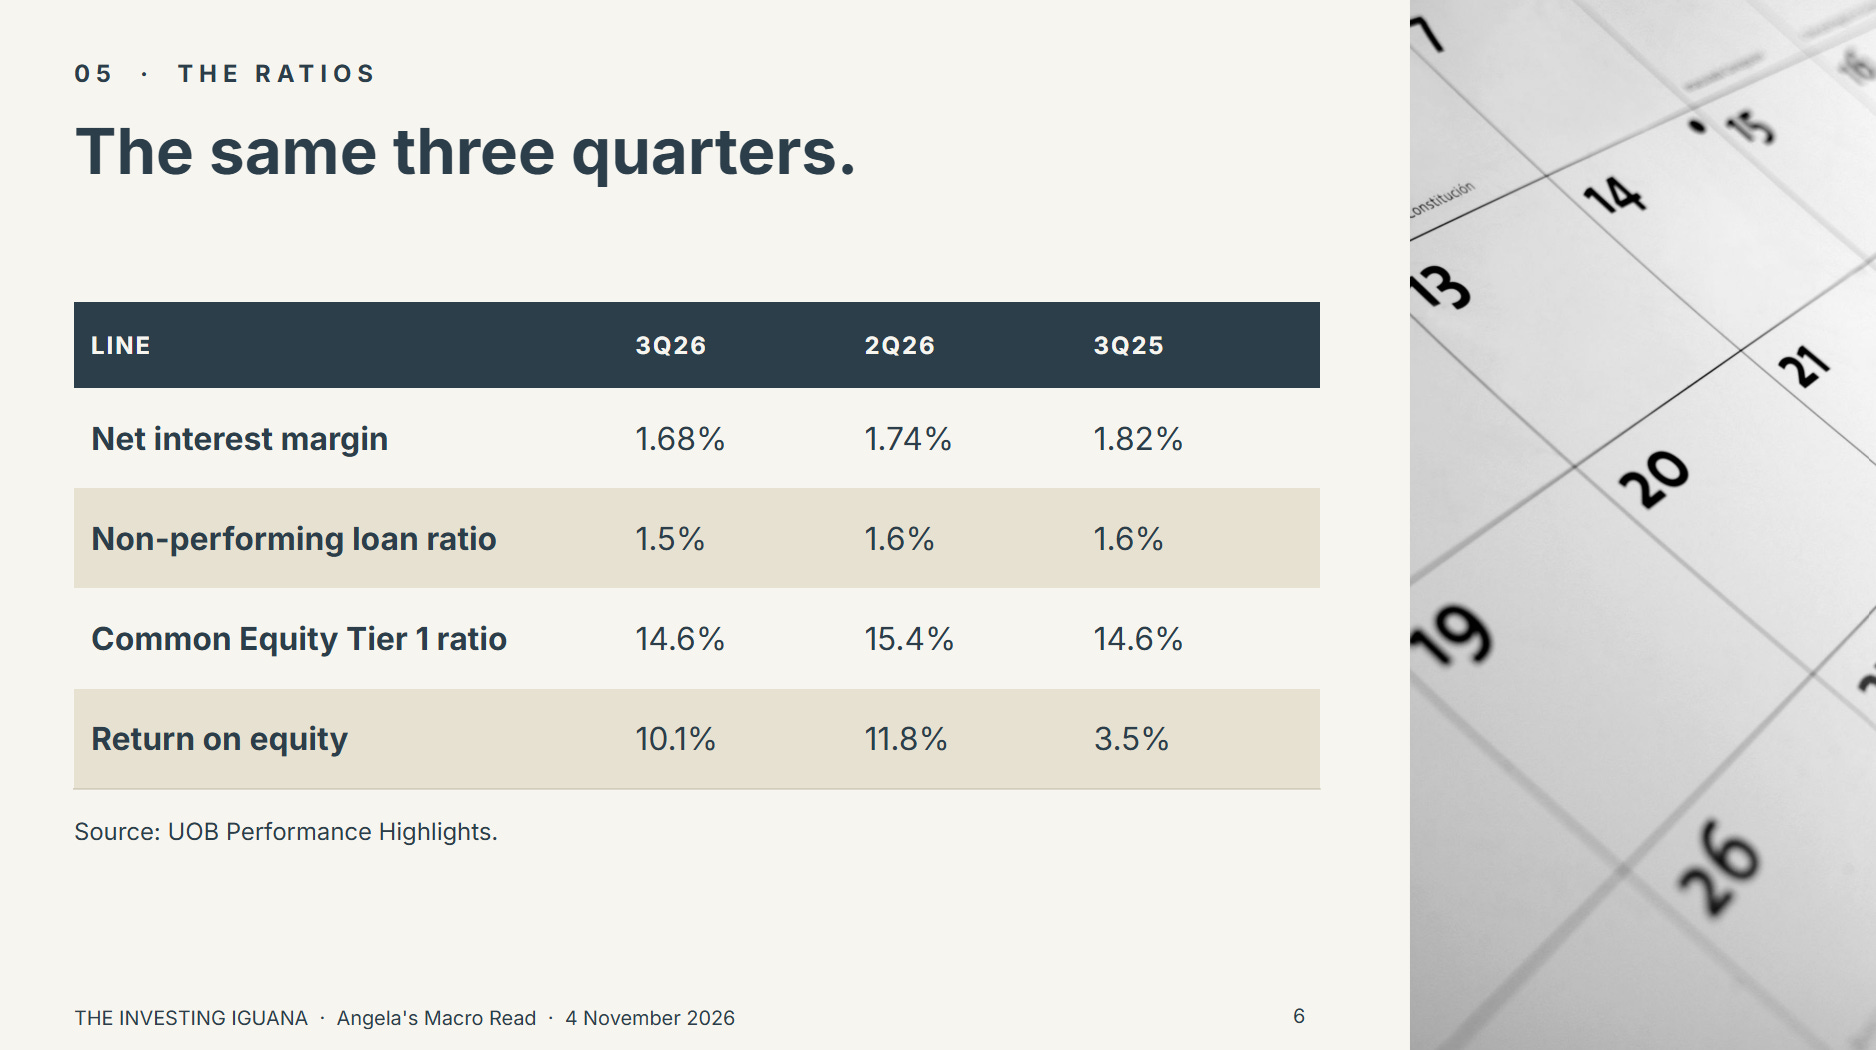
UOB’s net interest margin was 1.68%, six basis points lower than the 1.74% in the second quarter and 14 basis points lower than a year ago. For the nine months it was 1.75%.
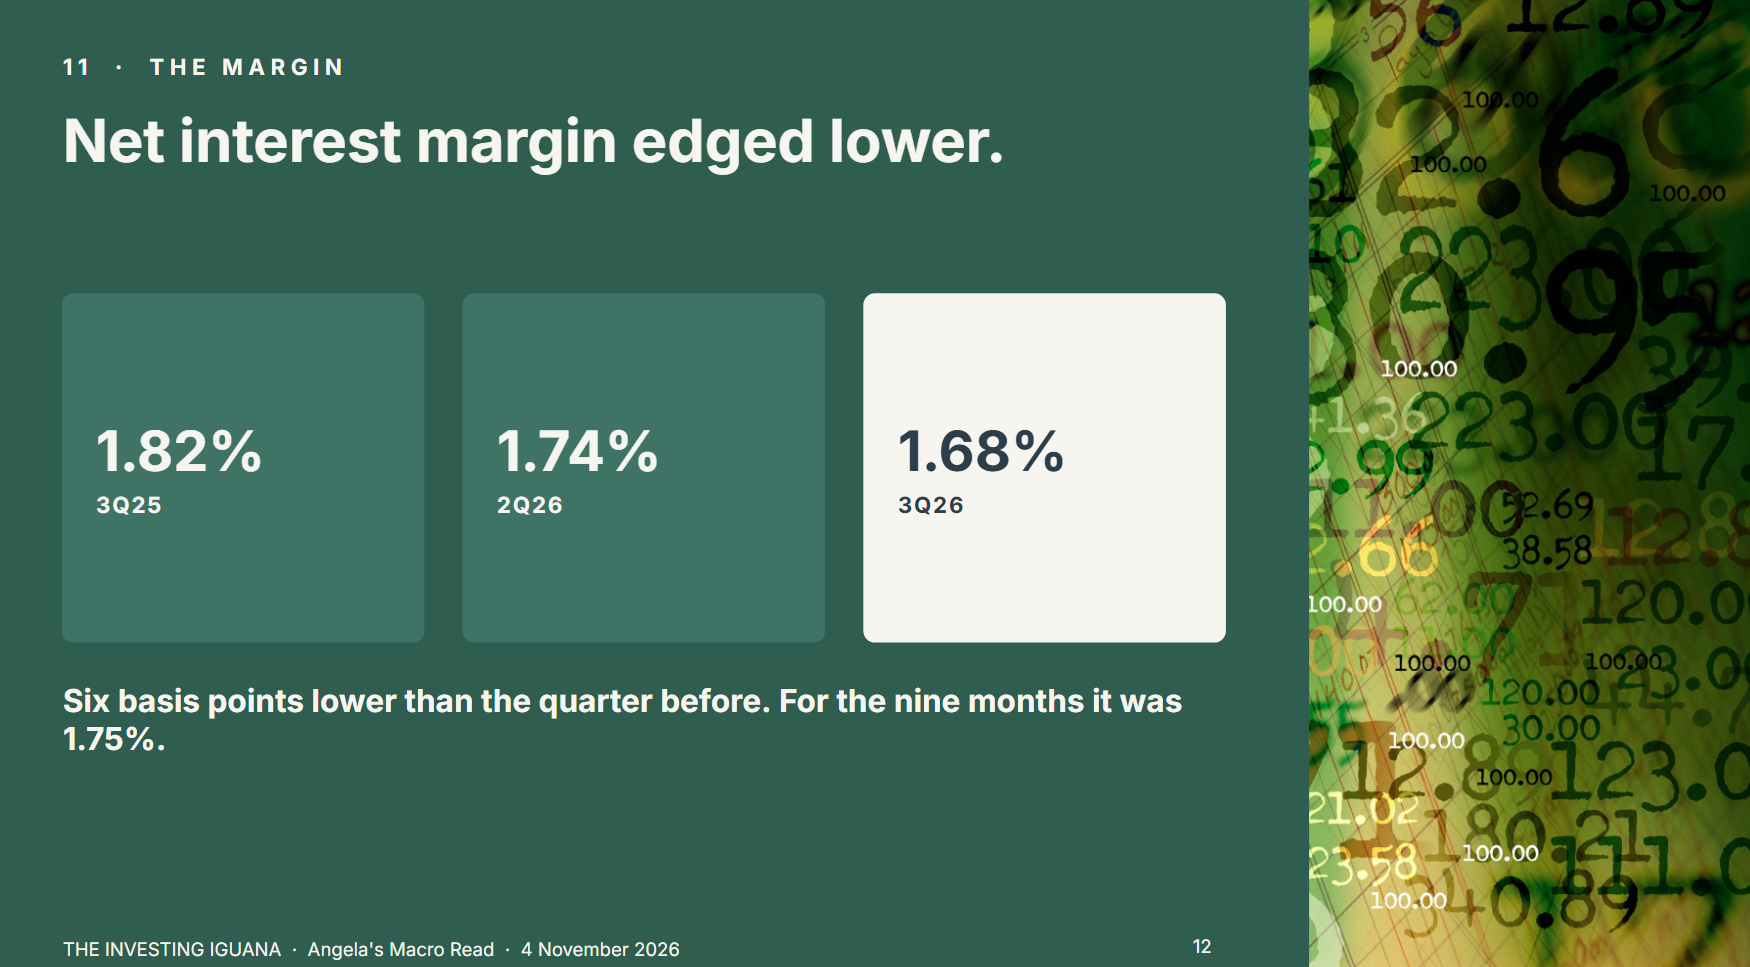
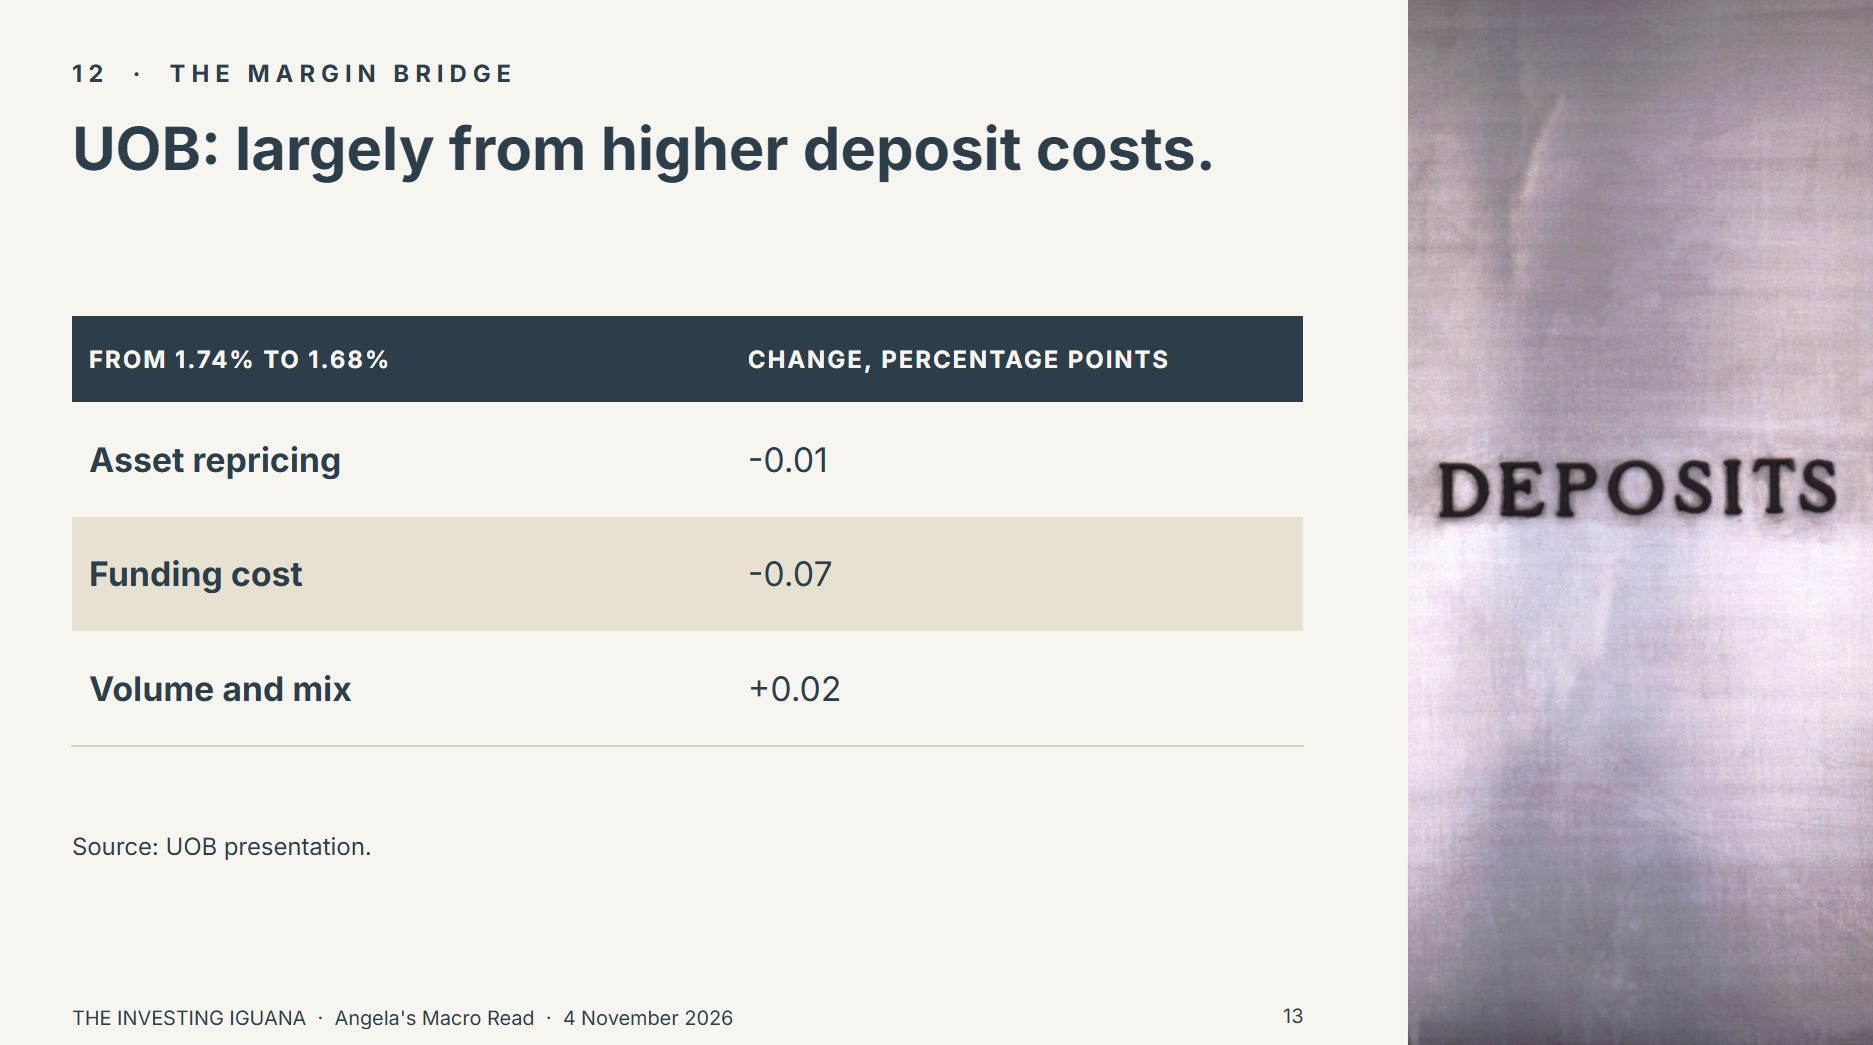
The presentation breaks the six basis points into three parts: asset repricing took off 0.01 percentage points, funding costs took off 0.07, and volume and mix added 0.02. UOB’s own heading for the slide says the margin declined largely from higher deposit costs. Two other lines on the presentation sit beside it. The loan margin was 1.95%, against 2.05% in the second quarter. And current and savings accounts, the cheaper kind of deposit, were 54.6% of deposits, against 58.4% at the end of last year.
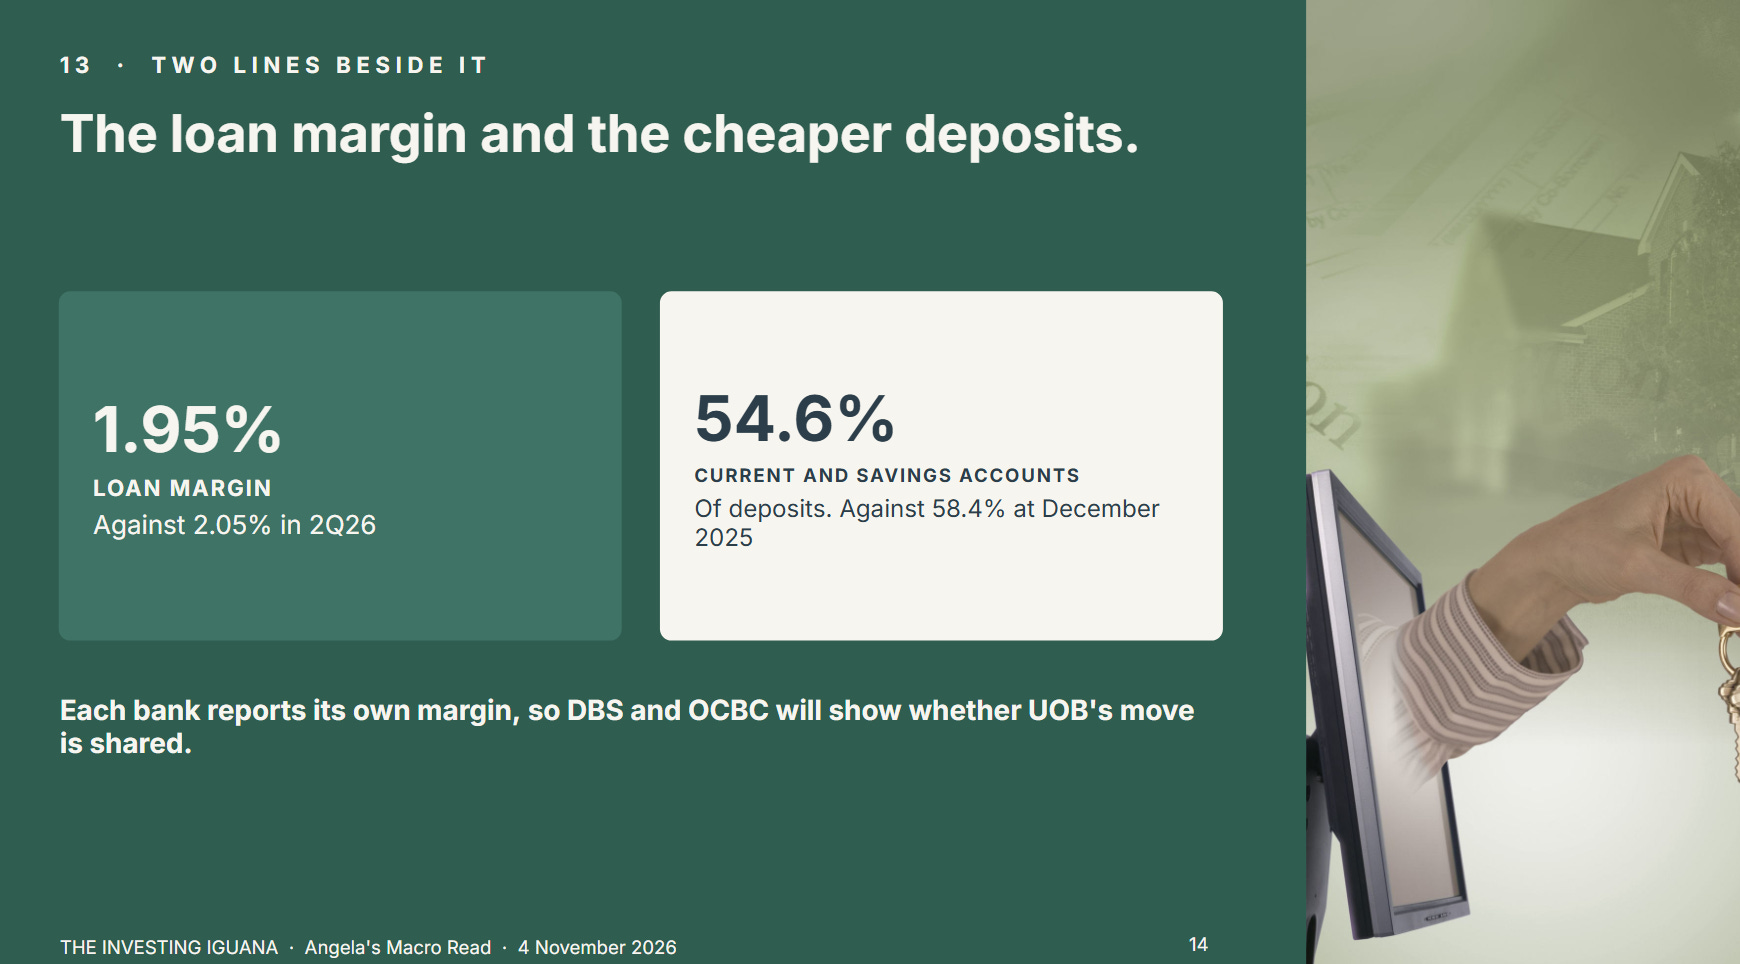
Each bank reports its own margin, so DBS’s and OCBC’s results will show whether UOB’s move is shared. I would not read much into one quarter’s change before then.
🟠 Angela’s Observation
When I read a results headline, I tend to carry one number away, and for years that number was whether the bank had beaten or missed. What I did not carry away was why. The reason UOB gives for this quarter’s fall sits in a single sentence near the front of its own highlights, and it took me longer to find than the headline took to read. The sentence is plain, and it changes what the headline means. When I close a results page, am I keeping the number or the reason?
If you are reading this as a free subscriber, thank you. If you are not yet one, the credit and capital figures, the outlook UOB gave and the list of what the release does not say are in the rest of this piece, and subscribing to the free list is how you keep reading it.