



UOB Holders Now Collect About 10% Less Than a Year Ago. A New Buyer Starts at 3.69%.
UOB’s final dividend followed its profit down 23% at a payout of about 50%. Here is what that does to a holder’s income and to a new buyer’s yield at the 2 October close.
A year ago, a UOB shareholder collected SGD 1.77 per share in ordinary dividends over 12 months. Today the same shareholder collects SGD 1.59.
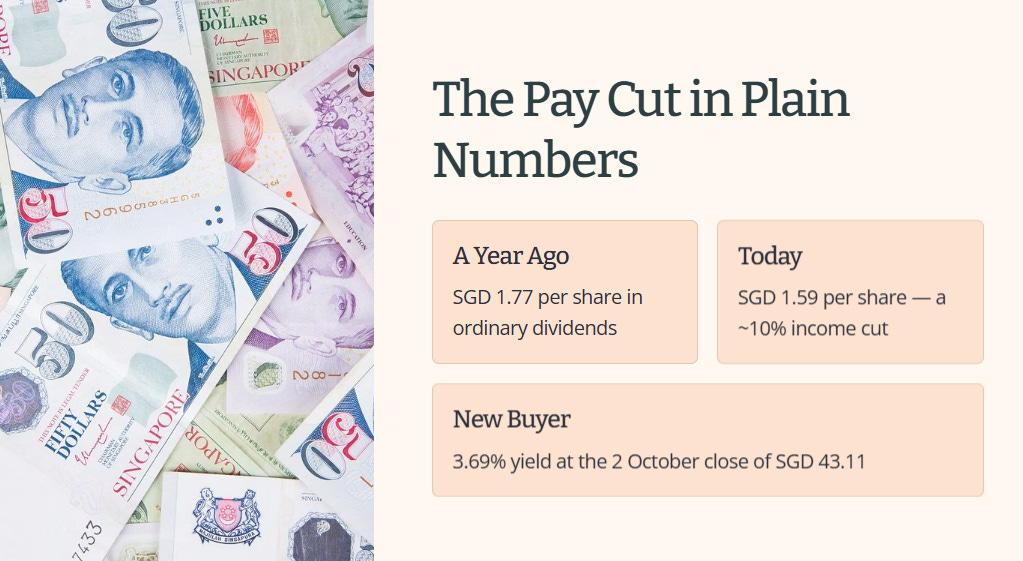
If you own UOB, that is a pay cut of about 10% on income you may have been counting on. If you are considering buying it, the yield on the screen is a number built from those lower payments, divided by a higher price. I have worked through both readings of the same SGD 1.59, using UOB’s own results releases for the dividend history and the payout, and this piece sets out what each reader should take from it.
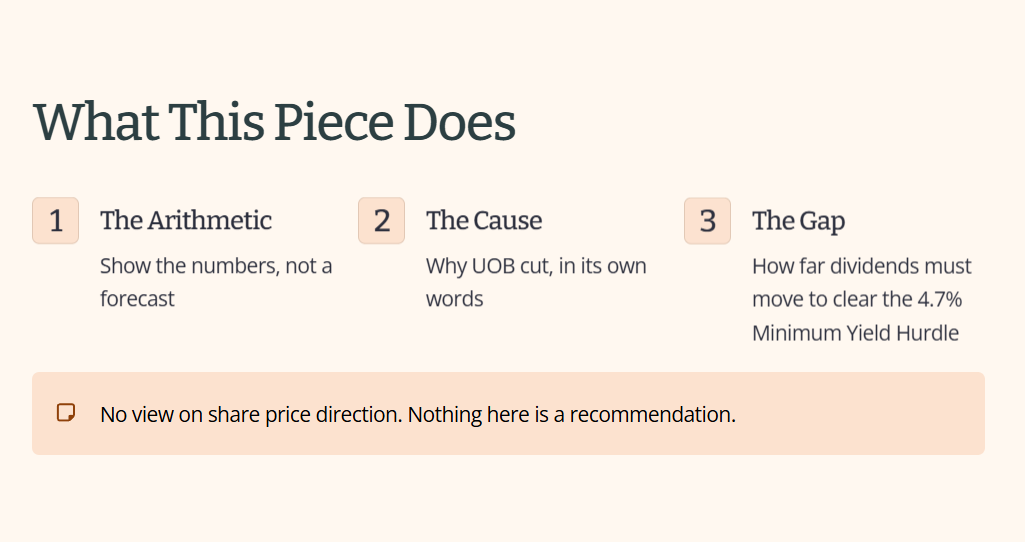
I have no view on where UOB’s share price goes next, and nothing here is a recommendation. What I can do is show the arithmetic, the cause of the cut as UOB itself describes it, and how far the dividend would have to move to reach my 4.7% Minimum Yield Hurdle.
What UOB Paid, and What Changed
From a Lower Dividend to a 3.69% Yield
What It Would Take to Close the Gap
What the “About 50%” Payout Includes and Excludes
The Balance Sheet Behind the Dividend
Legacy Holders vs. Fresh Capital
Iggy’s Insight Callout
Iggy’s Elite Read
What UOB Paid, and What Changed
The easiest way to see the change is to line up the two 12-month windows. All figures are ordinary dividends per share. A special dividend is a one-off payment, and I leave specials out of my governing yield.
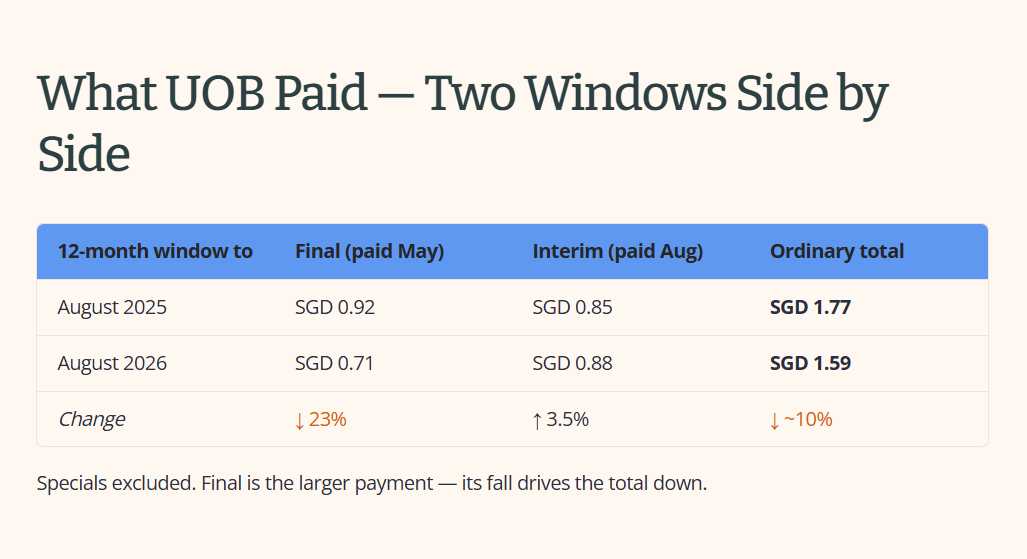
The final dividend for FY2025 was SGD 0.71, down from SGD 0.92 for FY2024. The interim for the first half of FY2026 then rose from SGD 0.85 to SGD 0.88. The two moves point in opposite directions, and the final is the larger payment, so the trailing total fell.
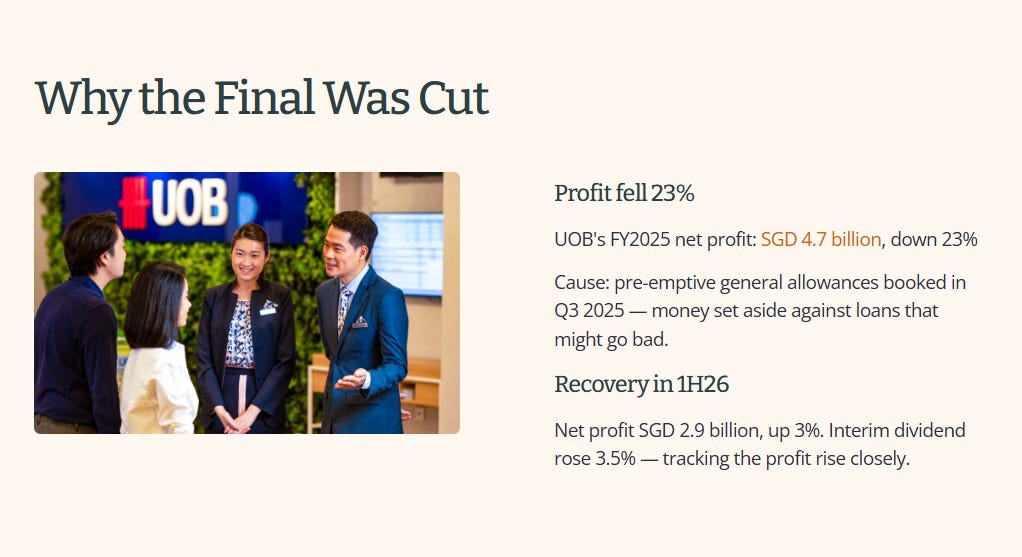
The reason for the cut sits in the profit line. UOB’s net profit for FY2025 fell 23% to SGD 4.7 billion, which UOB attributed to pre-emptive general allowances it set aside in the third quarter of 2025. An allowance is money a bank sets aside against loans that might go bad, and it reduces reported profit in the quarter it is booked. In the first half of FY2026 UOB’s net profit was SGD 2.9 billion, up 3%, and the second quarter alone was SGD 1.5 billion, up 10%. The interim dividend rose 3.5%, which is close to that 3% rise in half-year profit.
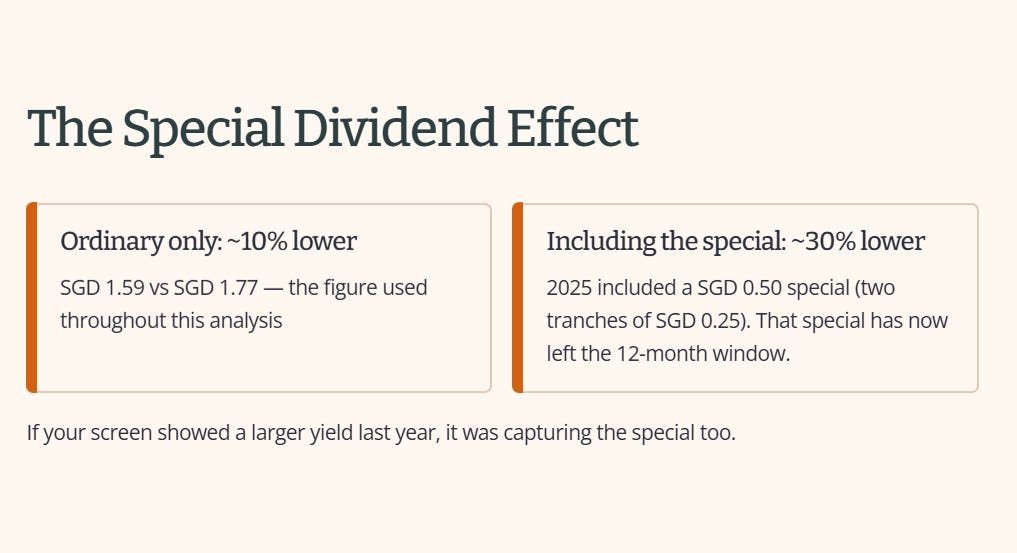
One note on the basis. The SGD 1.59 versus SGD 1.77 comparison counts ordinary payments only. In 2025 UOB also paid a special dividend of SGD 0.50 per share, in two tranches of SGD 0.25 in May and August. That special sat inside the window a year ago and has now left it. Counting it, the cash received over the same period is about 30% lower, not 10%. I do not count specials in the yield, so the 10% figure is the one I use, but a reader whose screen showed a larger yield last year was seeing the special too.
From a Lower Dividend to a 3.69% Yield
A trailing dividend yield divides the last 12 months of ordinary payments by today’s share price. At the 2 October close of SGD 43.11, UOB’s SGD 1.59 gives 3.69%.
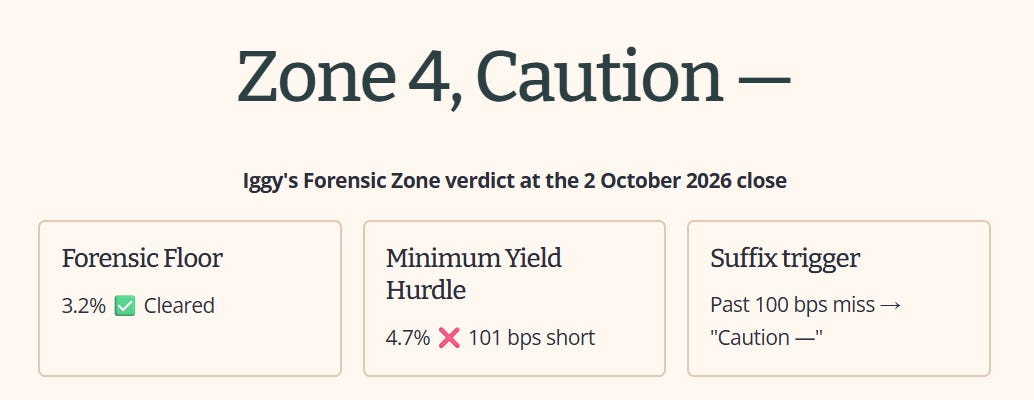
The Forensic Floor is 3.2% and the Minimum Yield Hurdle is 4.7%. At 3.69% UOB clears the Floor and sits 101 basis points below the Hurdle. To reach 4.7% at today’s price, ordinary dividends would need to be about SGD 2.03 over 12 months. That is a rise of about 27% from SGD 1.59.
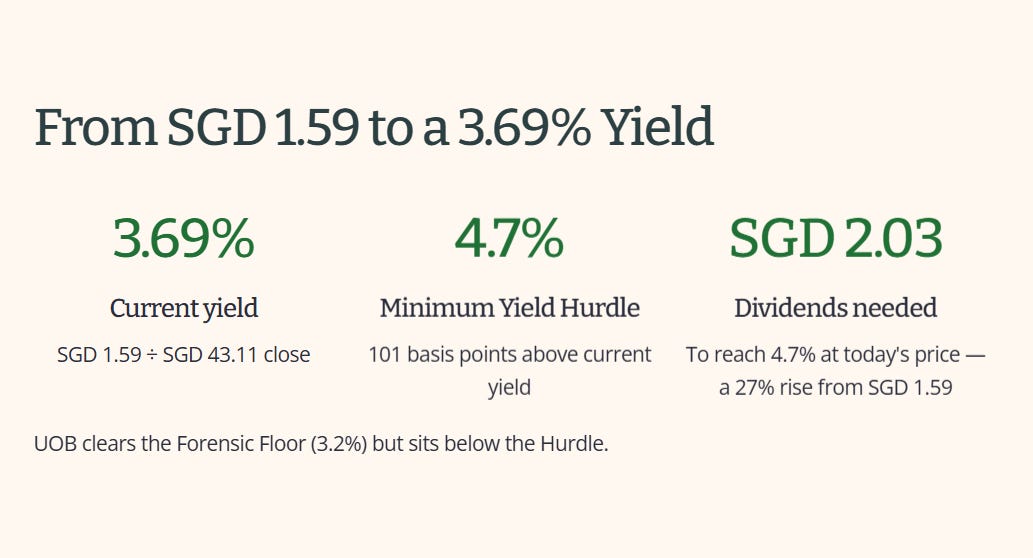
Put in money terms, SGD 10,000 placed in UOB at SGD 43.11 receives about SGD 369 a year from the ordinary dividends of the last 12 months. At 4.7% the same SGD 10,000 would receive SGD 470, so the shortfall is about SGD 101 a year per SGD 10,000.
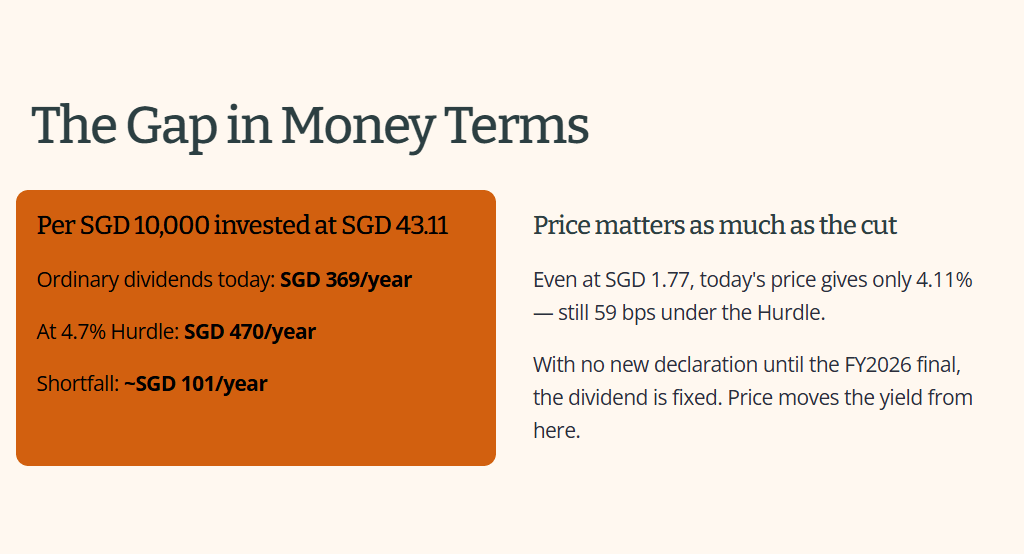
The cut explains only part of this. If UOB had still been paying SGD 1.77, the yield at today’s price would be 4.11%, which is still 59 basis points under the Hurdle, so the price matters as much as the cut. With no new declaration until the FY2026 final, the dividend is fixed, and any rise in the price lowers the yield while any fall raises it.
💡 Insight Callout
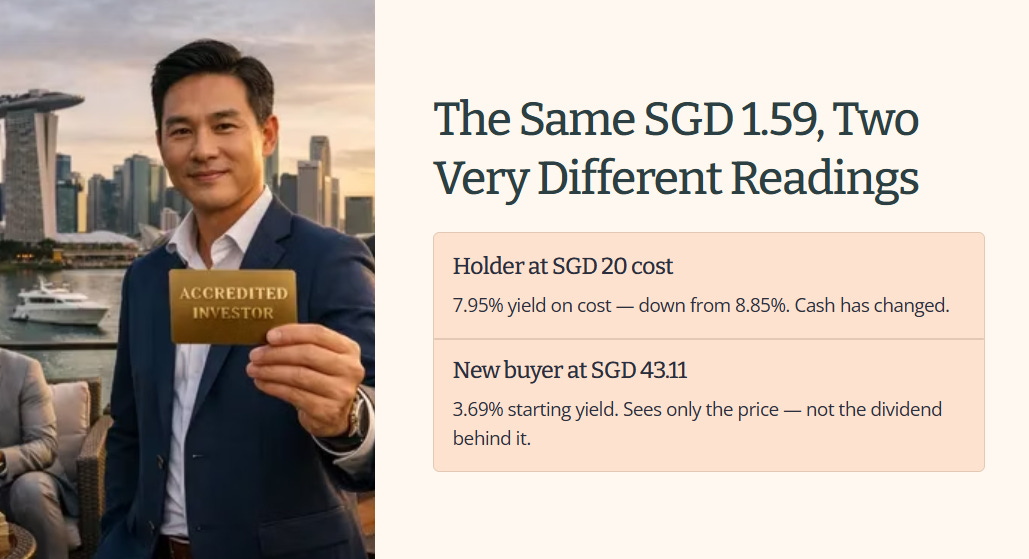
The same SGD 1.59 reads differently depending on who is holding it. For someone who paid SGD 20 a share, it is a 7.95% yield on cost, down from 8.85% a year ago. For someone buying today at SGD 43.11, it is 3.69%. Neither number is wrong. A dividend cut hurts the existing holder in dollars and the new buyer in the starting yield, but only the holder has seen the cash change. The new buyer sees only the price, and a price on its own says nothing about the dividend behind it.
Iggy’s Forensic Zone: Zone 4, Caution -, at the 2 October 2026 close.
You Don’t Need The Jargon To Get The Edge
Not everyone wants to read balance sheets for fun. Sometimes you just want to know what’s actually happening with your money, in plain English, without doing the digging yourself. That’s the idea behind Paid Membership.
Members get the complete forensic reasoning behind every zone verdict, not just the zone number and label. The full Red Zone watchlist, the forensic cheatsheets, every walkthrough, laid out in plain language instead of compressed into a one-line verdict.
With the YouTube/Substack Combo at S$12/month, less than 2 kopi and kaya toast sets at Raffles Place, you get the reasoning behind the number, explained the way you’d want a friend to explain it, not just the headline everyone else stops at.
What It Would Take to Close the Gap
There are two routes, and they are arithmetic only, not forecasts.
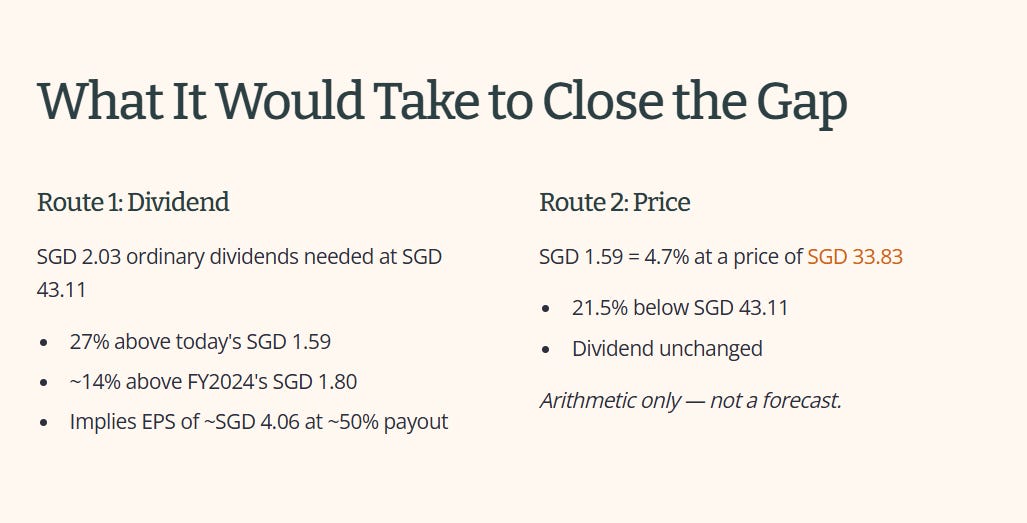
The first is the dividend. About SGD 2.03 of ordinary dividends over 12 months reaches 4.7% at SGD 43.11. For scale, that is about 13% above the SGD 1.80 UOB paid for FY2024, and 27% above today’s SGD 1.59. At a payout near 50% of adjusted earnings, which is how UOB states it, SGD 2.03 of dividends corresponds to earnings per share of about SGD 4.06, compared with SGD 3.56 in FY2024 and SGD 2.76 in FY2025 as reported. That is roughly 14% above the FY2024 figure. Earnings at that level are a function of NIM, loan growth and credit costs, and I am not forecasting any of them.
The second is the price. SGD 1.59 equals 4.7% at a price of about SGD 33.83, which is 21.5% below SGD 43.11. I am not saying the price will go there, only that this is the distance on the price side, with the dividend unchanged.
The table below shows how UOB’s gap compares with the other two Singapore banks from my Sunday piece, on the same 2 October basis.
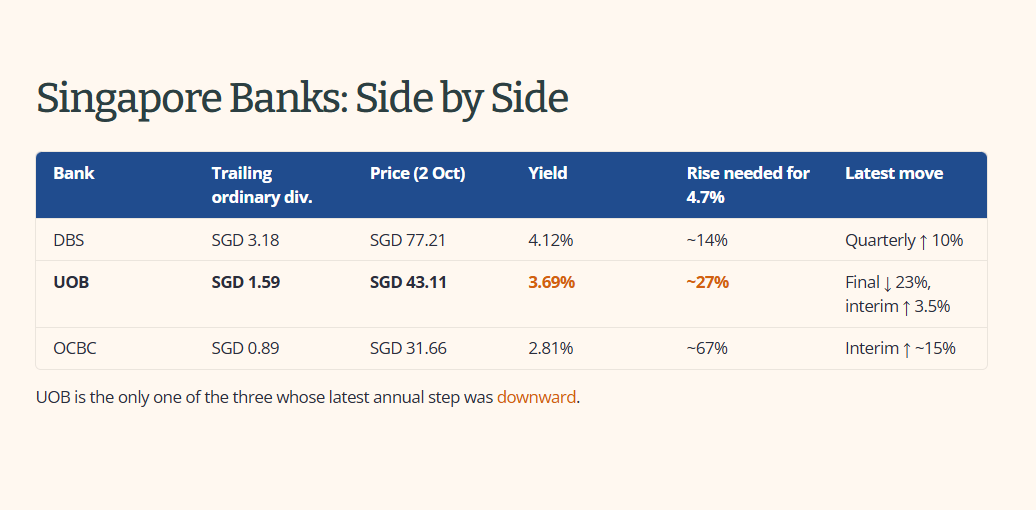
DBS’s SGD 3.18 includes its SGD 0.15 quarterly capital return, which I count as a recurring distribution, and OCBC’s SGD 0.89 excludes its SGD 0.16 special. UOB is the only one of the three whose latest annual step was downward.
🔒 What’s Next
The SGD 2.03 route and the price route are both set out above. UOB’s own results release says how the final dividend was calculated, and that detail decides how realistic the SGD 2.03 is.
