




UOB Just Raised Its Dividend. Here’s Why the Yield Actually Fell.
A closer trailing-twelve-month read on what the interim raise did, and didn’t, fix.
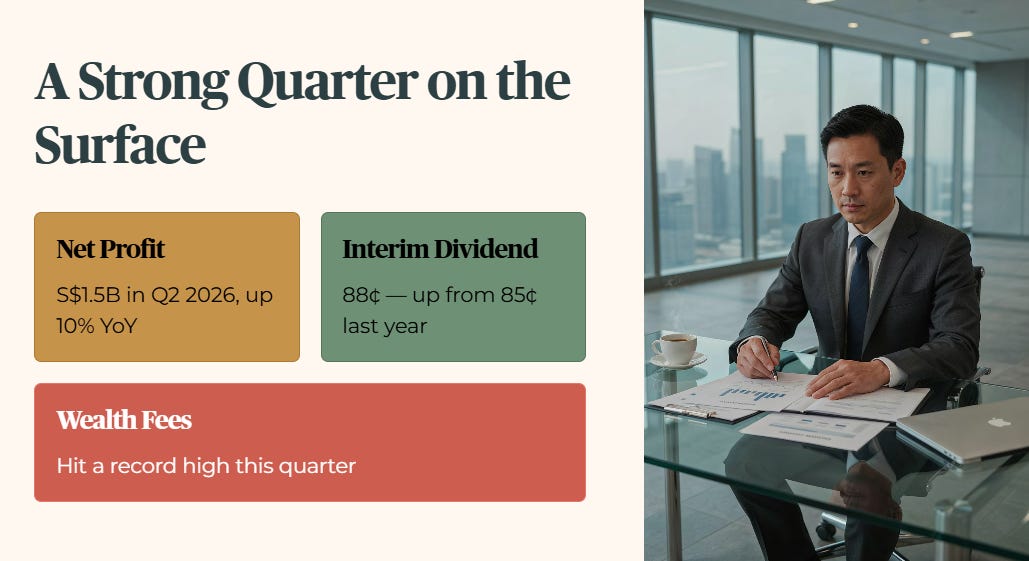
UOB posted a strong quarter. Net profit hit S$1.5 billion in the second quarter of 2026, up 10% year on year. The interim dividend rose to 88 cents from last year’s 85. Wealth fees hit a record. On the surface, this looks like a bank firing on every cylinder.
I get it, a raised dividend is genuinely good news, and if the headline number is the only thing you’re tracking, this quarter reads as unambiguous progress. But my job isn’t to read the headline dividend in isolation. It’s to build the actual trailing twelve-month income figure a retiree would be earning today, and test that against the 4.7% minimum yield hurdle this framework requires before any stock qualifies for a retirement portfolio.
That number tells a different story than the interim raise alone suggests.


Section 1 — What UOB Actually Reported
Section 2 — Forensic Screen: Dividend Yield
Section 3 — Forensic Screen: Capital and Asset Quality
Financial Health Checklist
Section 4 — The Suffix Update
Iggy’s Insight Box 1
Section 5 — The Dividend Trajectory
Iggy’s Insight Box 2
Section 6 — What To Watch Next
Closing — The Forensic Stance
Peer Comparison
Section 1 — What UOB Actually Reported
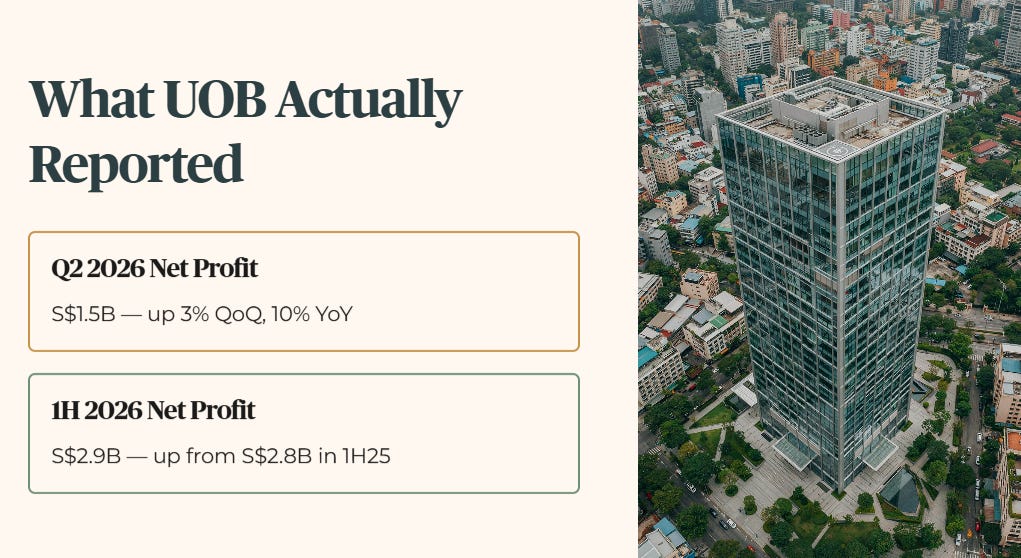
UOB Group reported second quarter 2026 results on 6 August 2026. Group net profit after tax reached S$1.5 billion, up 3% quarter on quarter and 10% year on year. First-half net profit came in at S$2.9 billion, up 3% from S$2.8 billion in 1H25.

Two structural moves sit alongside the quarterly numbers. UOB completed a strategic divestment generating a purchase consideration of S$555 million and a pre-tax gain of approximately S$330 million, adding roughly 14 basis points to the Group CET1 ratio. Separately, UOB entered a strategic partnership with Allianz Global Investors intended to strengthen its wealth management franchise and open-architecture investment offerings.
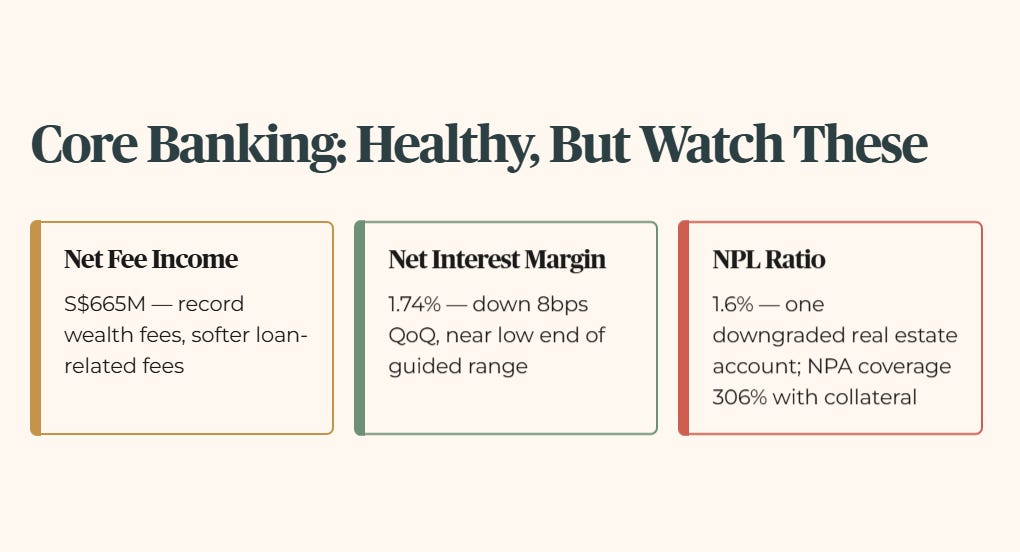
Net fee income rose to S$665 million for the quarter, underpinned by record wealth fees, though loan-related fees from capital markets activity softened. Net interest margin declined 8 basis points quarter on quarter to 1.74%, driven by asset yield compression amid lower benchmark rates. The NPL ratio ticked up to 1.6%, which the bank itself attributes to the downgrade of one closely monitored real estate account, with NPA coverage at 88%, or 306% once collateral is taken into account.
None of this is in dispute, and the core banking business is genuinely healthy. The question this piece asks is narrower: does the dividend, as it currently stands, clear the bar this framework sets for retirement-grade income.
Section 2 — Forensic Screen: Dividend Yield
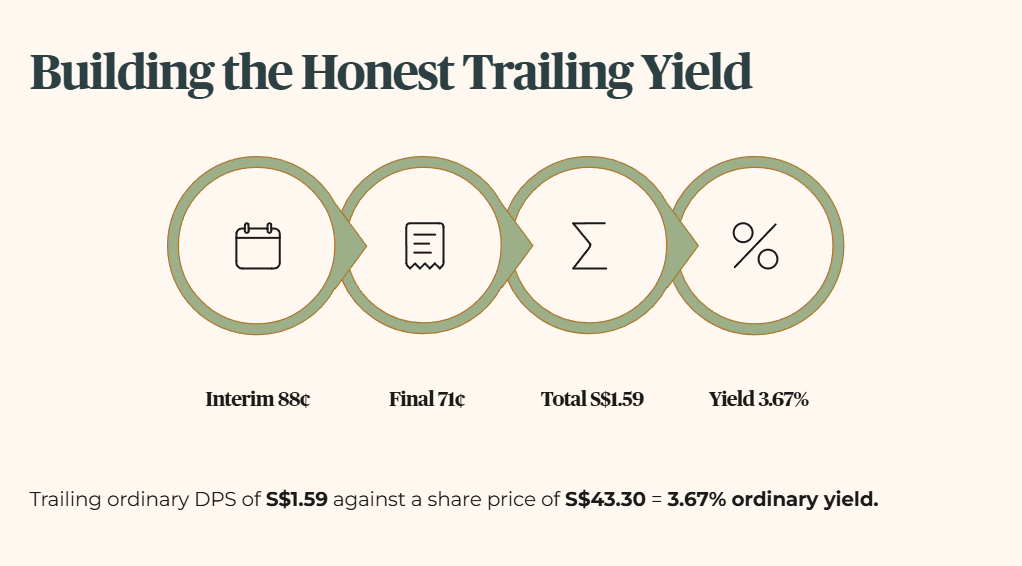
UOB declared an interim dividend of 88 cents per ordinary share for 1H26, maintained at a 50% payout ratio, up from 85 cents in the 1H25 interim. Building the honest trailing twelve-month ordinary figure means pairing this new interim with the most recent final dividend, UOB’s FY2025 final of 71 cents. That gives a trailing ordinary DPS of S$1.59.
Against the current price of S$43.30, that works out to an ordinary yield of 3.67%.
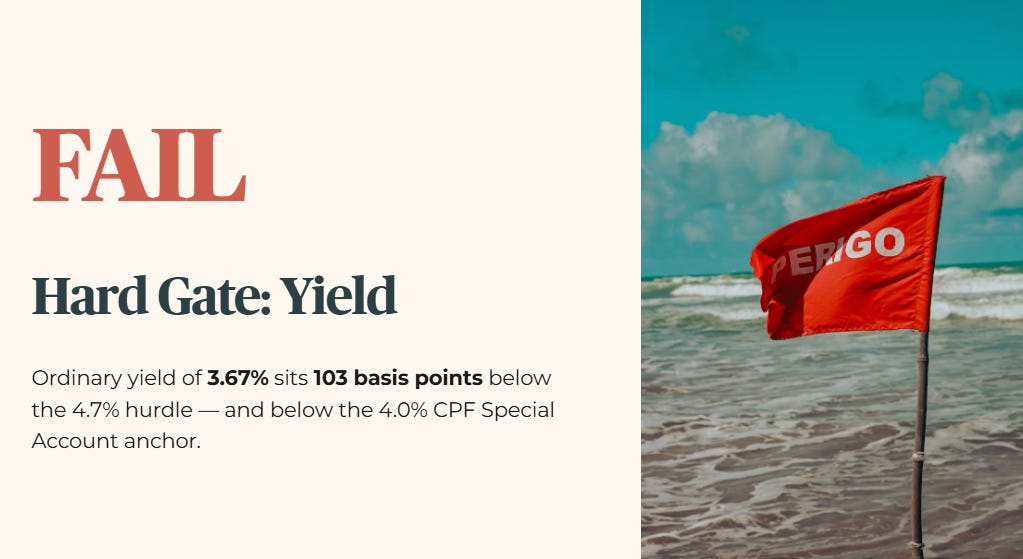
Hard Gate Result: FAIL. The ordinary yield sits 103 basis points below the 4.7% minimum yield hurdle, and below the 4.0% CPF Special Account anchor.
The special dividend history is worth separating out explicitly, because it changes what the “real” number looks like depending on which basis you use. UOB paid two 25-cent special tranches, in FY2024 and FY2025, as part of a stated 90th anniversary capital return package, now complete.
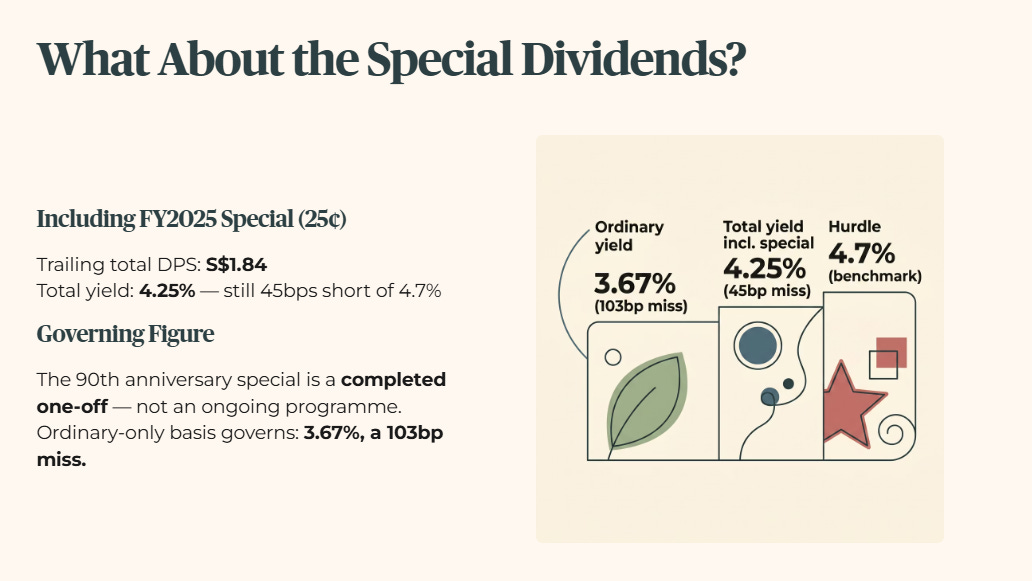
Including the FY2025 tranche, trailing total DPS rises to S$1.84, a total yield of 4.25%, still below the 4.7% hurdle but a smaller miss of 45 basis points. Per standing policy, a completed one-off special isn’t treated as an ongoing programme the way DBS’s recurring quarterly capital return is, so the governing figure here is the ordinary-only basis: 3.67%, a 103bp miss.
Section 3 — Forensic Screen: Capital and Asset Quality
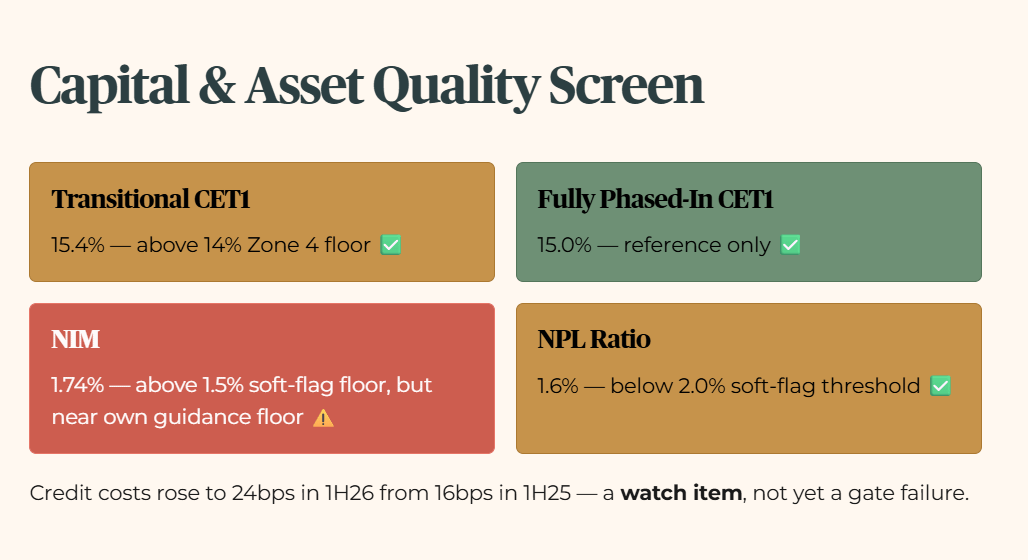
Transitional CET1 came in at 15.4% for 2Q26, up modestly from 15.3% in 1Q26, partly reflecting the roughly 14bps boost from the divestment gain. Fully phased-in CET1 sits at 15.0%. Both remain comfortably above the 14% Zone 4 floor, though below the 16% threshold that would support a Zone 1 read on capital alone.
Net interest margin at 1.74% now sits at the low end of UOB’s own guided full-year range of 1.75% to 1.80%, technically just below it. This isn’t a soft-flag trigger, the forensic floor for NIM sits at 1.5%, but it’s a real compression trend worth watching rather than dismissing as noise.
NPL ratio rose to 1.6% from 1.5% the prior quarter, still well clear of the 2.0% soft-flag threshold, and the bank has been transparent that the move reflects a single downgraded account rather than broad-based deterioration. Total credit costs for 1H26 rose to 24 basis points from 16 basis points in 1H25, a genuine increase, with 2Q26 specific credit costs alone reaching 39 basis points, the highest single quarter across the trailing five-quarter trend shown in the results. This doesn’t map cleanly onto an existing soft-flag category in the current framework, it isn’t yet a two-consecutive-period profit decline, but it’s a real, disclosed deterioration in credit cost that’s worth a formal decision on whether it earns its own tracking line going forward, rather than being absorbed silently.
Hard Gate Result: PASS on CET1 and NPL. The verdict rests on yield.
Financial Health Checklist
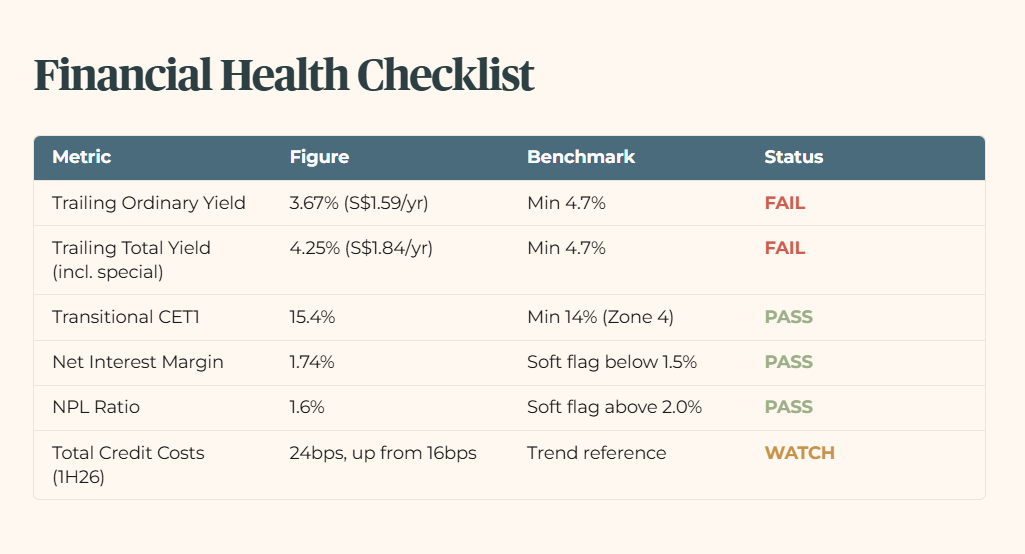
🟢Iggy’s View: Five of six metrics here would pass Zone 1 comfortably. Transitional CET1 at 15.4% clears the Zone 4 floor with room to spare, NIM and NPL both sit inside UOB’s own guided range, and credit costs, while climbing, are nowhere near red-flag severity yet. The entire Zone 4- verdict rests on one line: yield. Both the ordinary and total-yield readings miss the 4.7% hurdle, and that single failure is enough to override five clean passes elsewhere. This is what a healthy-balance-sheet miss looks like. Nothing wrong with the bank. Everything wrong with what you’re paid to hold it at today’s price.
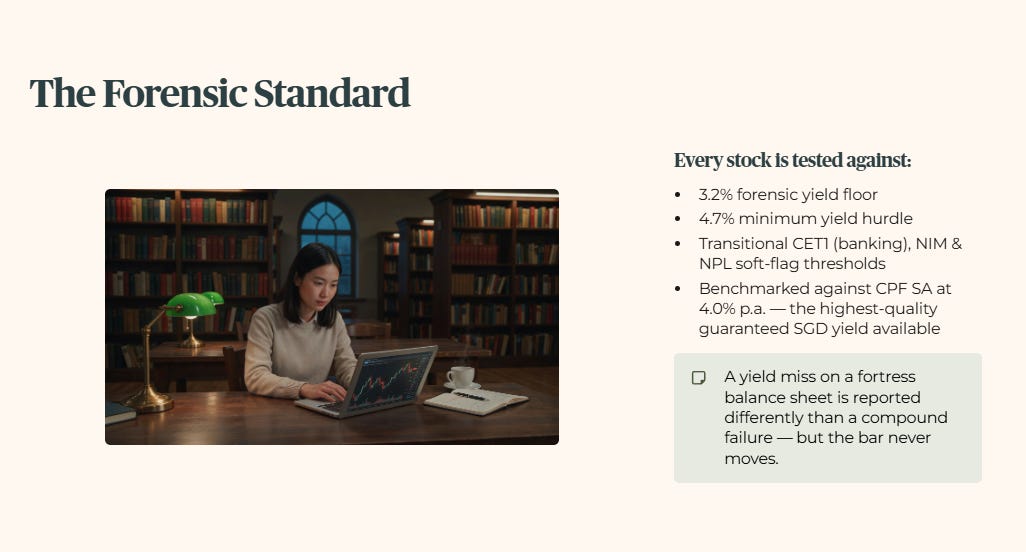
How Iggy Rates Every Stock: Every stock I screen is tested against a 3.2% forensic yield floor, a 4.7% minimum yield hurdle, and, for banking entities, a transitional CET1 substitute for gearing, alongside NIM and NPL soft-flag thresholds, all benchmarked against CPF SA at 4.0% per annum, the highest-quality guaranteed SGD yield available. A miss on yield alone, on an otherwise fortress balance sheet, is treated differently in how it’s reported than a compound failure, but the underlying bar never moves.
Soft Flags: Zero formally triggered under current threshold definitions. NIM sitting at the low end of guided range and rising credit costs are trend items worth monitoring, not yet gate-crossing.
The hard gates are clear. The trailing-window calculation that determines UOB’s final forensic zone has not yet been shown.
