

UOB Q3 2025 Results: 72% Profit Drop: Why It's Not What You Think
Is this Southeast Asia’s premier bank worth your SGX capital? Why pre-emptive provisioning signals both caution and confidence.

Why This Report Matters Now
UOB just published its Q3 2025 results, and here’s the thing: the headline numbers look scary. Net profit tanked 67% quarter-on-quarter and 72% year-on-year. Your first instinct might be to panic-sell. But dig deeper, and you’ll find a very different story—one about strategic defensive moves, fortress fundamentals, and why this might be exactly the moment long-term SGX investors need to pay attention.
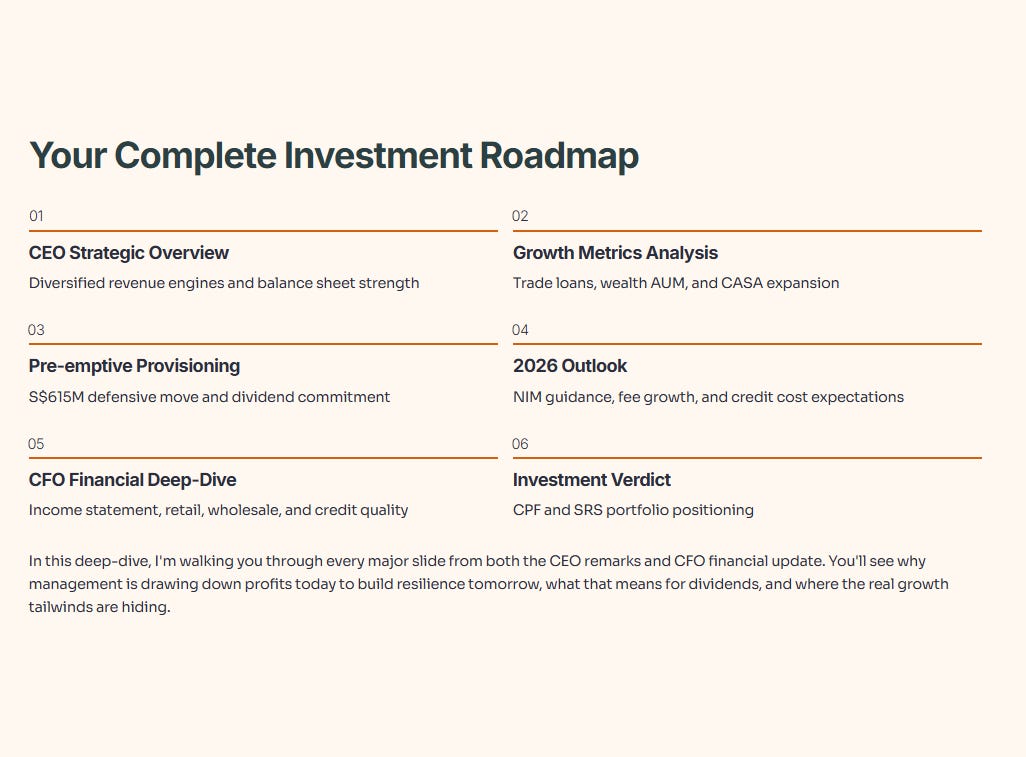
In this deep-dive, I’m walking you through every major slide from both the CEO remarks and CFO financial update. You’ll see why management is drawing down profits today to build resilience tomorrow, what that means for dividends, and where the real growth tailwinds are hiding. By the end, you’ll have a clear verdict: whether UOB deserves a spot in your CPF or SRS portfolio.
Let’s dive in.
In This Article:

• 🤵 CEO Slide 1: Driven by Diversified Engines
• 🏦 CEO Slide 2: Strong Balance Sheet & Growth Metrics
• 💪 CEO Slide 3: Proactive Balance Sheet Strengthening
• 🧭 CEO Slide 4: 2026 Outlook & Your Investment Framework
• 📊 CFO Deep-Dive: Financial Updates for September 2025
• CFO Slide 1: Key Highlights Summary
• CFO Slide 2: Full Income Statement Breakdown
• CFO Slide 3: Group Retail Performance
• CFO Slide 4: Group Wholesale Banking Performance
• CFO Slide 5: Global Markets
• CFO Slide 6: Net Interest Income Trajectory
• CFO Slide 7: Fee Income Build-Out
• CFO Slide 8: Operating Expenses
• CFO Slide 9: Credit Quality Deep-Dive
• CFO Slide 10: Provision Coverage & Credit Costs
• CFO Slide 11: Loan Portfolio Deep-Dive
• CFO Slide 12: Deposits & Funding
• CFO Slide 13: Capital Ratios
• 🦎 Iggy’s Assessment: Buy, Hold, or Sell?
• The Bull Case:
• The Bear Case:
• The Verdict:
• Key Risks to Monitor:
• What’s Next for Your Portfolio
A Note on the Slides (Your Download)
To keep this analysis fast-moving and easy to read, I won’t be embedding the full presentation slides, which can clutter the page. Instead, I’ll be referencing the key data and insights from each one.
I’ve made both the full CEO and CFO slide decks available for you to download. This way, you can follow along or review the raw data yourself.
[Download the CEO Slides Here]
[Download the CFO Slides Here]
🤵 CEO Slide 1: Driven by Diversified Engines
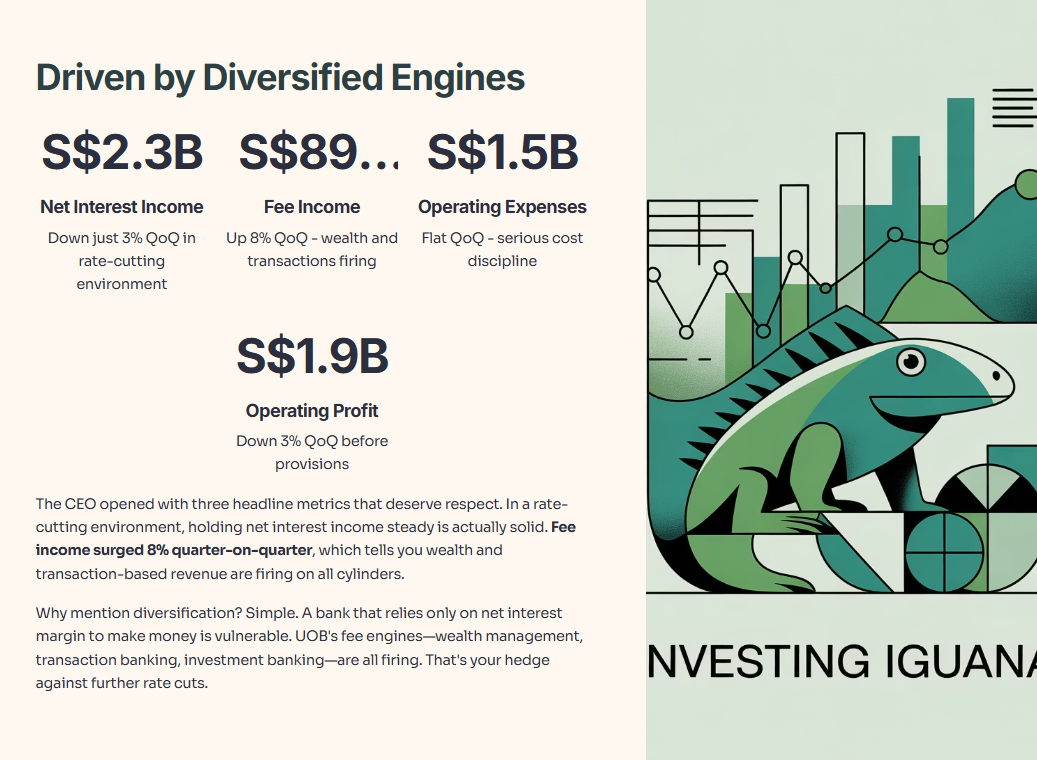
The CEO opened with three headline metrics that deserve respect. Net interest income landed at S$2.3 billion, down just 3% quarter-on-quarter. In a rate-cutting environment, that’s actually solid. Fee income surged to S$892 million, up 8% QoQ, which tells you wealth and transaction-based revenue are firing on all cylinders.
UOB’s operating expenses were unchanged at S$1.5 billion quarter-on-quarter. That shows management is serious about controlling costs, even when revenue growth slows. Operating profit came in at S$1.9 billion, a 3% dip from the previous quarter. But keep in mind: this figure does not include the major provisions that management will announce next.
Why mention diversification? Simple. A bank that relies only on net interest margin to make money is vulnerable. UOB’s fee engines—wealth management, transaction banking, investment banking—are all firing. That’s your hedge against further rate cuts.
🏦 CEO Slide 2: Strong Balance Sheet & Growth Metrics
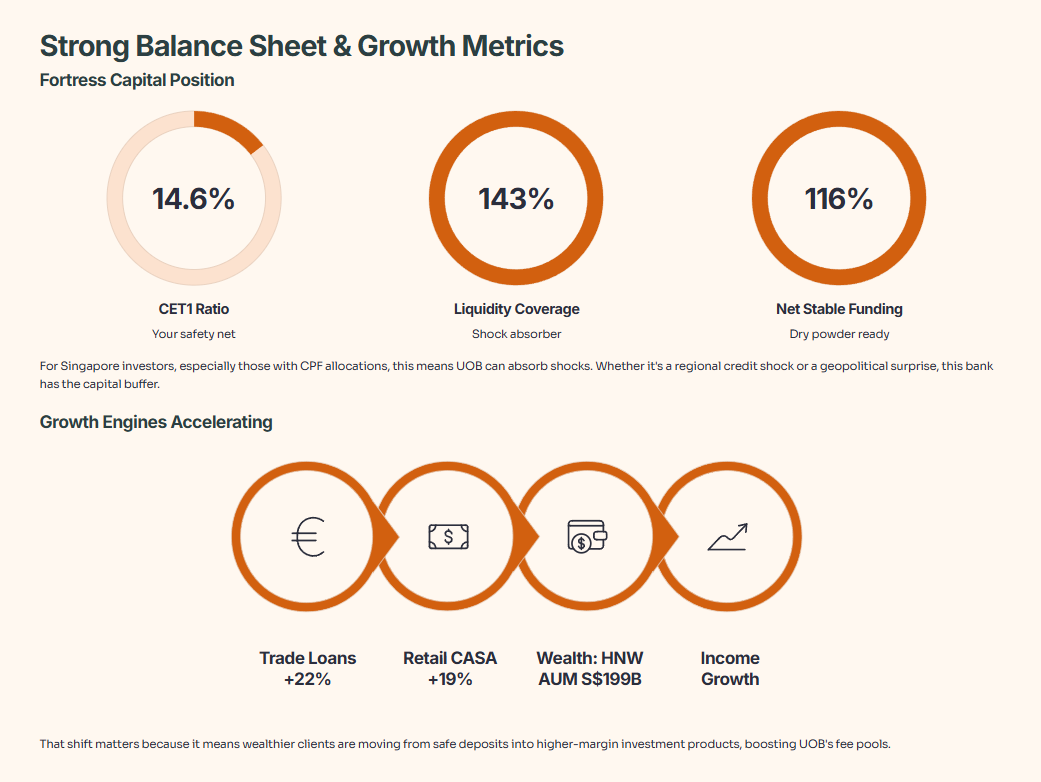
Here’s where things get interesting for your portfolio. UOB’s Common Equity Tier 1 (CET1) ratio sits at 14.6%, liquidity coverage ratio at 143%, and net stable funding ratio at 116%. These aren’t just numbers. They’re your safety net.
For Singapore investors, especially those with CPF allocations, this means UOB can absorb shocks. Whether it’s a regional credit shock or a geopolitical surprise, this bank has dry powder.
Now, growth. Loans grew 5% year-on-year. In Q3 2025, with global uncertainty swirling, 5% is respectable. Trade loans surged 22% YoY—that’s the tailwind from increased regionalization as supply chains shuffle. Retail banking CASA (current account savings accounts) jumped 19% YoY, which means retail customers trust UOB with their sticky deposits. That’s gold for the bank’s funding costs.
Wholesale banking CASA climbed 4% YoY. Customer treasury income grew 9%. High-net-worth AUM hit S$199 billion, up 8% YoY. Wealth income climbed 15% over nine months. And here’s the clincher: the invested AUM mix improved from 37% to 41% year-over-year. That shift matters because it means wealthier clients are moving from safe deposits into higher-margin investment products, boosting UOB’s fee pools.
💪 CEO Slide 3: Proactive Balance Sheet Strengthening
This is where the profit decline story becomes clear—and frankly, reassuring.
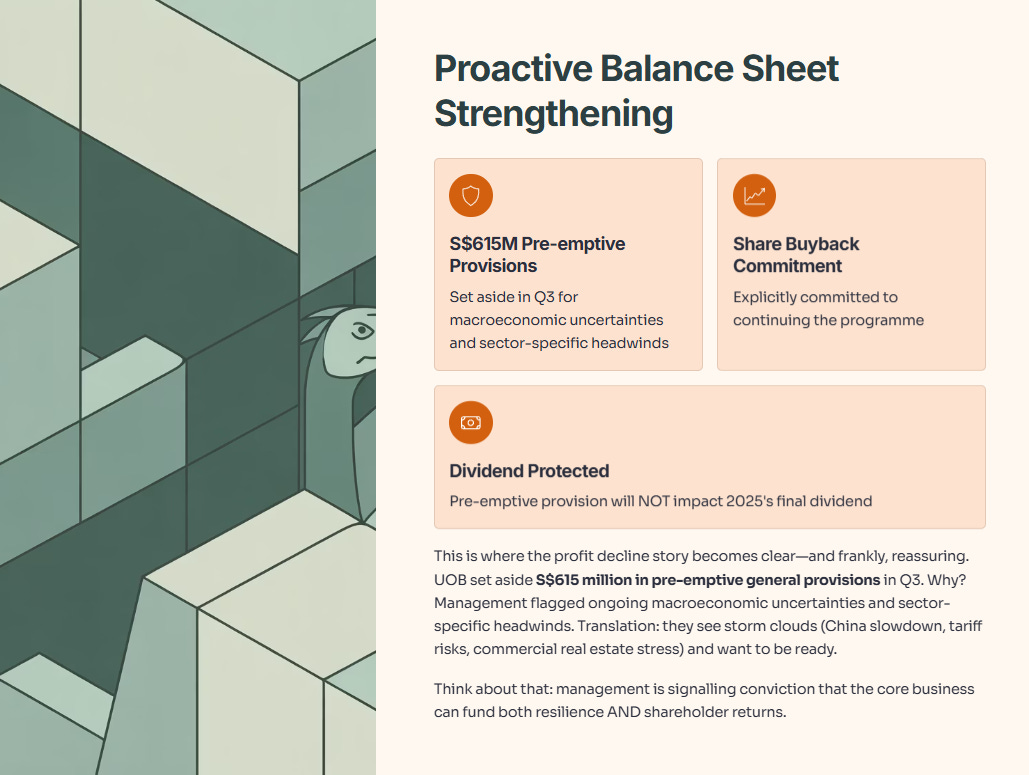
UOB set aside S$615 million in pre-emptive general provisions in Q3. Why? Management flagged ongoing macroeconomic uncertainties and sector-specific headwinds. Translation: they see storm clouds (China slowdown, tariff risks, commercial real estate stress) and want to be ready.
They’re explicitly committed to their share buyback programme. They’ve also committed that this pre-emptive provision will not impact 2025’s final dividend. Think about that: management is signalling conviction that the core business can fund both resilience AND shareholder returns.
🧭 CEO Slide 4: 2026 Outlook & Your Investment Framework
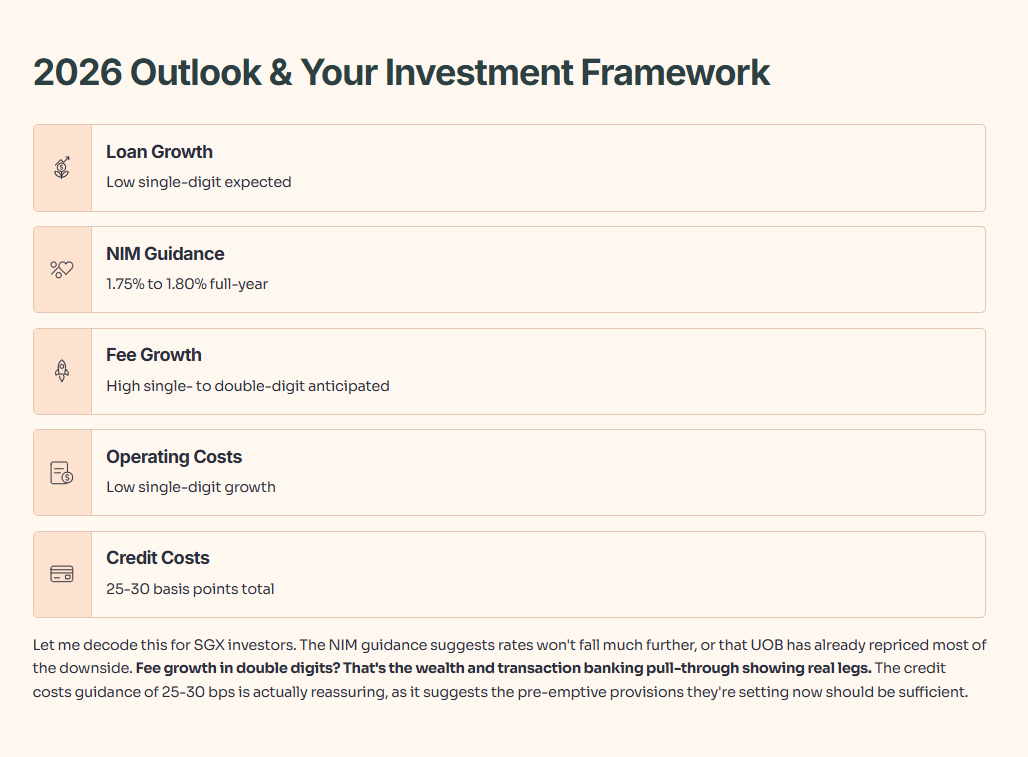
The CEO painted a cautious but not dire picture for 2026:
Low single-digit loan growth expected
Full-year NIM (net interest margin) guidance: 1.75% to 1.80%
High single- to double-digit fee growth anticipated
Low single-digit operating cost growth
Total credit costs: 25-30 basis points
Let me decode this for SGX investors. The NIM guidance suggests rates won’t fall much further, or that UOB has already repriced most of the downside. Fee growth in double digits? That’s the wealth and transaction banking pull-through showing real legs. The credit costs guidance of 25-30 bps is actually reassuring, as it suggests the pre-emptive provisions they’re setting now should be sufficient.
📊 CFO Deep-Dive: Financial Updates for September 2025
Now let’s shift to Leong Yung Chee’s detailed financial slides. These numbers show what’s happening beneath the headlines.
CFO Slide 1: Key Highlights Summary
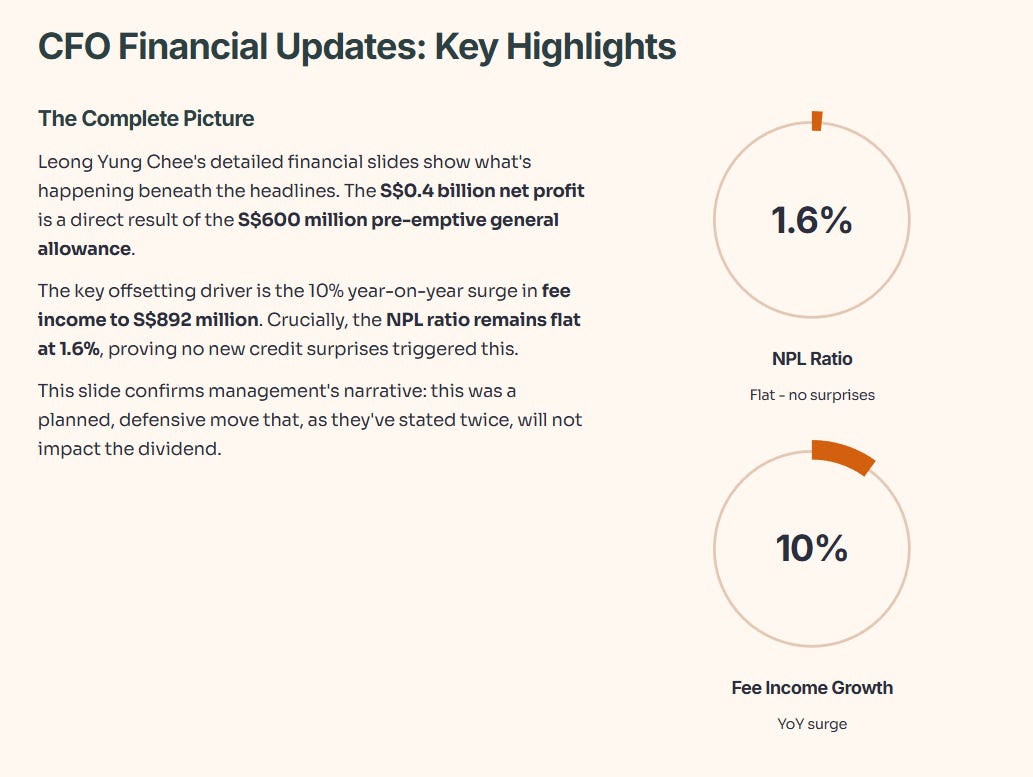
As the CEO highlighted, the CFO’s summary slide confirms the entire story in one place: the S$0.4 billion net profit is a direct result of the S$600 million pre-emptive general allowance. The key offsetting driver, again, is the 10% year-on-year surge in fee income to S$892 million. Crucially, the NPL ratio remains flat at 1.6%, proving no new credit surprises triggered this. This slide just confirms management’s narrative: this was a planned, defensive move that, as they’ve stated twice, will not impact the dividend.
CFO Slide 2: Full Income Statement Breakdown
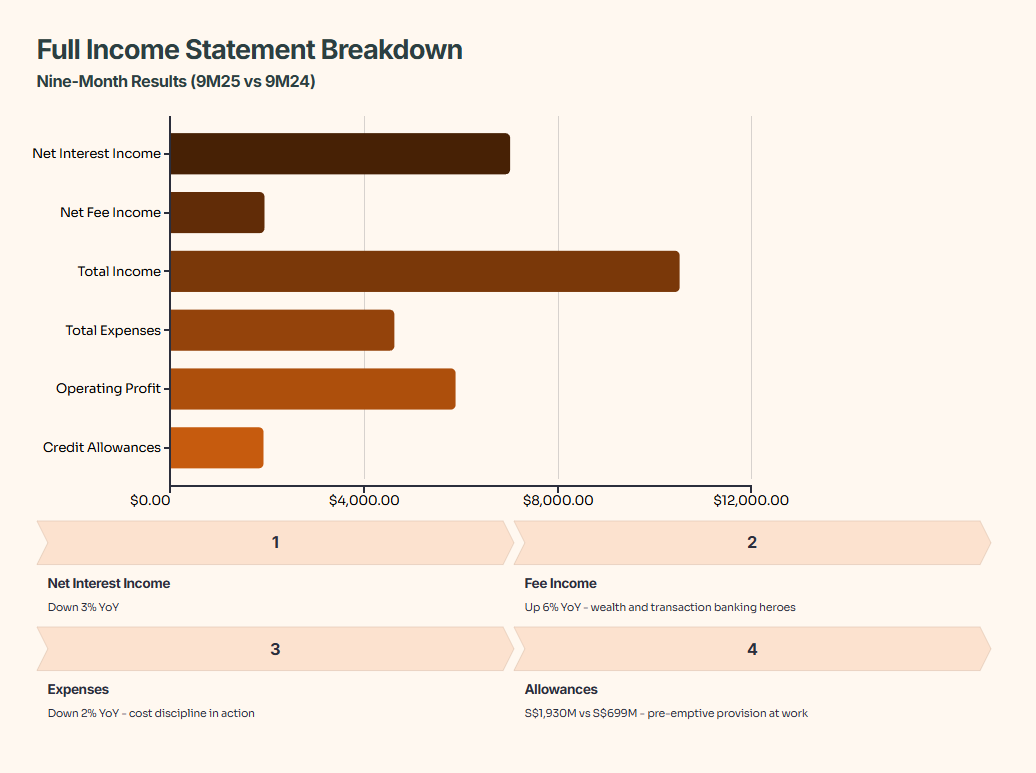
Looking at the nine-month (9M25) results versus the prior year (9M24):
Net interest income: S$7,009 million, down 3% YoY.
Net fee income: S$1,945 million, up 6% YoY. Wealth and transaction banking are the heroes.
Total income: S$10,519 million, down 3% YoY.
Total expenses: S$4,629 million, down 2% YoY. That’s cost discipline in action.
Operating profit: S$5,890 million, down 3% YoY.
Here’s where the story pivots: allowance for credit losses jumped to S$1,930 million versus S699millionlastyear.That′stheS615 million pre-emptive provision doing its work, plus some normalization of credit costs.
CFO Slide 3: Group Retail Performance
Group Retail generated 9M25 income of S$3,813 million, down 7% YoY.
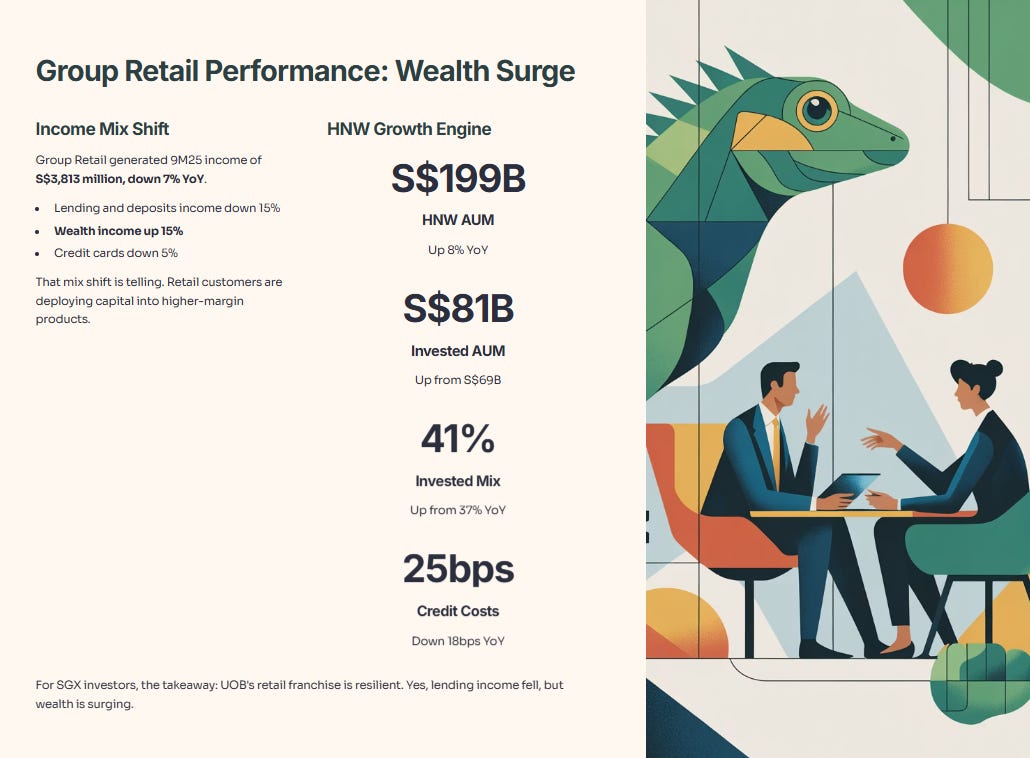
Breakdown: Lending and deposits income down 15%. Wealth income up 15%. Credit cards down 5%.
That mix shift is telling. Retail customers are deploying capital. HNW AUM (Privilege Banking and Private Bank) grew to $199 billion, up 8% YoY.
Even more, the invested portion of that AUM grew to $81 billion (up from $69 billion a year ago), improving the invested AUM mix from 37% to 41% YoY.
Credit costs: Just 25 basis points, down 18 bps YoY, partly due to improved credit quality post-merger in Thailand.
For SGX investors, the takeaway: UOB’s retail franchise is resilient. Yes, lending income fell, but wealth is surging.
CFO Slide 4: Group Wholesale Banking Performance
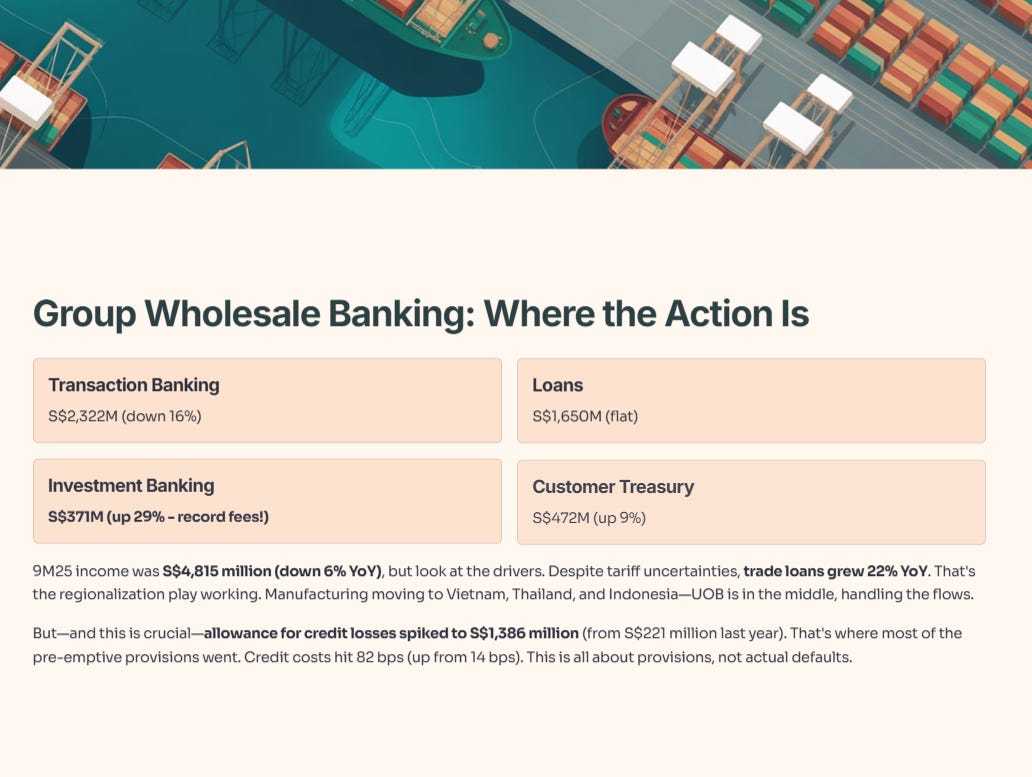
This is where the real action is happening. 9M25 income was S$4,815 million (down 6% YoY), but look at the drivers:
Transaction banking: S$2,322 million (down 16%).
Loans: S$1,650 million (flat).
Investment Banking: S$371 million (up 29% - record fees in 9M25!).
Customer treasury: S$472 million (up 9%).
Despite tariff uncertainties, trade loans grew 22% YoY. That’s the regionalization play working. Manufacturing moving to Vietnam, Thailand, and Indonesia—UOB is in the middle, handling the flows.
But—and this is crucial—allowance for credit losses spiked to S$1,386 million (from S$221 million last year). That’s where most of the pre-emptive provisions went. Credit costs hit 82 bps (up from 14 bps). This is all about provisions, not actual defaults.
CFO Slide 5: Global Markets
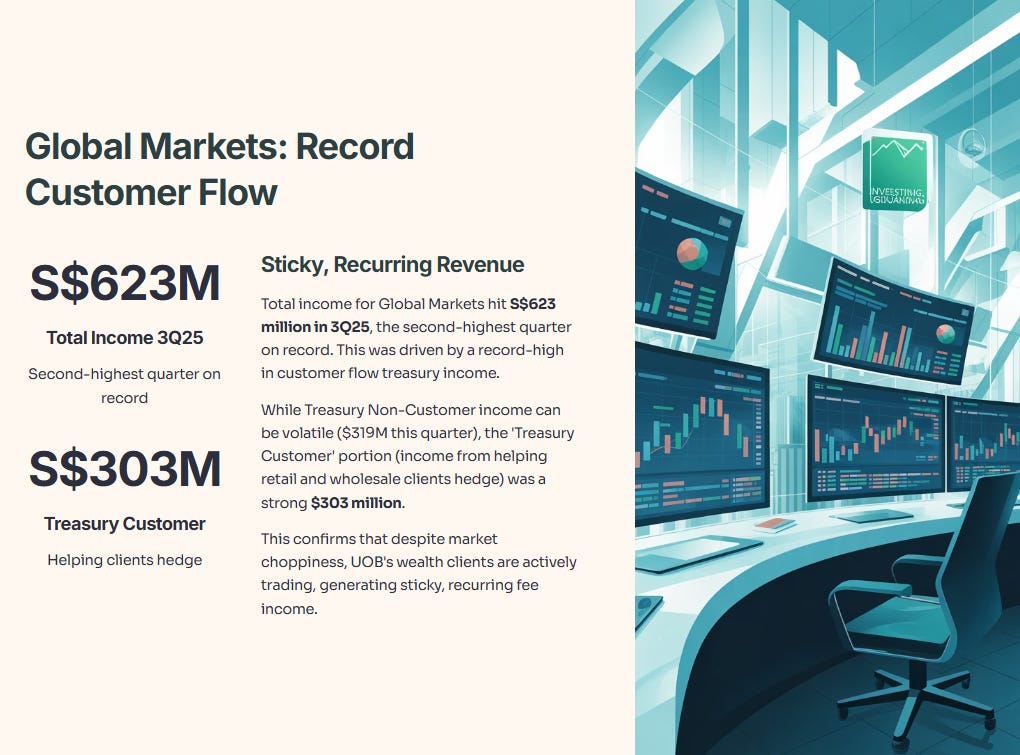
Total income for Global Markets hit S$623 million in 3Q25, the second-highest quarter on record. This was driven by a record-high in customer flow treasury income. While Treasury Non-Customer income can be volatile ($319M this quarter), the ‘Treasury Customer’ portion (income from helping retail and wholesale clients hedge) was a strong $303 million. This confirms that despite market choppiness, UOB’s wealth clients are actively trading, generating sticky, recurring fee income.
CFO Slide 6: Net Interest Income Trajectory
This slide shows the NIM squeeze in real time. 3Q25 NIM: 1.82%, down from 1.91% in 2Q and 2.12% in 3Q24.
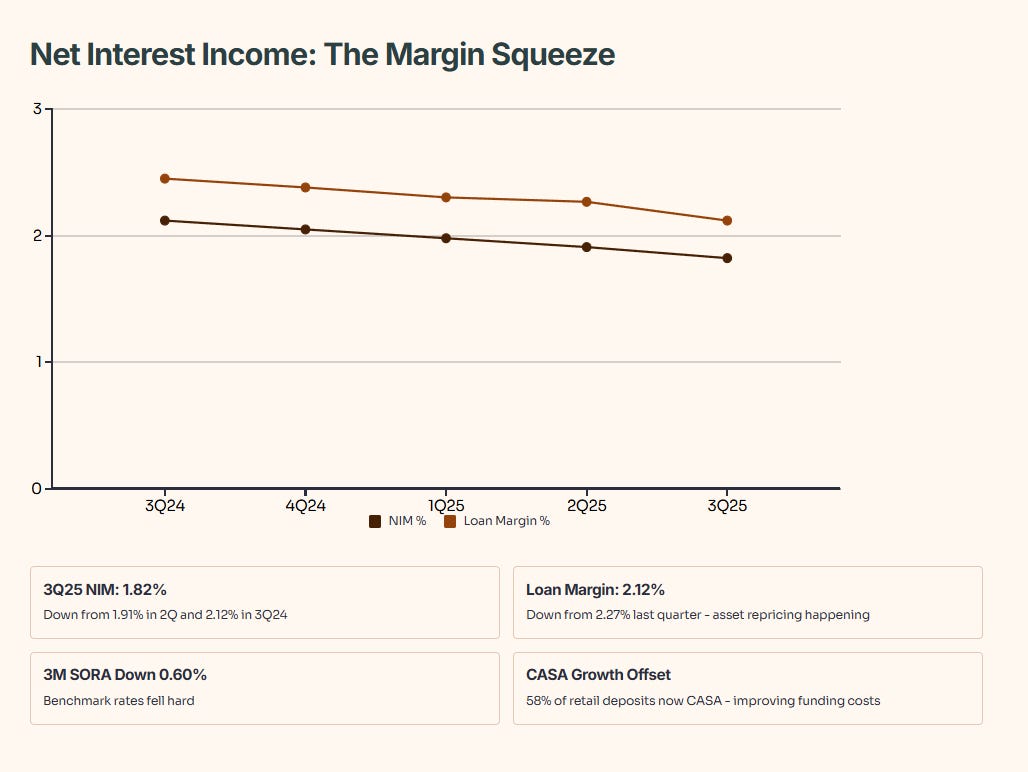
Loan margin: 2.12% (down from 2.27% last quarter). Asset repricing is happening.
Benchmark rates fell hard: 3M SORA was down 0.60%.
They partially offset this by improving funding costs, driven by CASA growth (58% of retail deposits are now CASA).
CFO Slide 7: Fee Income Build-Out
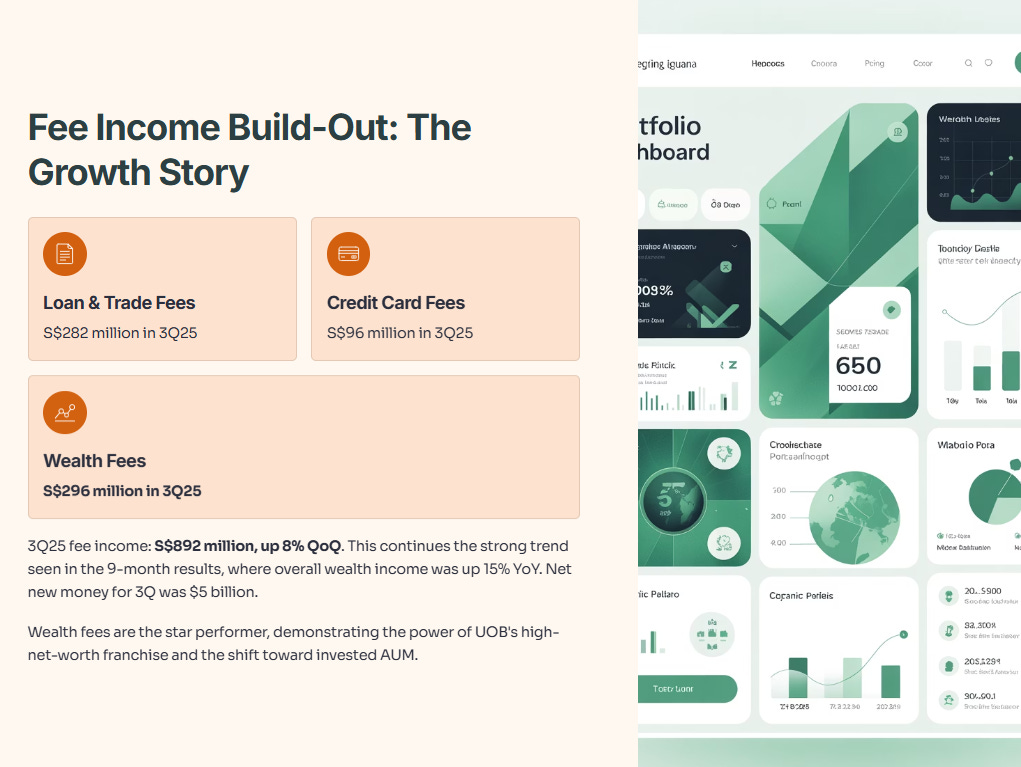
3Q25 fee income: S$892 million, up 8% QoQ.
Loan and trade-related fees: S$282 million.
Credit card fees: S$96 million.
Wealth fees: S$296 million. This continues the strong trend seen in the 9-month results, where overall wealth income was up 15% YoY. Net new money for 3Q was $5 billion.
CFO Slide 8: Operating Expenses
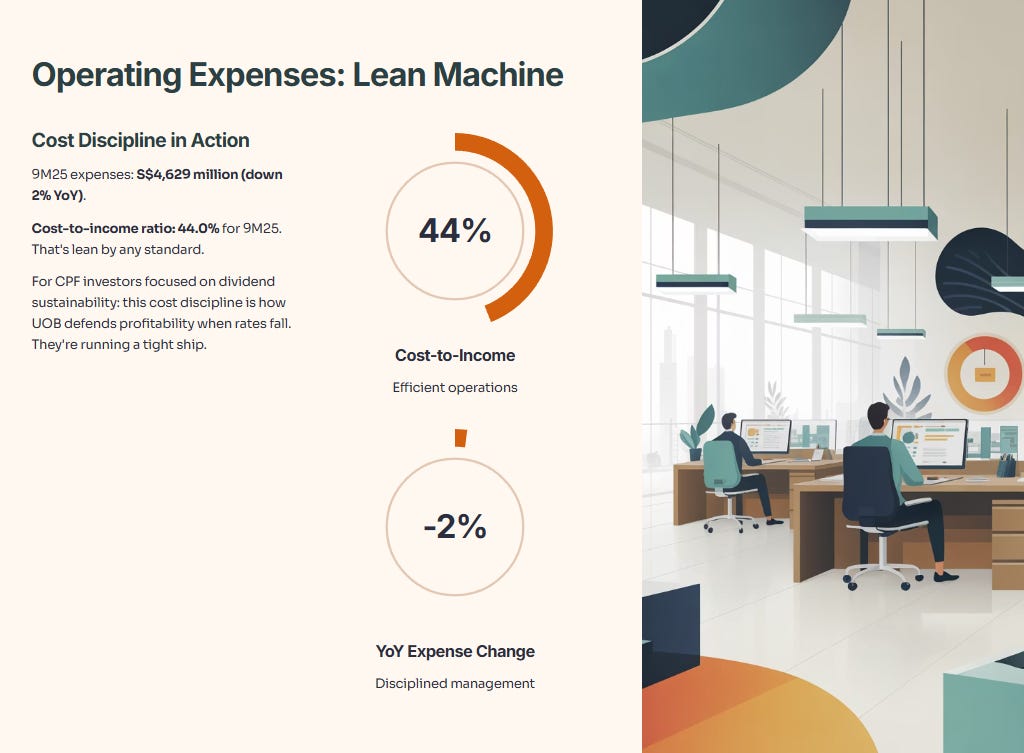
9M25 expenses: S$4,629 million (down 2% YoY).
Cost-to-income ratio: 44.0% for 9M25. That’s lean.
For CPF investors focused on dividend sustainability: this cost discipline is how UOB defends profitability when rates fall. They’re running a tight ship.
CFO Slide 9: Credit Quality Deep-Dive
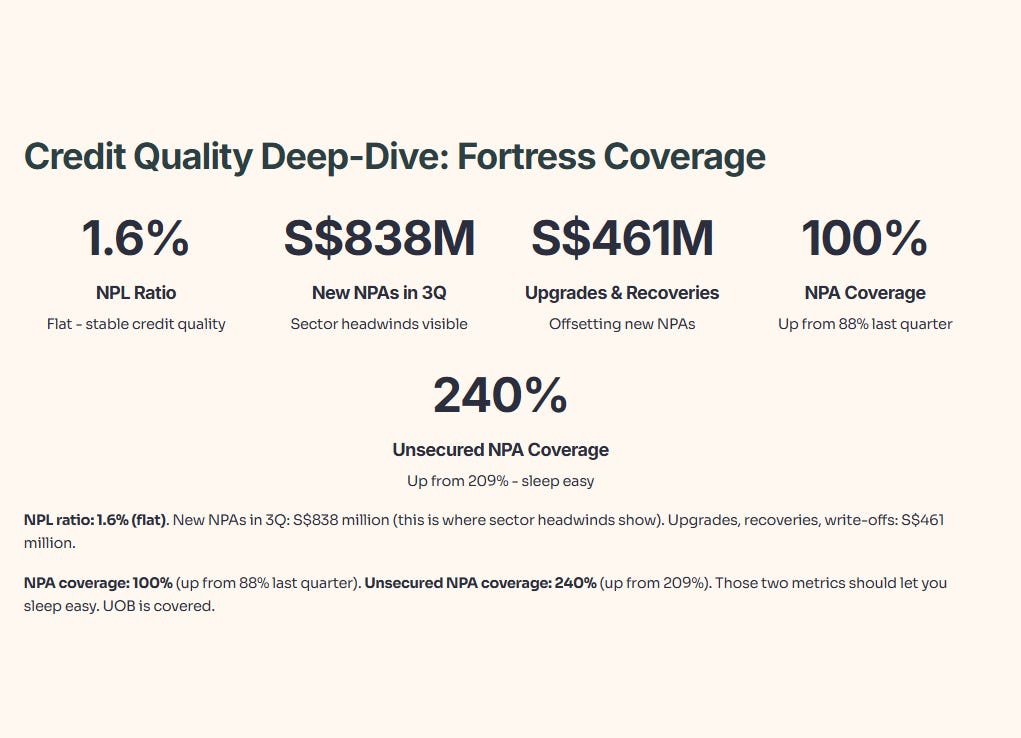
NPL ratio: 1.6% (flat).
New NPAs in 3Q: S$838 million (this is where sector headwinds show).
Upgrades, recoveries, write-offs: S$461 million.
NPA coverage: 100% (up from 88% last quarter).
Unsecured NPA coverage: 240% (up from 209%).
Those two metrics should let you sleep easy. UOB is covered.
CFO Slide 10: Provision Coverage & Credit Costs
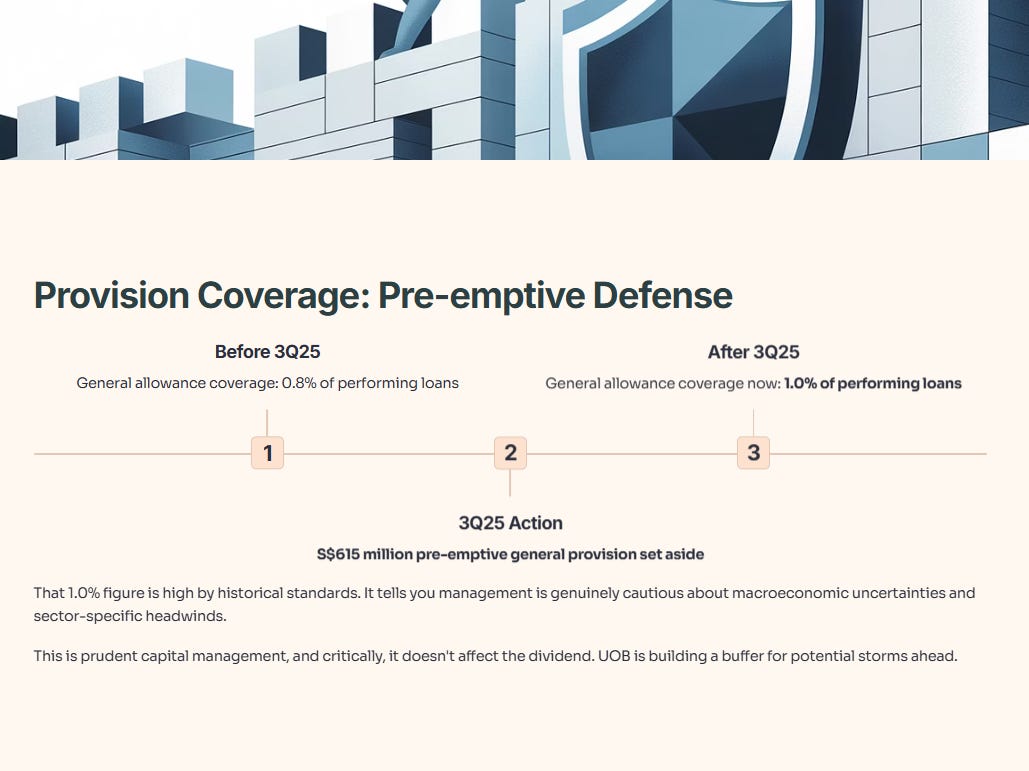
Pre-emptive general provision: S$615 million set aside in 3Q.
General allowance coverage now: 1.0% of performing loans (versus 0.8% last quarter).
That 1.0% figure is high by historical standards. It tells you management is genuinely cautious. This is prudent, and it doesn’t affect the dividend.
CFO Slide 11: Loan Portfolio Deep-Dive
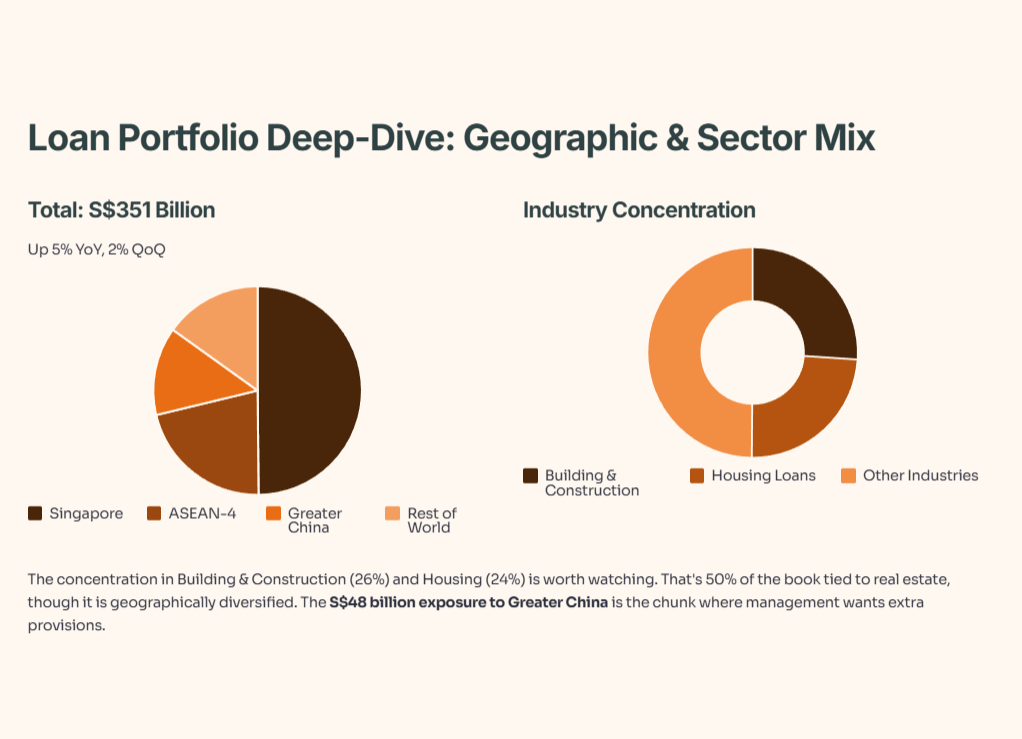
Total customer loans: S$351 billion (up 5% YoY, 2% QoQ).
By geography:
Singapore: S$175 billion (50% of total)
ASEAN-4: S$75 billion (21%)
Greater China: S$48 billion (14%)
Rest of world: S$53 billion (15%)
By industry:
Building & construction: 26%
Housing loans: 24%
The concentration in Building & Construction (26%) and Housing (24%) is worth watching. That’s 50% of the book tied to real estate, though it is geographically diversified. The S$48 billion exposure to Greater China is the chunk where management wants extra provisions.
CFO Slide 12: Deposits & Funding
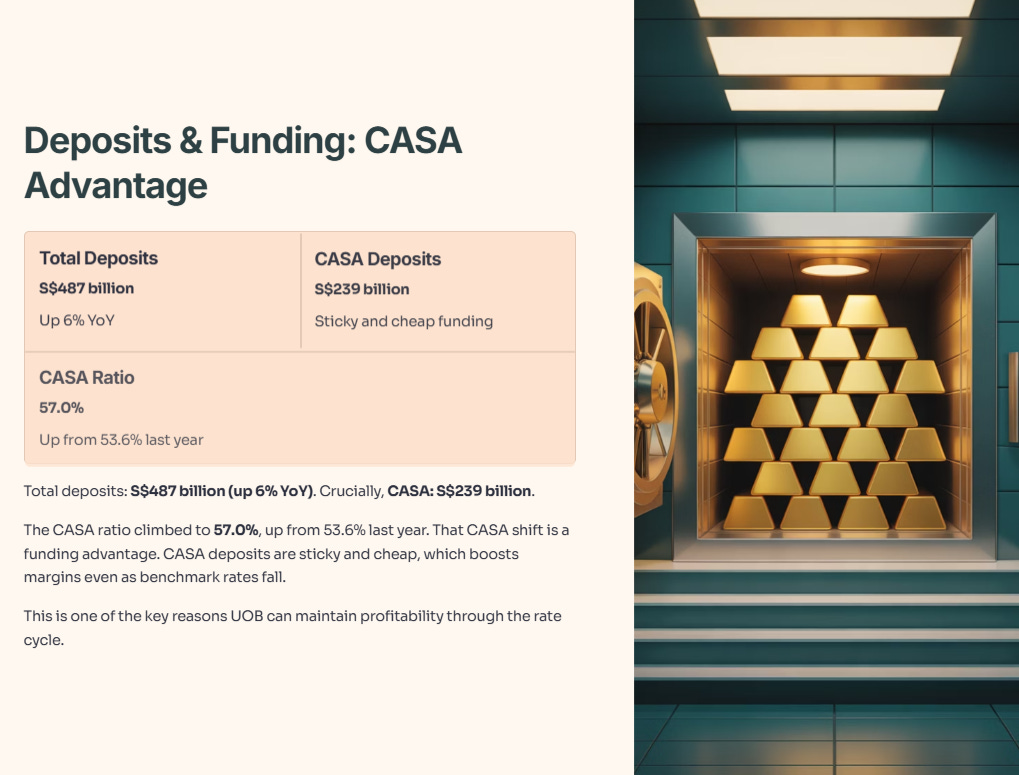
Total deposits: S$487 billion (up 6% YoY).
Crucially, CASA: S$239 billion.
The CASA ratio climbed to 57.0%, up from 53.6% last year.
That CASA shift is a funding advantage. CASA deposits are sticky and cheap, which boosts margins.
CFO Slide 13: Capital Ratios
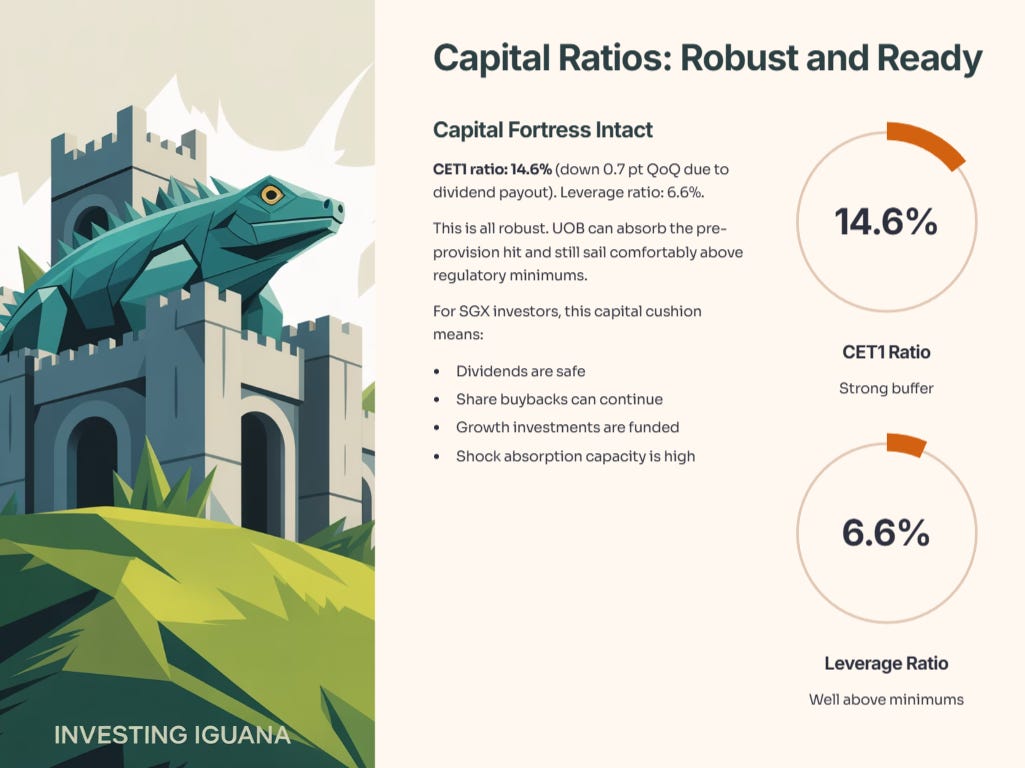
CET1 ratio: 14.6% (down 0.7 pt QoQ due to dividend payout).
Leverage ratio: 6.6%.
This is all robust. UOB can absorb the pre-provision hit and still sail comfortably.

🦎 Iggy’s Assessment: Buy, Hold, or Sell?
