

Why UOB’s Record Profit Isn’t Enough for Your Retirement Portfolio | EP1597 🦖
Beyond the headline beat lies a story of margin compression and a 3.9% yield that fails the forensic stress test. Here is why discipline beats impatience in the search for retirement income.

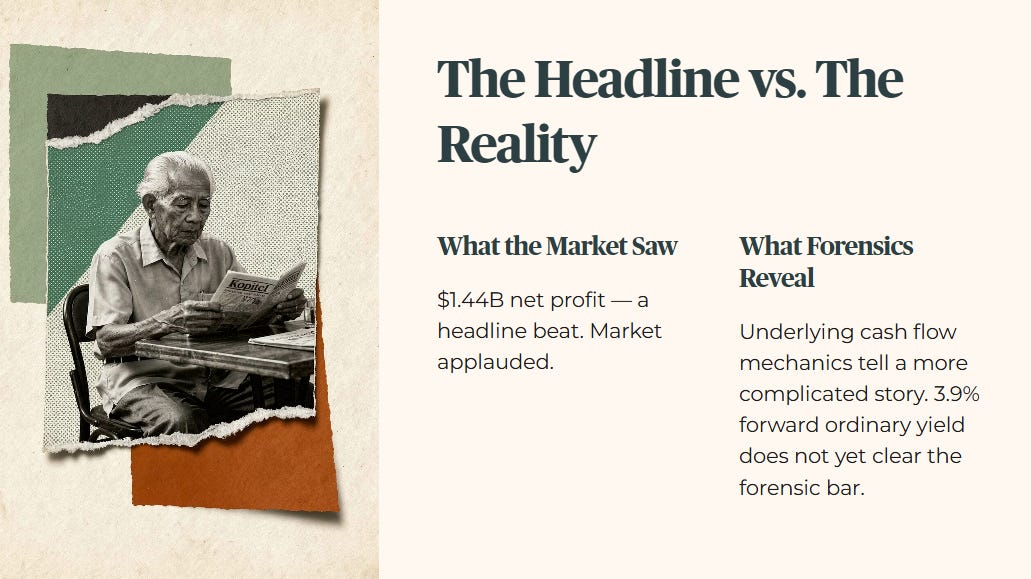
UOB just reported a 1.44 billion dollar net profit quarter. The market applauded the headline beat. But the underlying cash flow mechanics tell a more complicated story — one that disciplined investors need to understand before they decide what to do next.
If you are counting on this banking giant to fund your retirement through steady dividends, that 3.9% forward ordinary yield — based on the ordinary dividend, before any special distribution — is not yet clearing the forensic bar your retirement capital deserves.
Here is the full picture of UOB’s margin compression, and more importantly, exactly what you should be watching for before this changes.
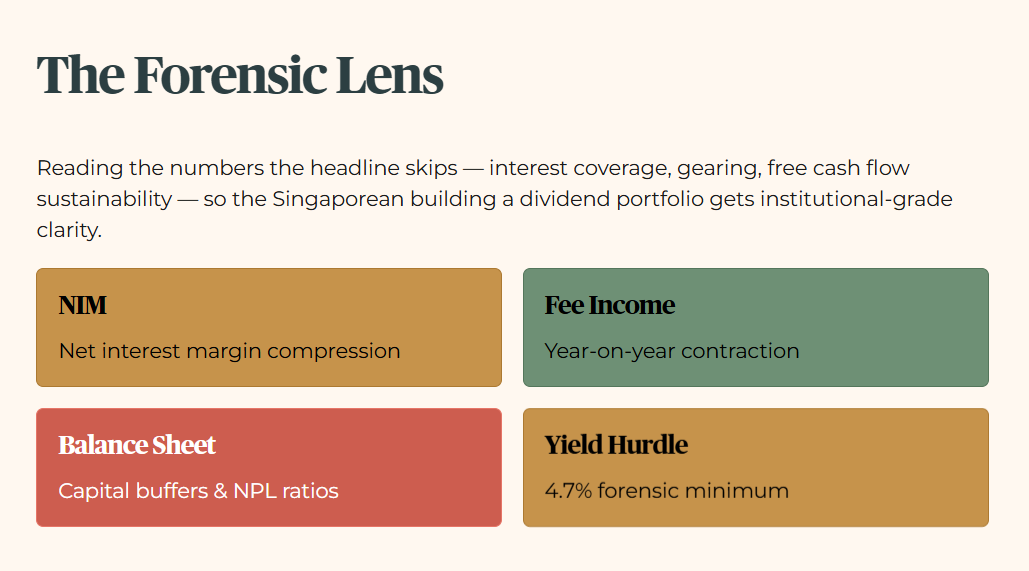
My job is simple, even if the balance sheet is not. I read the numbers that the headline skips — the interest coverage, the gearing, the free cash flow sustainability — so that the Singaporean building or living off a dividend portfolio gets the same forensic clarity that institutional money takes for granted.

In This Article:
The Slide by Slide Audit
Iggys Insight
The Reality Check
The Scorecard and Yield Spread
The Forward Outlook
Iggys Insight
Iggys Forensic Zone Zone 4 Caution
Iggys Forensic Disclaimer
The Slide-by-Slide Audit
The fundamental engine of any bank is its net interest margin (NIM) — the gap between what the bank earns on loans and what it pays on deposits. That gap has been narrowing, and understanding why it narrowed matters more than the number itself.
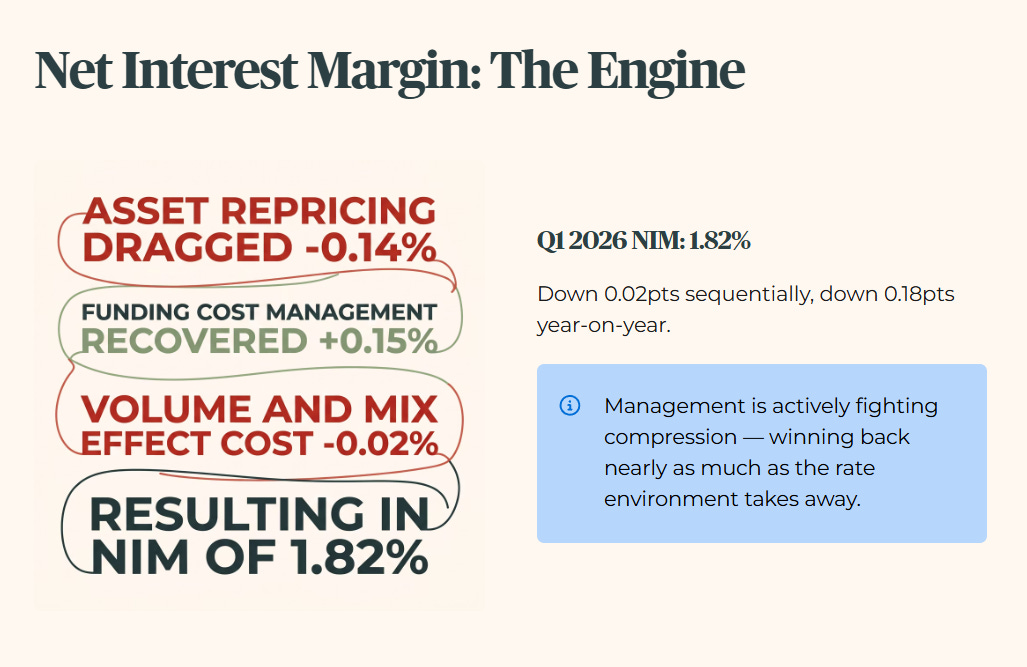
Looking at the raw facts from the first quarter of 2026, UOB reported a NIM of exactly 1.82%. This represents a sequential drop of 0.02 percentage points from the prior quarter, and a 0.18 percentage point decline year-on-year. Page 8 of the CFO deck breaks down exactly where the compression came from: asset repricing dragged NIM down by 0.14 percentage points, partially offset by active funding cost management which contributed a positive 0.15 percentage points. The net volume and mix effect cost a further 0.02 percentage points. The important forensic takeaway here is that management is not passively watching margin erode — they are actively fighting it through funding cost discipline, and winning back nearly as much as the rate environment is taking away.
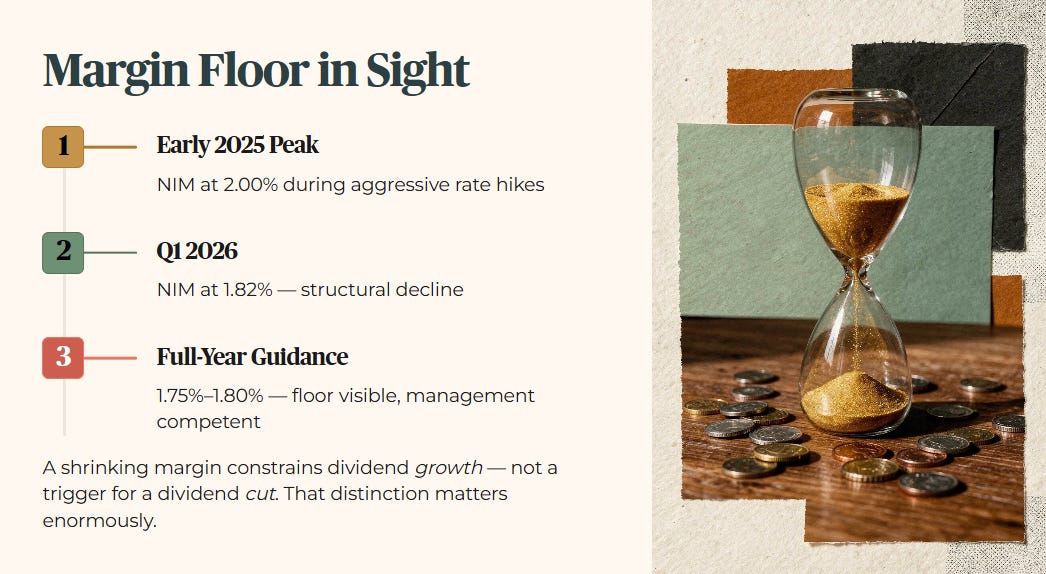
Historically, this reflects a structural decline from the 2.00% peak NIM the bank enjoyed during the aggressive rate hikes of early 2025. The era of easy banking spreads is over, but the management response has been measured and competent. Looking forward, management has guided for a full-year NIM between 1.75% and 1.80%, which means further modest compression is baked in, but the floor is visible and management has demonstrated they know how to manage toward it.
So what does this mean for you? For the 55-year-old Singaporean relying on CPF Special Account stability, a shrinking margin mathematically constrains the board’s ability to raise dividend payouts without burning core capital. That constraint is real. But it is a ceiling on dividend growth, not a trigger for a dividend cut — and that distinction matters enormously for how you position this name.
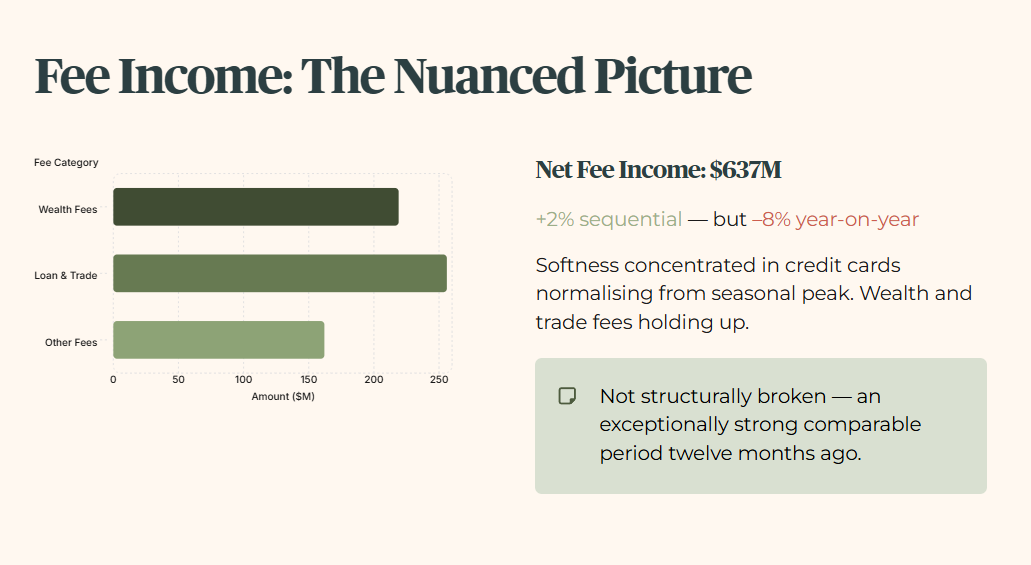
We must also audit the fee income. The bank reported 637 million dollars in net fee income. Management highlighted a 2% sequential increase quarter-on-quarter, while staying quiet about the 8% contraction year-on-year. The gross fee breakdown from page 9 of the CFO deck adds useful texture: wealth fees actually grew to 219 million dollars, loan and trade-related fees recovered to 256 million dollars after a weak fourth quarter, and the year-on-year softness is concentrated in credit cards normalising from last year’s seasonal peak. This is not a fee engine that is structurally broken — it is one that had an exceptionally strong comparable period twelve months ago.
Iggy’s Insight
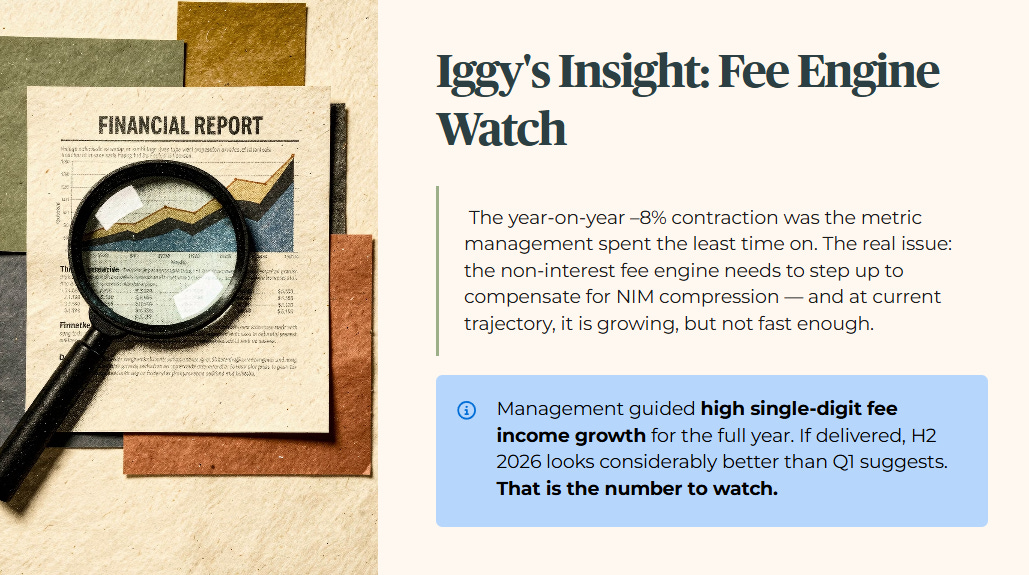
The single metric management spent the least time on was the year-on-year contraction in core net fee income, dropping 8% to 637 million dollars. They attributed it to card fees normalising after seasonal highs, and the gross fee data actually supports that explanation — wealth and trade fees are holding up. The real issue is structural: while net interest margins compress, the non-interest fee engine needs to step up meaningfully to compensate, and at current trajectory it is growing, but not fast enough to fully offset the NIM headwind. Management has guided high single-digit fee income growth for the full year. If they deliver, the income statement picture in the second half of 2026 looks considerably better than the first quarter suggests. That is the number to watch.
The Strong Balance Sheet
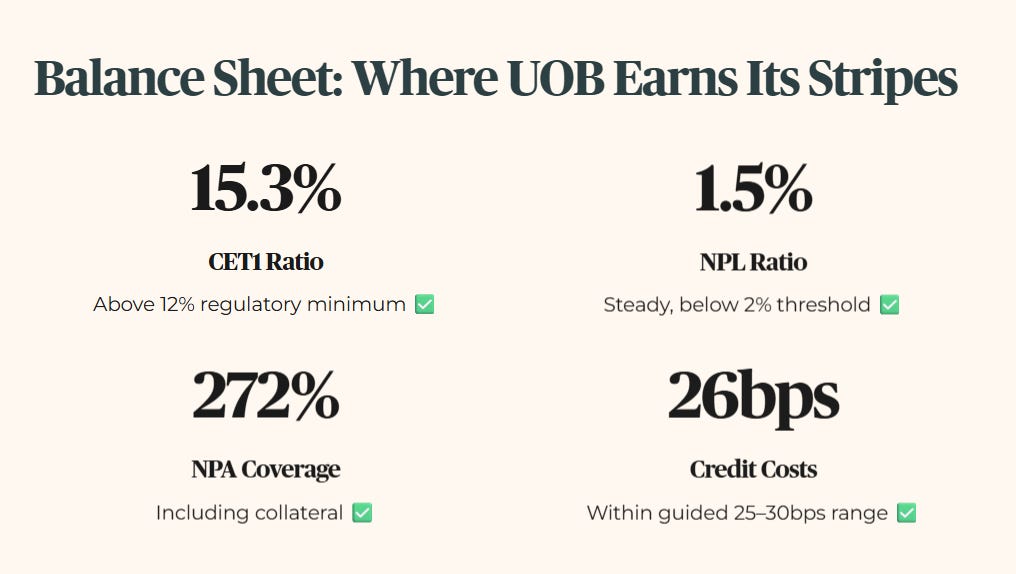
Despite the income pressures, the balance sheet is where UOB genuinely earns its stripes. The bank maintains a Common Equity Tier 1 (CET1) ratio — the core capital buffer regulators require banks to hold — of 15.3%, recovering from 15.1% in the prior quarter and sitting comfortably above the regulatory minimum. The non-performing loan (NPL) ratio — the share of loans where borrowers have stopped paying — held steady at 1.5%, with NPA coverage at 100%, or 272% once collateral is included. Total credit costs came in at 26 basis points, squarely within the guided 25 to 30 basis point range. For your portfolio, this is a bank that is doing exactly what it promised on risk management.
The Reality Check
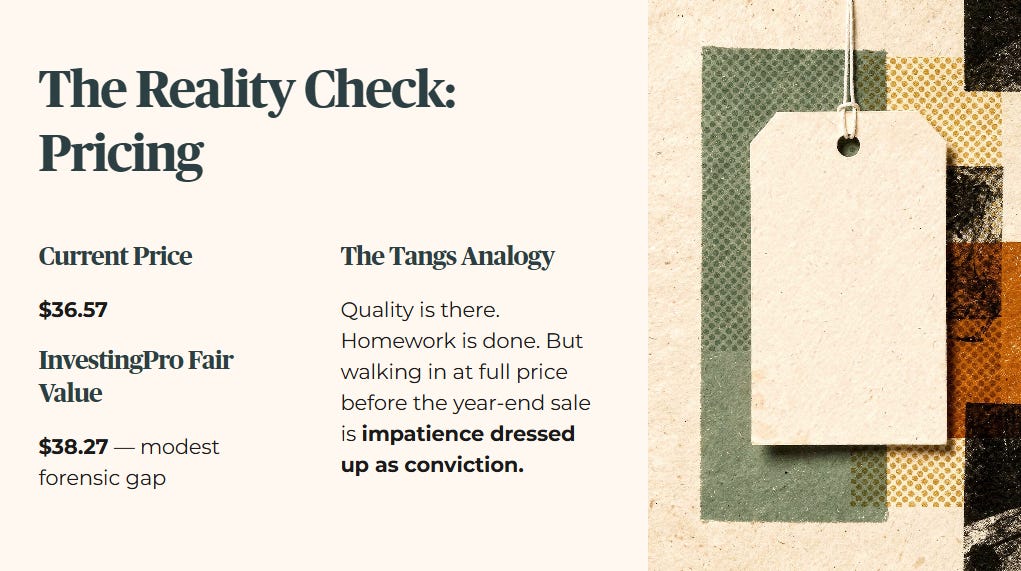
The current market price hovers around 36.57 dollars. The InvestingPro Fair Value baseline projects a twelve-month target of roughly 38.27 dollars — a modest Forensic Gap. The stock is trading at a slight discount to fair value, but not a discount large enough to compensate for the yield shortfall.
Think of it like waiting for the year-end sale at Tangs on Orchard Road. You know the quality is there. You have done your homework on the product. You are simply waiting for the price to reach the point where the deal actually makes sense for your household budget. Walking in too early at full price is not a bargain — it is impatience dressed up as conviction.
The Scorecard and Yield Spread
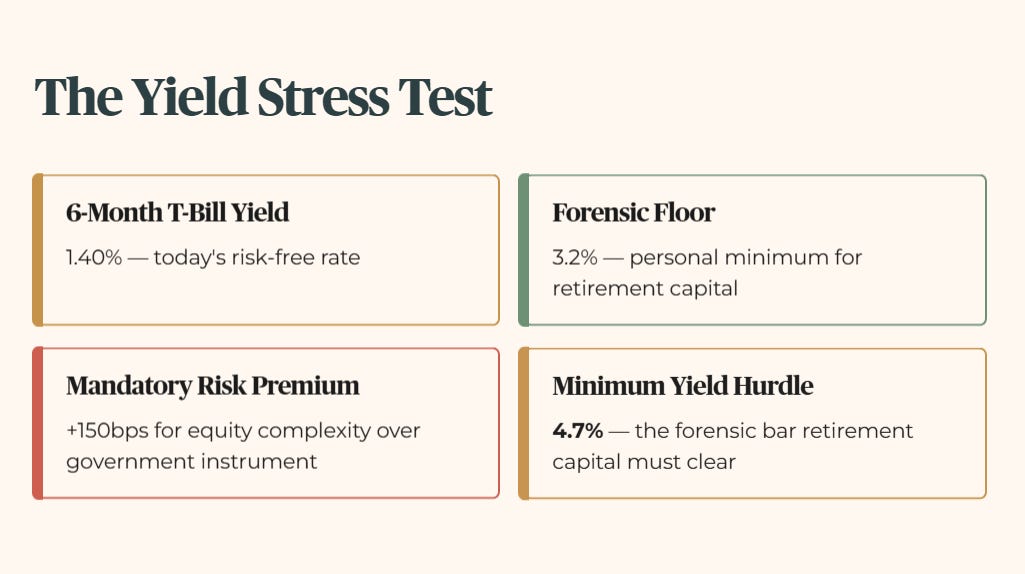
A note on the Stress-Test Buffer: for this audit, I apply a conservative forensic floor of 3.2% — my personal minimum income threshold for any asset I would consider holding in a retirement portfolio. The 6-Month T-Bill currently yields 1.40%, which tells you something important: my forensic floor is not anchored to today’s artificially low risk-free rate. It is anchored to the long-term average I require retirement capital to withstand when rates normalise. The minimum yield hurdle is 4.7% — that is the 3.2% floor plus 150 basis points of mandatory risk premium for the additional complexity and risk of holding an equity over a government instrument.
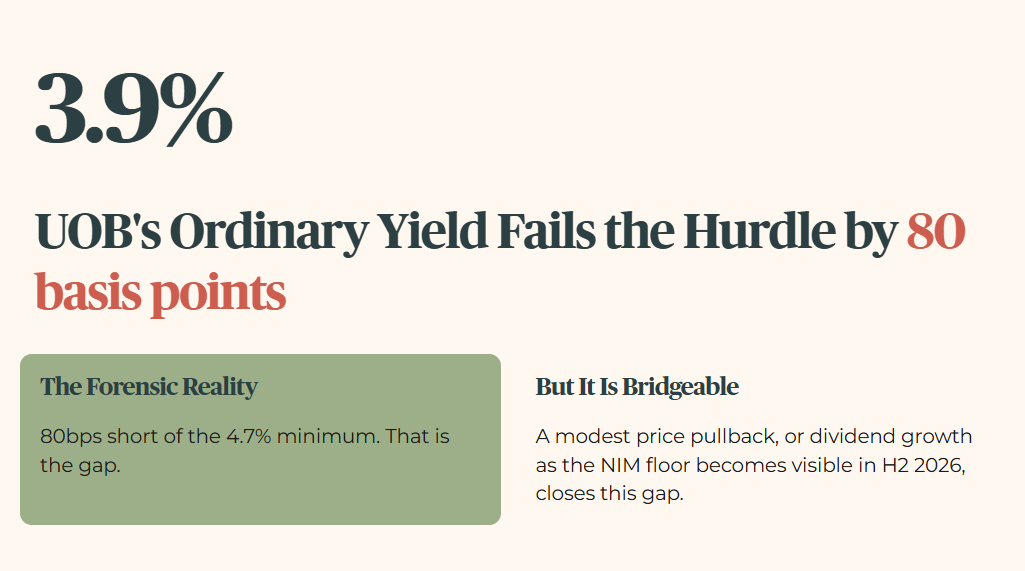
UOB’s 3.9% ordinary yield fails that hurdle by 80 basis points. That is the forensic reality. But 80 basis points is also not an unbridgeable gap — it is a gap that closes if the share price pulls back modestly, or if dividend growth resumes as the NIM floor becomes visible in the second half of the year.
The real question is whether that 80-basis-point gap can be closed without asking your retirement capital to shoulder hidden risk — and the only honest way to answer that is to run UOB’s dividend through a full-cycle stress test.
