

Record Fees vs. Wholesale Distress: Decoding the Hidden Risks in UOB’s Dividend Floor
Net profit plummeted 23% as management parked $2.04 billion in pre-emptive credit provisions—this massive forensic gap is exactly where your 181-cent dividend anchor lives. We audit the record fees ag

It’s a given assumption. The banks are supposed to be our financial bedrock. So when a titan like UOB releases its full-year 2025 numbers, we pay attention.
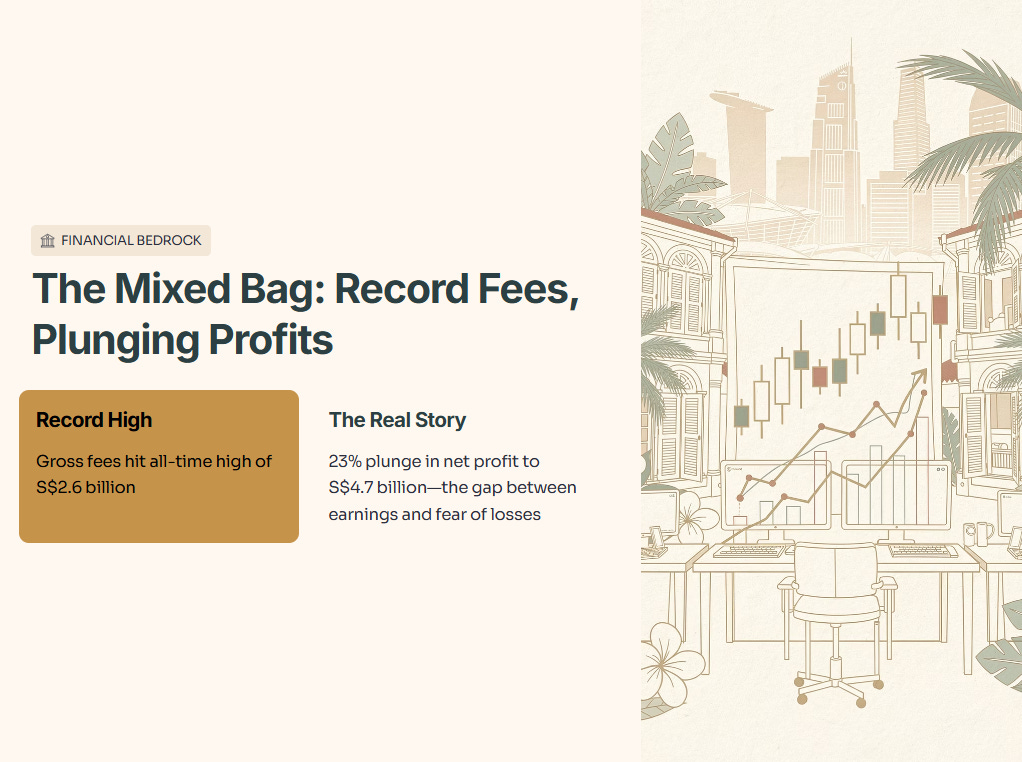
For the headlines, this report is a mixed bag. Gross fees hit an all-time high of S$2.6 billion. But the 23% plunge in net profit to S$4.7 billion tells a different story entirely. That gap is where your dividend lives. It is the gap between what the bank earns and what it is terrified of losing.
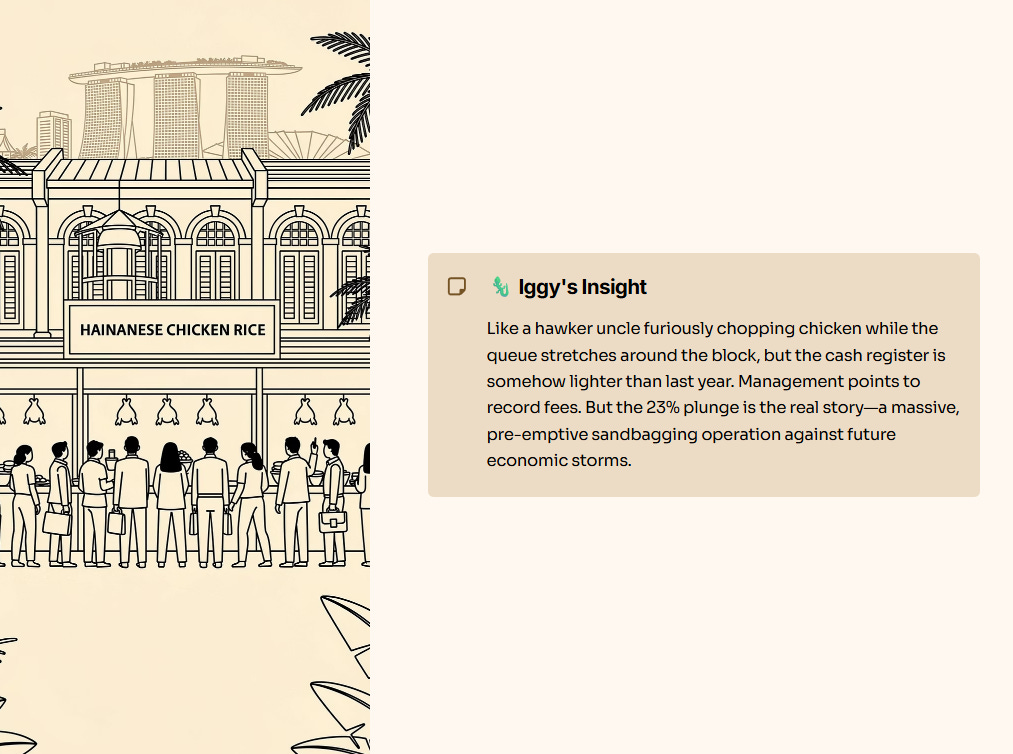
🦎 Iggy’s Insight:
When you look at UOB’s earnings today, it feels like watching a hawker uncle furiously chopping chicken while the queue stretches around the block, but at the end of the day, the cash register is somehow lighter than last year. Management points to record fees. But the 23% plunge in annual net profit is the real story here. It is not a sign of a broken business. It is a massive, pre-emptive sandbagging operation against future economic storms. They are paying for the umbrella before the rain even starts. My job today is to figure out if that umbrella is big enough for your retirement.
In This Article:
The Slide-by-Slide Audit: Exposing the Fortress
Net Fee Income
Asset Quality and Credit Costs
The Capital Fortress
The Reality Check: Models over Management
The Performance Scorecard: Cash is King
The Debt and Liquidity Check
The Forward Outlook: Believing the Narrative?
InvestingPro Reality Check
The Forensic Verdict
About Iggy & the Elite 170
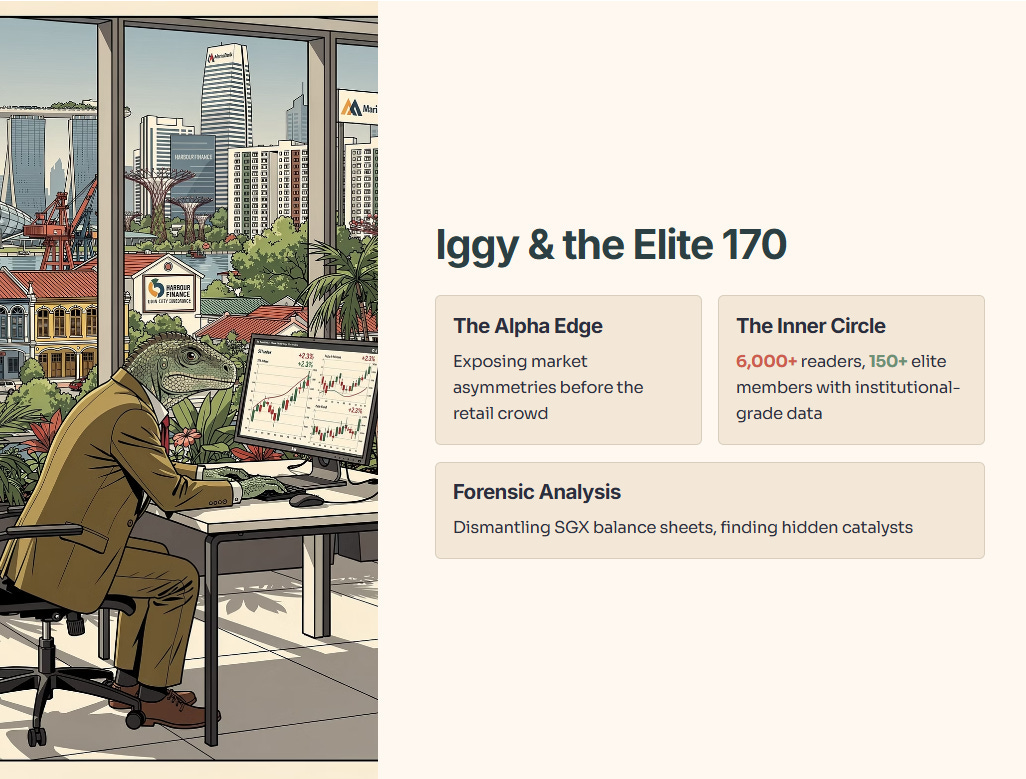
In the Singapore market, the gap between a smart entry and becoming someone else’s exit liquidity can be as little as 48 hours. That’s the cost of informational lag.
Free subscribers get my analysis up to 14 days later. The Elite 170 get it the moment it’s ready.
Your Edge: The S$9 Ultimate Value Pass bundles zero-day video intel, forensic reports, and analyst cheatsheets into one institutional-grade feed — for less than a Singaporean breakfast.
The Slide-by-Slide Audit: Exposing the Fortress
We process the earnings report linearly. No skipping the hard numbers. We start with the lifeblood of any bank.
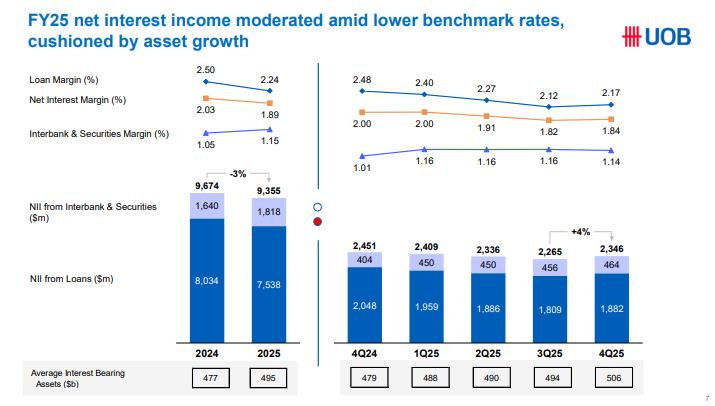
UOB reported a full-year Net Interest Margin of 1.89%, contracting down to 1.84% in the fourth quarter of 2025.
🎓 Educational Note: Let’s define that term. Net Interest Margin (NIM) is like the markup a chicken rice stall owner charges. It is the difference between what he pays for the raw chicken, which are the deposit rates, and what he sells the cooked rice for, which are the loan rates. So what does this mean for you? A shrinking NIM means the bank is making less profit on every dollar it lends out.
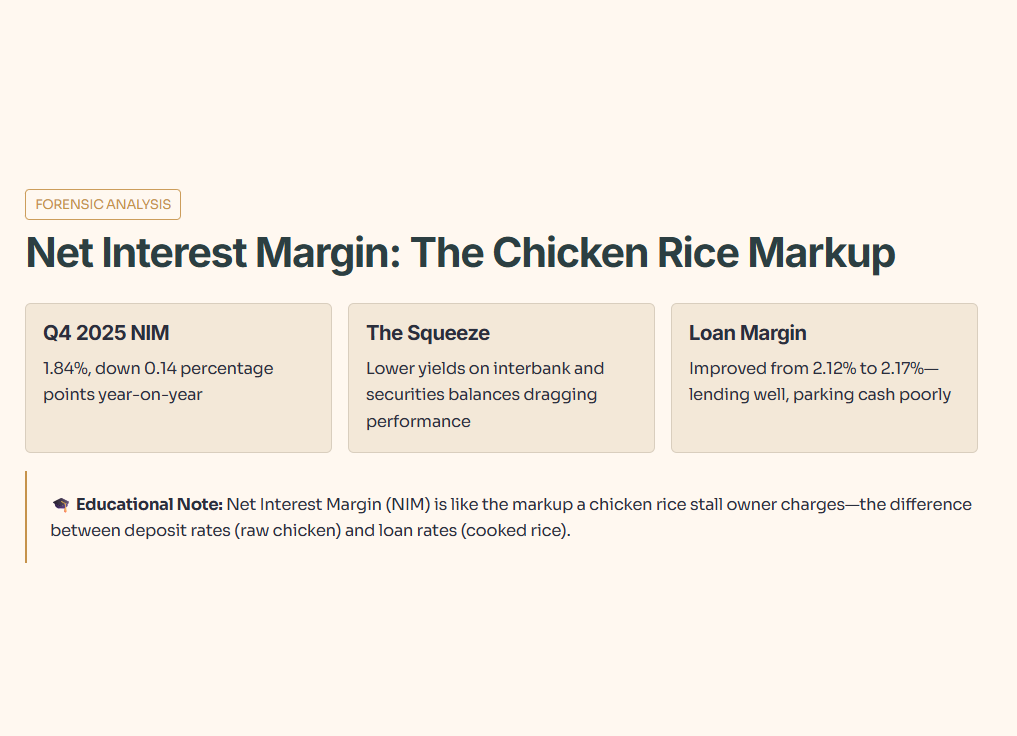
Let us apply the five layers of context to this 1.84% figure. As a raw fact, the fourth-quarter NIM sits firmly at 1.84%. Looking at the historical benchmark, this is down 0.14 percentage points year-on-year, sitting below the bank’s own historical averages for the cycle. In peer context, compared to local heavyweights like DBS or OCBC, 1.84% is slightly defensive, showing they are managing funding costs aggressively to defend this floor.
In a forward scenario, if benchmark rates drop another 10% next quarter, this NIM will likely compress closer to 1.75%. If rates stay flat, their active deposit management might hold it at 1.80%. So what does this mean for you? For a Singaporean managing an SRS portfolio, compressing NIM limits future dividend growth. The era of effortless rate-driven profit is officially over.
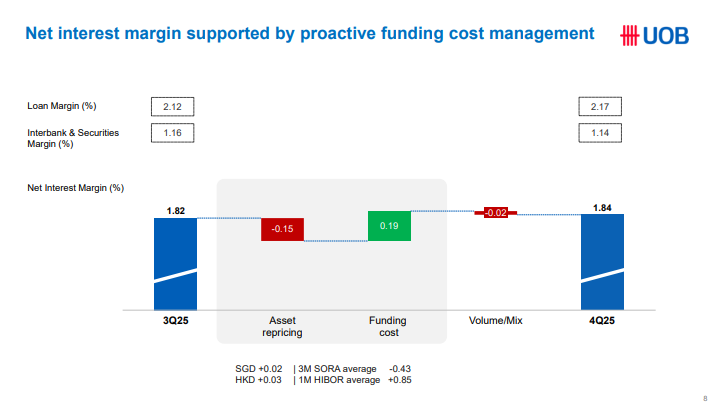
And let’s be honest, they are not wrong to blame lower benchmark rates. But here is the uncomfortable truth. UOB’s loan margin actually improved slightly from 2.12% in the third quarter to 2.17% in the fourth quarter. The drag came almost entirely from lower yields on interbank and securities balances. They are lending well to customers, but parking their excess cash poorly.
Net Fee Income
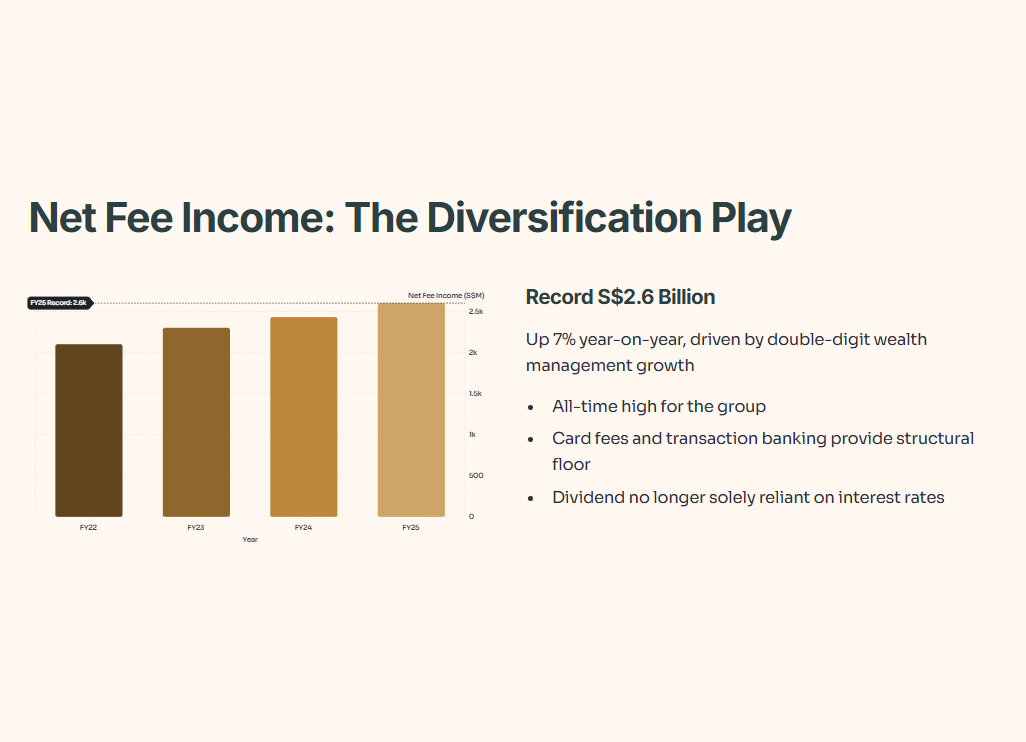
The bank posted a record S$2.6 billion in net fee income for the full year 2025.
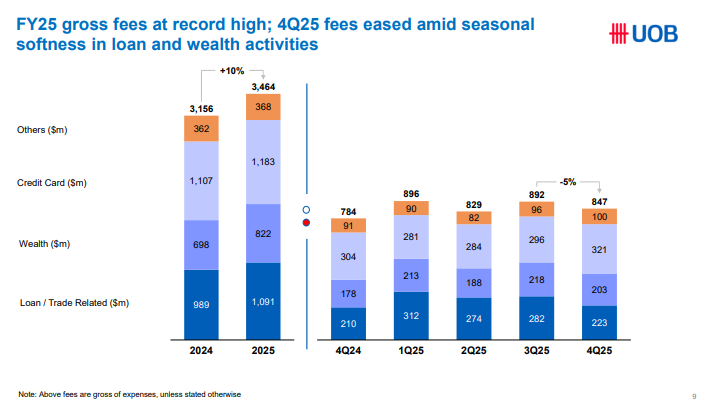
Let us break down this S$2.6 billion using our forensic layers. [cite_start]The raw fact is that net fee income hit a massive S$2.6 billion, up 7% year-on-year. Historically, this is an all-time high for the group, driven by double-digit growth in wealth management. In peer context, this matches the aggressive wealth expansion seen across the entire Singapore banking sector, as everyone pivots to fee-based income. Looking at a forward scenario, if market volatility spikes 10%, wealth management fees will drop sharply. But card fees and transaction banking provide a very strong structural floor. So what does this mean for you? It means the bank is successfully diversifying its revenue streams. Your dividend is no longer solely reliant on the MAS or the US Federal Reserve moving interest rates.
Asset Quality and Credit Costs
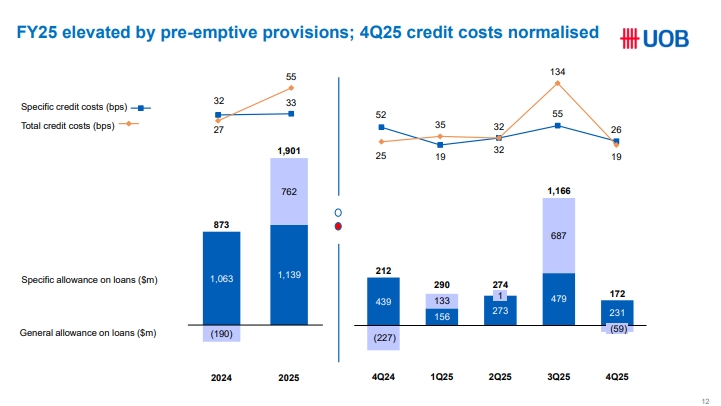
This is where the math gets brutal. Total allowance for credit and other losses hit a staggering S$2.04 billion for the year, with total credit costs settling at 55 basis points.
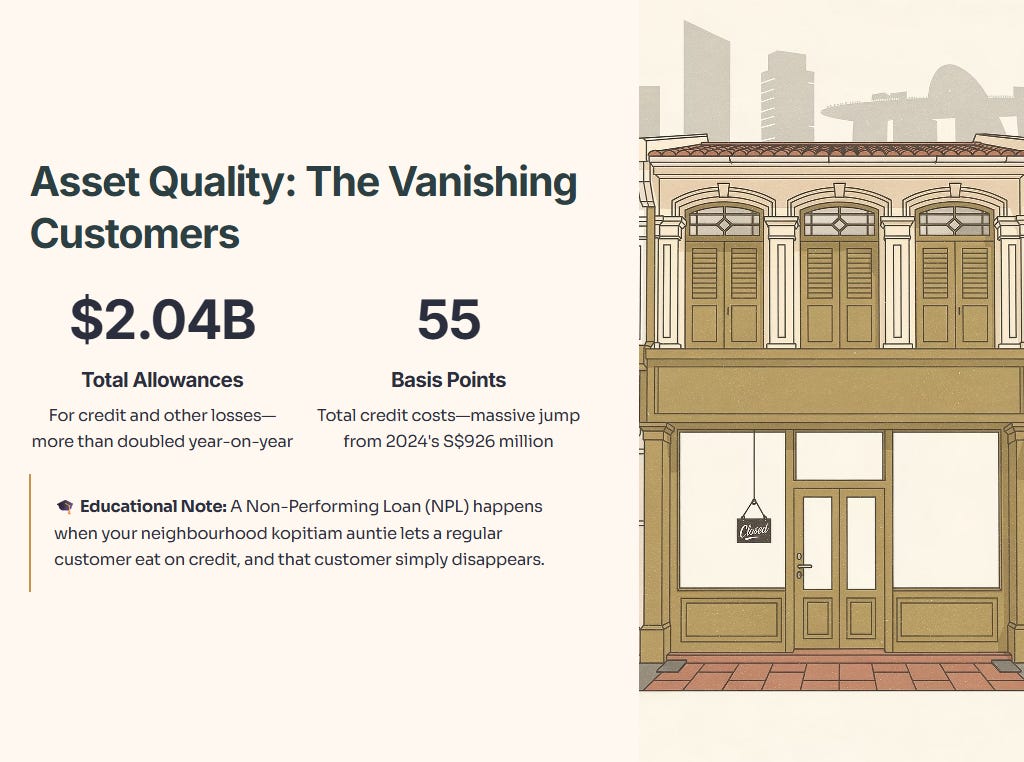
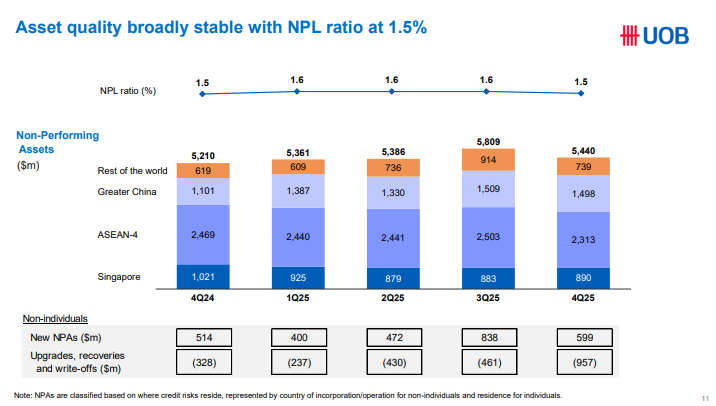
🎓 Educational Note: Let’s pause on that term. A Non-Performing Loan (NPL) happens when your neighbourhood kopitiam auntie lets a regular customer eat on credit, and that customer simply disappears. The NPL ratio measures how many of those customers vanished. So what does this mean for you? High credit costs mean the bank is taking cash directly out of the dividend pool to cover these vanishing customers.
Applying our five layers to the 55 basis points credit cost reveals a stark picture. The raw fact is a total credit cost of 55 basis points for the year. Historically, this is a massive jump, as 2024 allowances were only S$926 million. They more than doubled year-on-year. In peer context, this level of pre-emptive provisioning is heavier than typical regional averages, showing UOB is deliberately taking the pain right now. In a forward scenario, if the macro environment worsens by 10%, UOB already has the cash set aside to absorb the blow. If it improves by 10%, these provisions become a massive tailwind when written back into profits. So what does this mean for you? For a 55-year-old relying on UOB dividends to fund retirement, this short-term profit hit secures long-term dividend stability.
The Capital Fortress
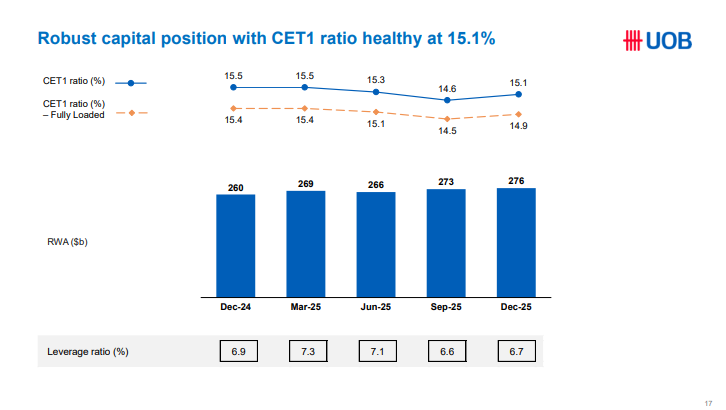
The bank reported a CET1 ratio of 15.1% in the fourth quarter.
🎓 Educational Note: Let’s define that. The Common Equity Tier 1 (CET1) ratio is the emergency cash a family keeps hidden in a Milo tin under the bed. It is pure, unencumbered safety money. So what does this mean for you? A higher ratio means the bank can survive an absolute catastrophe without needing a government bailout.
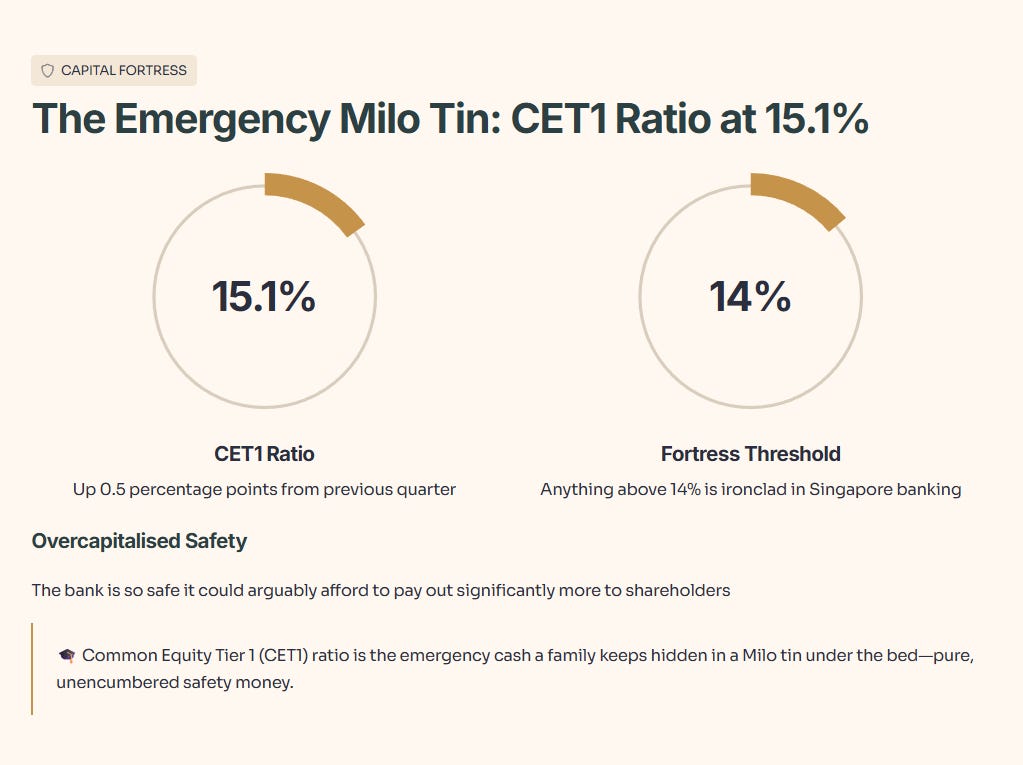
We push this 15.1% through the five forensic layers. The raw fact is that CET1 sits at a very healthy 15.1%. Historically, this is up 0.5 percentage points from the previous quarter. In peer context, anything above 14% in the Singapore banking sector is an ironclad fortress. Looking forward, if the economy crashes 10%, this buffer easily absorbs the shock without triggering a capital raise. So what does this mean for you? It means the bank is overcapitalised. It is so safe that it could arguably afford to pay out significantly more to shareholders.
Here is the double-entry proof. The data does not lie.
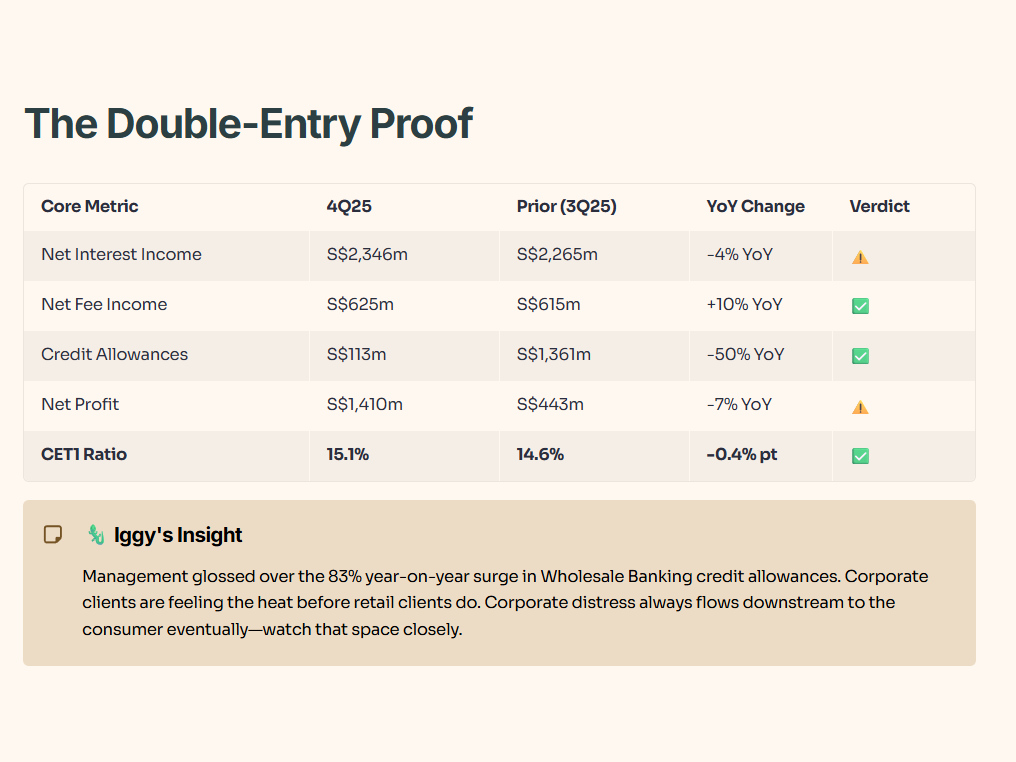
The number that matters most here is the CET1 Ratio at 15.1%, because it proves the balance sheet remains a fortress despite the massive annual profit hit. Net profit for the quarter rebounded to S$1,410 million, largely from lower credit costs compared to the devastating third quarter.
🦎 Iggy’s Insight:
Management spent surprisingly little time discussing the massive 83% year-on-year surge in credit allowances for the Wholesale Banking division. They glossed over it to highlight transaction banking resilience. But for a forensic investor, that wholesale credit spike is the loudest alarm bell in the room. It tells us that corporate clients are feeling the heat before retail clients do. The retail non-performing loan numbers look perfectly fine right now. But corporate distress always flows downstream to the consumer eventually. If wholesale is catching a cold, retail is going to sneeze in about two quarters. Watch that space closely.
The Reality Check: Models over Management
Source: InvestingPro Data. Unlock these institutional tools for your own portfolio: Use code INVESTINGIGUANA for an exclusive 50% Discount.
🏛️ [Claim Your 50% Discount Here]
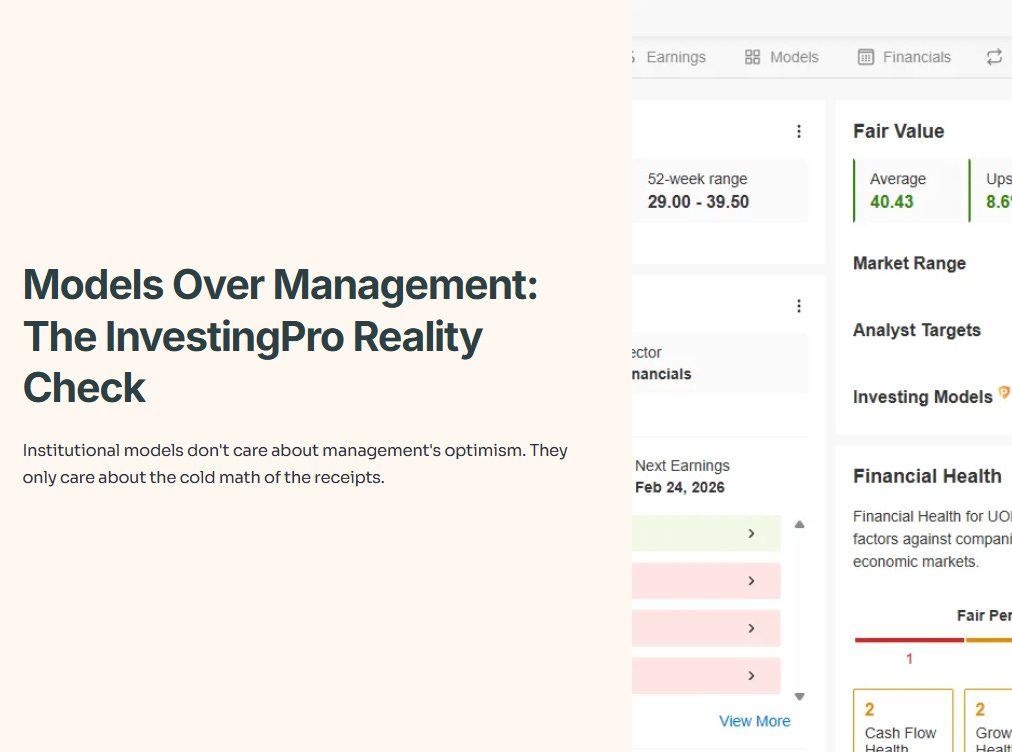
The slides provided by management offer a polished narrative of record fees and “pre-emptive” safety. But here is the uncomfortable truth: institutional models like InvestingPro do not care about management’s optimism. They only care about the cold math of the receipts.
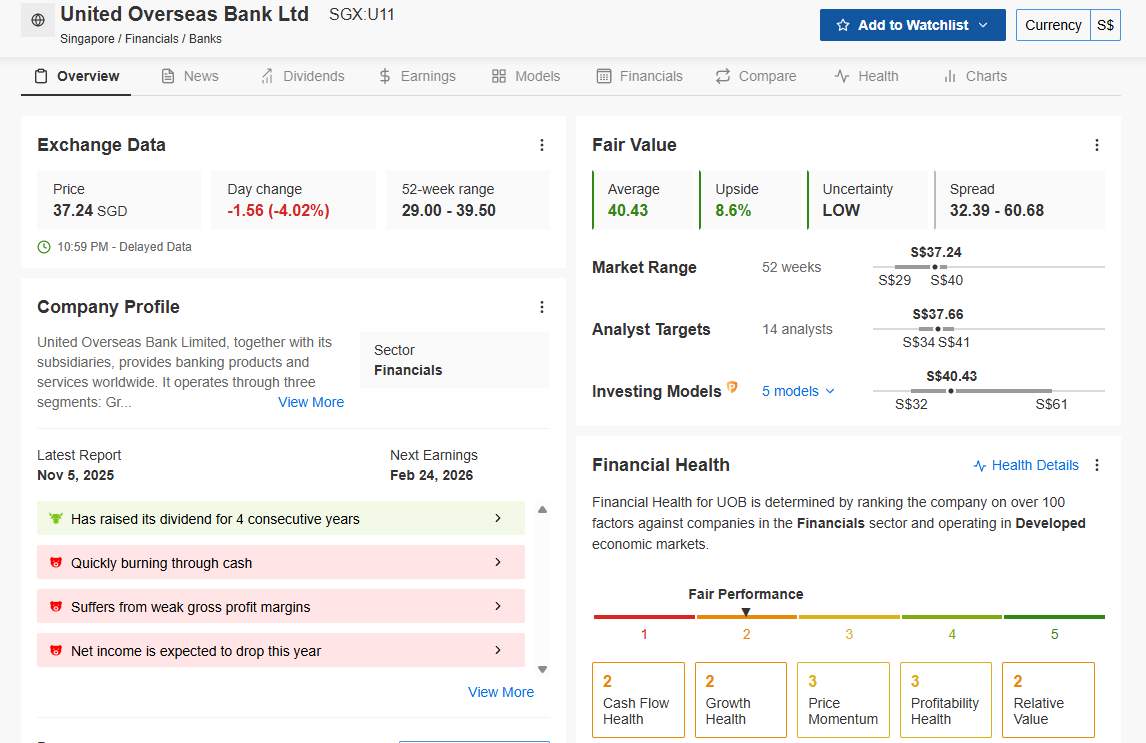
I checked the InvestingPro Fair Value model, which removes human bias by aggregating five institutional-grade financial metrics, including DCF and P/E multiples. The model shows UOB’s fair value at S$40.43, representing a modest 8.6% upside from the current price of S$37.24. While this suggests a margin of safety, InvestingPro flags a “LOW” uncertainty on this valuation while simultaneously dropping three “red chili” warnings we cannot ignore.
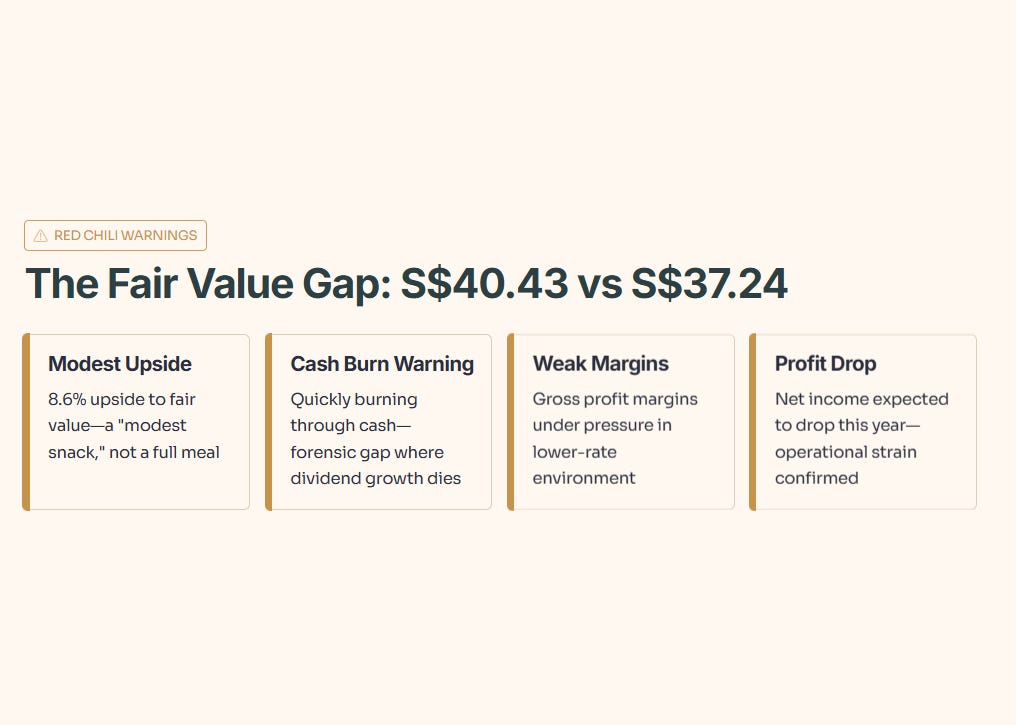
Specifically, the model notes that UOB is “quickly burning through cash,” suffers from “weak gross profit margins,” and that “net income is expected to drop this year“. This confirms my forensic suspicion that the 23% profit drop to S$4.7 billion isn’t just about “sandbagging” with provisions—it reveals real operational strain in a lower-rate environment.
“You’ve seen the three red-chili warnings—now here’s the single number that decides whether UOB is a safe income anchor or a trap at today’s price.”
