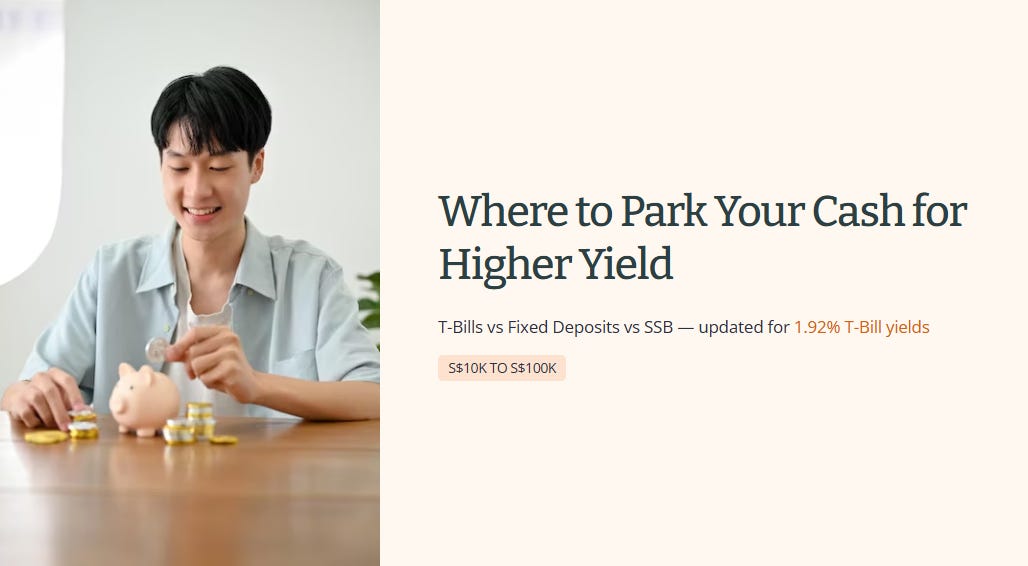
Where to Park Your Cash for Higher Yield: T-Bills vs Fixed Deposits vs SSB (Updated for 1.92% T-Bill Yields)
Fixed deposits haven’t kept pace. Here's how T-bills, SSBs, fixed deposits and cash funds compare for S$10,000 to S$100,000 right now.
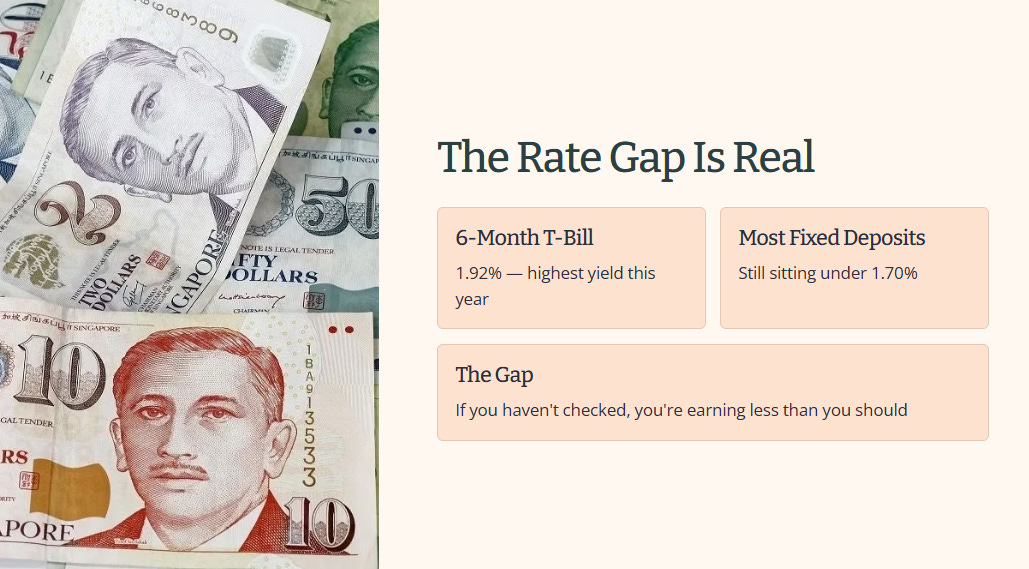
The 6-month T-bill just hit 1.92%, its highest yield this year, while most fixed deposits are still sitting under 1.70%. If you haven’t checked where your cash sits since the last time rates moved, you may be earning less than you could. Here’s exactly where T-bills, SSBs, fixed deposits, and cash funds stand today, and what to check before deciding where your money goes.
Whether you’re the type who wants a fixed number and zero surprises, or you’re comfortable with a bit of daily fluctuation if it means a meaningfully higher yield, the maths changed this month.
I re-run this comparison myself every time T-bill yields move by more than 10 basis points in a single auction, because the gap between the lazy default and the actually-good option keeps widening. This month, that gap got wide enough to walk through properly, instrument by instrument.
Independent view: I am not paid by any bank, platform, or product provider mentioned in this article, and I do not receive referral or affiliate fees for any links or recommendations.

The Current Lineup
Insight Callout
The Trade Nobody Names
What’s Next
Insight Callout
Forensic Stance: S$10,000 Allocation
Forensic Stance: S$100,000 Allocation
The Bottom Line
The Current Lineup
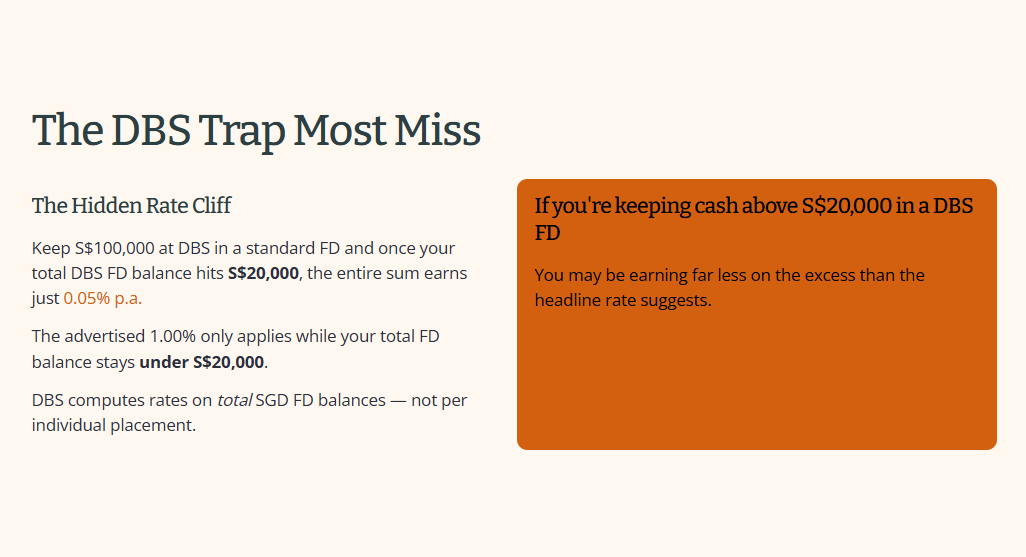
If you are holding more than S$20,000 in a DBS fixed deposit, do not assume the headline rate applies to the whole balance. DBS’s published SGD fixed-deposit table uses balance bands, and the applicable rate depends on the bank’s current rate structure and placement terms. Check the actual rate attached to the deposit before comparing it with T-bills or cash funds.
DBS's table applies its rate bands by balance. Confirm on DBS's own page whether the band is set by your total SGD fixed deposit balance or by each placement.
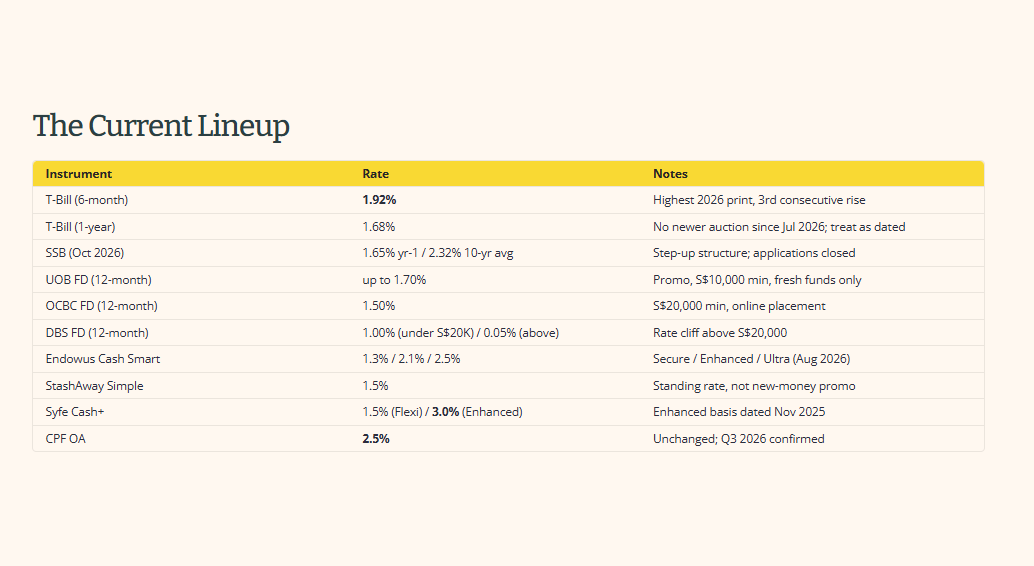
Here’s the full picture, as of late September 2026:
💡 Insight Callout
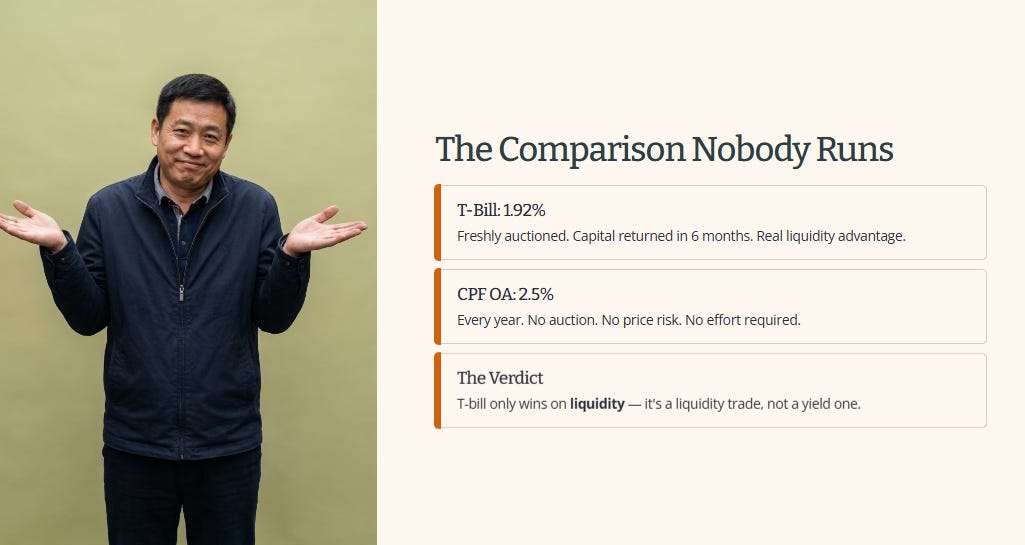
The 6-month T-bill’s 1.92% is being framed everywhere as the standout rate of the year. Held up against CPF OA’s 2.5% base rate, it isn’t. OA pays 2.5% for October to December 2026, the legislated minimum, with no auction and no market-price movement. The rate is reviewed quarterly, and the bank rates it is pegged to averaged only 0.32% in the latest reading, so the minimum is what OA is paying.But OA money is much less accessible than a T-bill. It can only be used for permitted purposes, so it cannot be tapped in an emergency. A T-bill returns your principal in six months, although it is still not instant-access cash. That is a real advantage, but it is a liquidity trade, not a yield one. Read the OA rate as a benchmark for money already in CPF, since you can't top up OA on its own.
Access is restricted to permitted uses, while cash remains immediately available. That’s a real advantage, but it’s a liquidity trade, not a yield one. The comparison almost nobody runs is the one that actually matters here.
The Trade Nobody Names
This isn't an argument to abandon T-bills. Most people need at least some of their cash liquid, and OA money genuinely isn’t. But the framing matters. Every time a T-bill auction result gets treated as exciting news, it’s worth remembering that a no-effort 2.5% has been sitting in OA the whole time, for the money you have already set aside for longer-term needs.
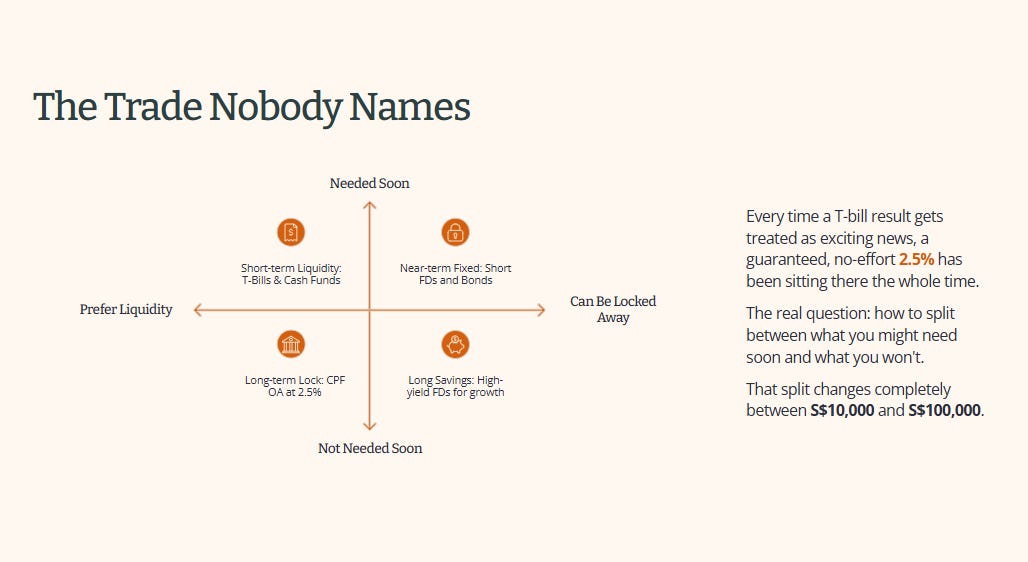
The real question isn’t which single instrument performs best. It’s how to divide your money between funds you may need soon and funds you can leave untouched. That allocation can look completely different with S$10,000 compared with S$100,000.
📖 What’s Next
The OA comparison above covers only money you’re comfortable setting aside. The next section looks at how to allocate S$10,000 and S$100,000 while keeping the funds accessible. At the larger amount, DBS’s rate tiers can have a bigger impact on the outcome than many people expect.
This article would normally continue beyond the paywall, but I’m making this edition available to everyone for free.
💡 Insight Callout
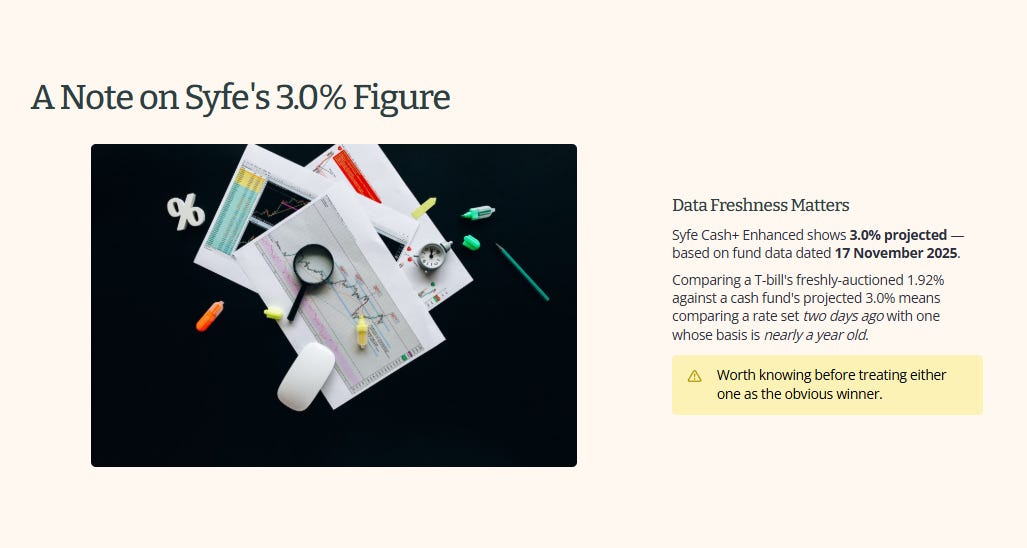
Syfe’s page currently displays a projected 3.0% return, but the underlying fund-manager data shown on the page is dated 17 November 2025. Treat that figure as stale or at least requiring confirmation, rather than as a directly comparable September 2026 yield.A dated basis isn't a red flag on its own, since cash fund yields don't need daily repricing to stay accurate, but it does mean the number moves less often than the T-bill curve it’s implicitly being compared against. Comparing a T-bill’s freshly-auctioned 1.92% against a cash fund’s projected 3.0% means comparing a rate set at the 24 September auction with one whose basis is about ten months old. Worth knowing before treating either one as the obvious winner.
Forensic Stance: S$10,000 Allocation
At this amount, minimum-deposit requirements can eliminate options before the interest rate becomes relevant. OCBC’s S$20,000 fixed-deposit minimum is out of reach, while UOB’s S$10,000 minimum uses the entire amount. T-bills, Singapore Savings Bonds, and the cash-management platforms in this comparison are more accessible, with no significant minimum-deposit hurdle at S$10,000.
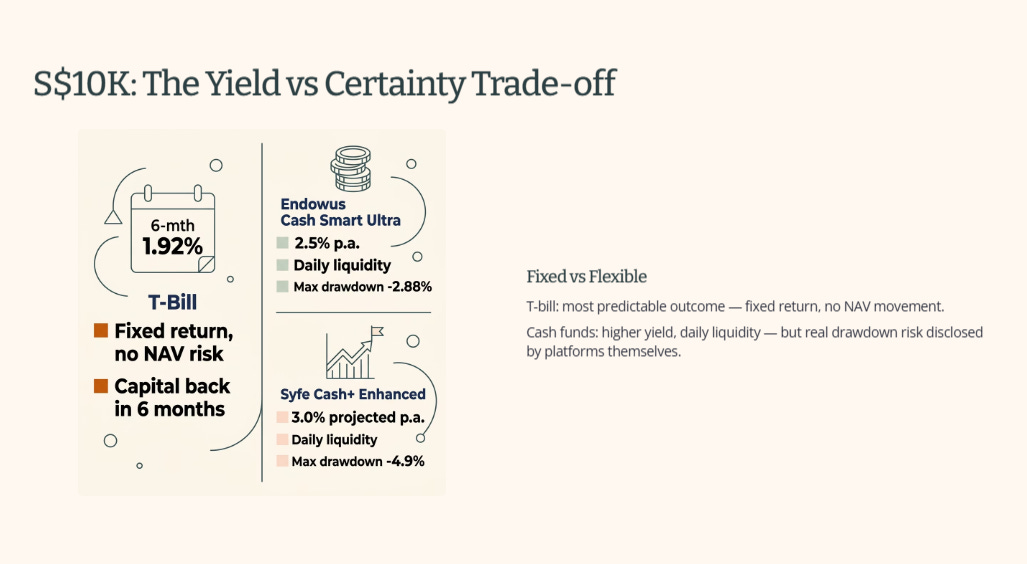
For money you can leave untouched until maturity and want a predictable outcome, the 6-month T-bill's 1.92% is the most predictable option compared here, no NAV movement, no fund-level risk, a fixed return in six months.
For capital that can tolerate small day-to-day fluctuation in exchange for a higher number, Endowus Cash Smart Ultra and Syfe Cash+ Enhanced may offer higher projected returns and easier access than a six-month T-bill, but they are not guaranteed deposits. Returns can change, withdrawals may take time to settle, and the underlying portfolios can lose value.
The tradeoff is real: Ultra has shown a historical maximum drawdown of negative 2.88%, Cash+ Enhanced negative 4.9%, both disclosed by the platforms themselves. That's the cost of easier access plus a higher projected yield, instead of a fixed return. Both disclosed drawdowns are larger than a full year of the projected yield: 2.88% against 2.5%, and 4.9% against 3.0%.
That’s the S$10,000 comparison. The maths changes again when the DBS question starts to matter at S$100,000.
Forensic Stance: S$100,000 Allocation
This is where the DBS question stops being a footnote.
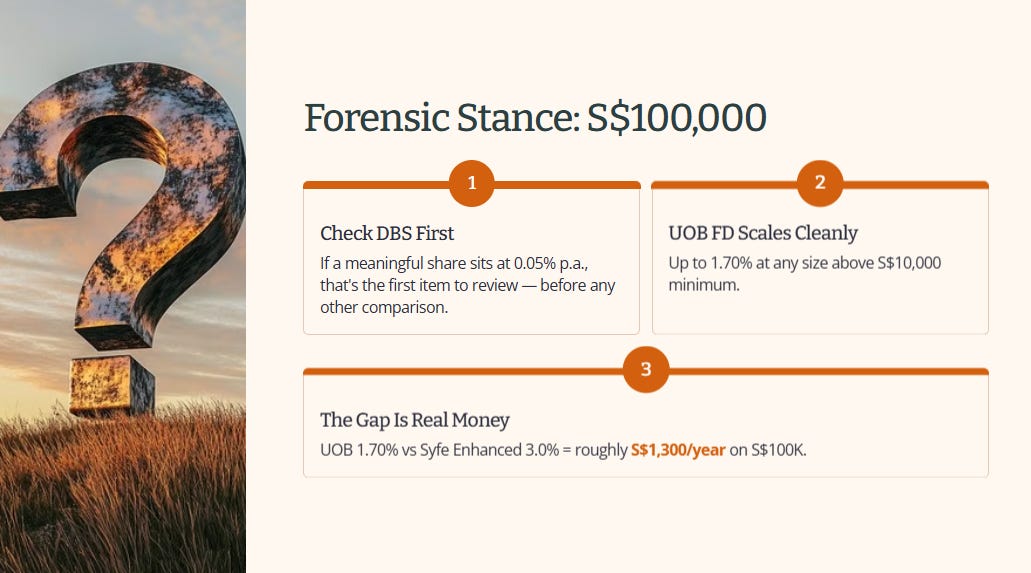
The S$20,000 threshold appears in DBS’s published SGD fixed-deposit rate table, where deposits above that level may receive a much lower board rate. But this does not mean every DBS cash balance automatically earns that rate. The first step is to check whether the S$100,000 is sitting in an ordinary savings account, a DBS Multiplier Account, or an existing fixed deposit that has renewed at the prevailing rate. If a meaningful portion is earning only a low base or renewal rate, reviewing that balance should come before comparing the alternatives below.
UOB's 12-month promotional FD at up to 1.70% applies to fresh funds above its S$10,000 minimum. But at S$100,000, the difference between that rate and a higher-yielding cash fund becomes meaningful. The difference between UOB’s rate and Syfe Cash+ Enhanced’s 3.0% projected works out to roughly S$1,300 a year on this sum if the projection holds. Given the dated basis discussed above, treat that as an upper-end illustration. It also carries investment and capital risk that a qualifying bank deposit does not.
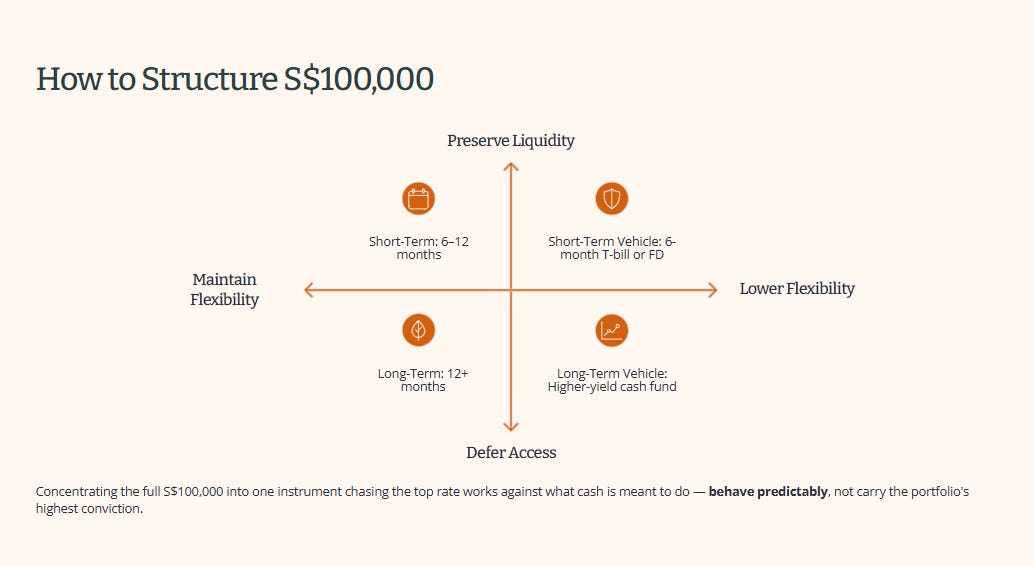
One way to structure S$100,000 is to match each portion to when you expect to need it. Money needed within six months can stay in an accessible account. Money you can leave untouched for six to twelve months could go into a six-month T-bill or comparable fixed deposit. Money unlikely to be needed for at least twelve months could go into a higher-yielding cash fund, provided you are comfortable with fluctuations and the possibility of a loss, since a temporary drop matters less when you don't need to withdraw
Putting the entire S$100,000 into whichever instrument offers the highest headline rate misses the purpose of cash. Cash should provide predictability and flexibility, rather than become the highest-conviction position in your portfolio.
You Shouldn’t Be Reading This Alone
Cash comparisons look simple until you read the fine print: balance bands, minimum deposits, and how old the data behind an advertised yield really is. That is the kind of detail I check before any call.
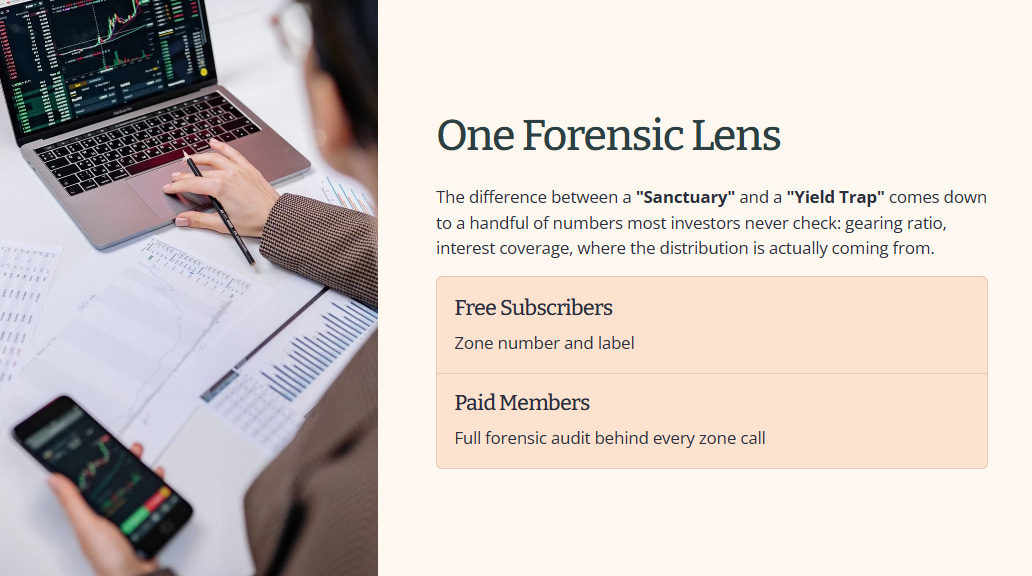
On stock coverage, free subscribers see the zone rating and headline label, and Paid Members get the complete forensic review behind each call, including the calculations, assumptions, and risks. This edition is free for everyone.
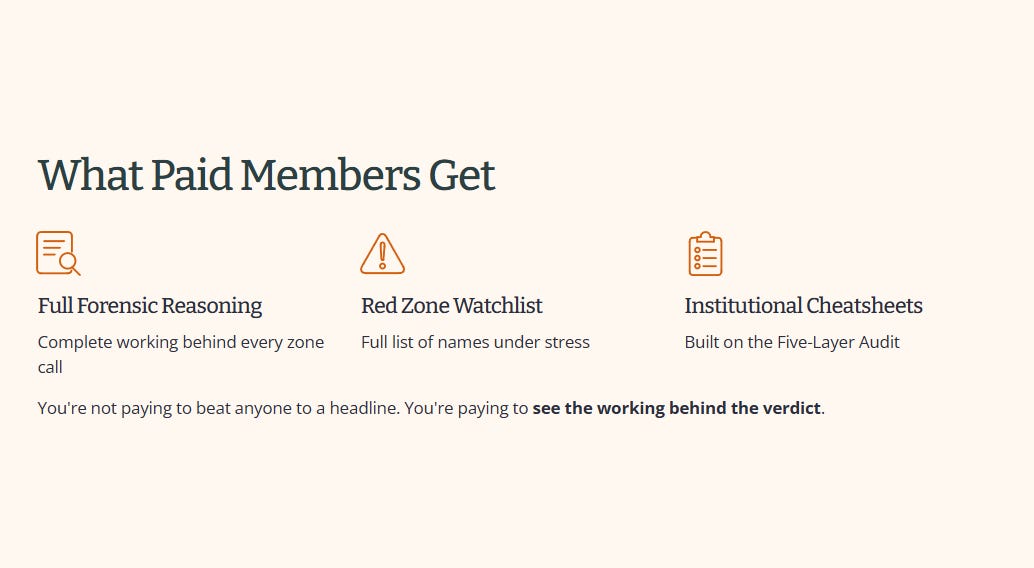
Membership also includes the full Red Zone watchlist and institutional-grade cheat sheets, all built around the same Five-Layer Audit used throughout the research. The value is not getting the news first. It is seeing the analysis behind the conclusion through the YouTube and Substack Combo plan.
The Bottom Line
Cash was never meant to compete with long-term equity or dividend returns, and nothing in this comparison changes that. But among cash-equivalent options, the gap between the account that’s never been checked and the one that actually fits the situation is wide enough right now to be worth thirty minutes. Start with whichever bank or platform currently holds the largest chunk of idle cash. If that’s a DBS FD above S$20,000, that’s the first item worth reviewing.
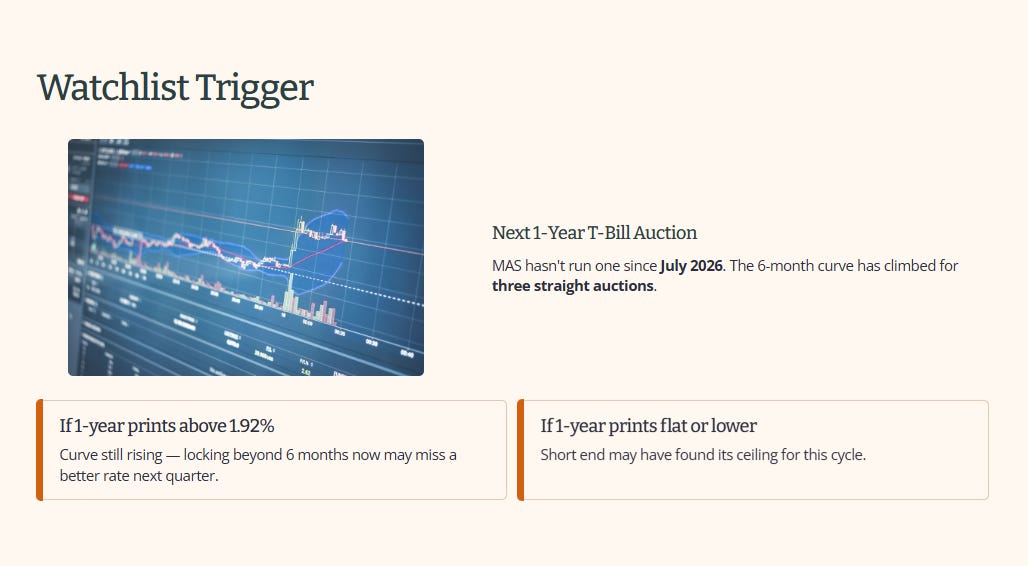
Watchlist Trigger: I’m tracking the next 1-year T-bill auction closely, since MAS hasn’t run one since July and the 6-month curve has climbed for three straight auctions. If the next 1-year print comes back meaningfully above 1.92%, it would suggest that the market is pricing higher yields at the one-year point than at the latest six-month auction. That could support the case for waiting or laddering rather than locking the entire amount for longer. If it comes in flat or lower than 1.92%, the curve may be showing less upward pressure, although one auction would not establish a trend.
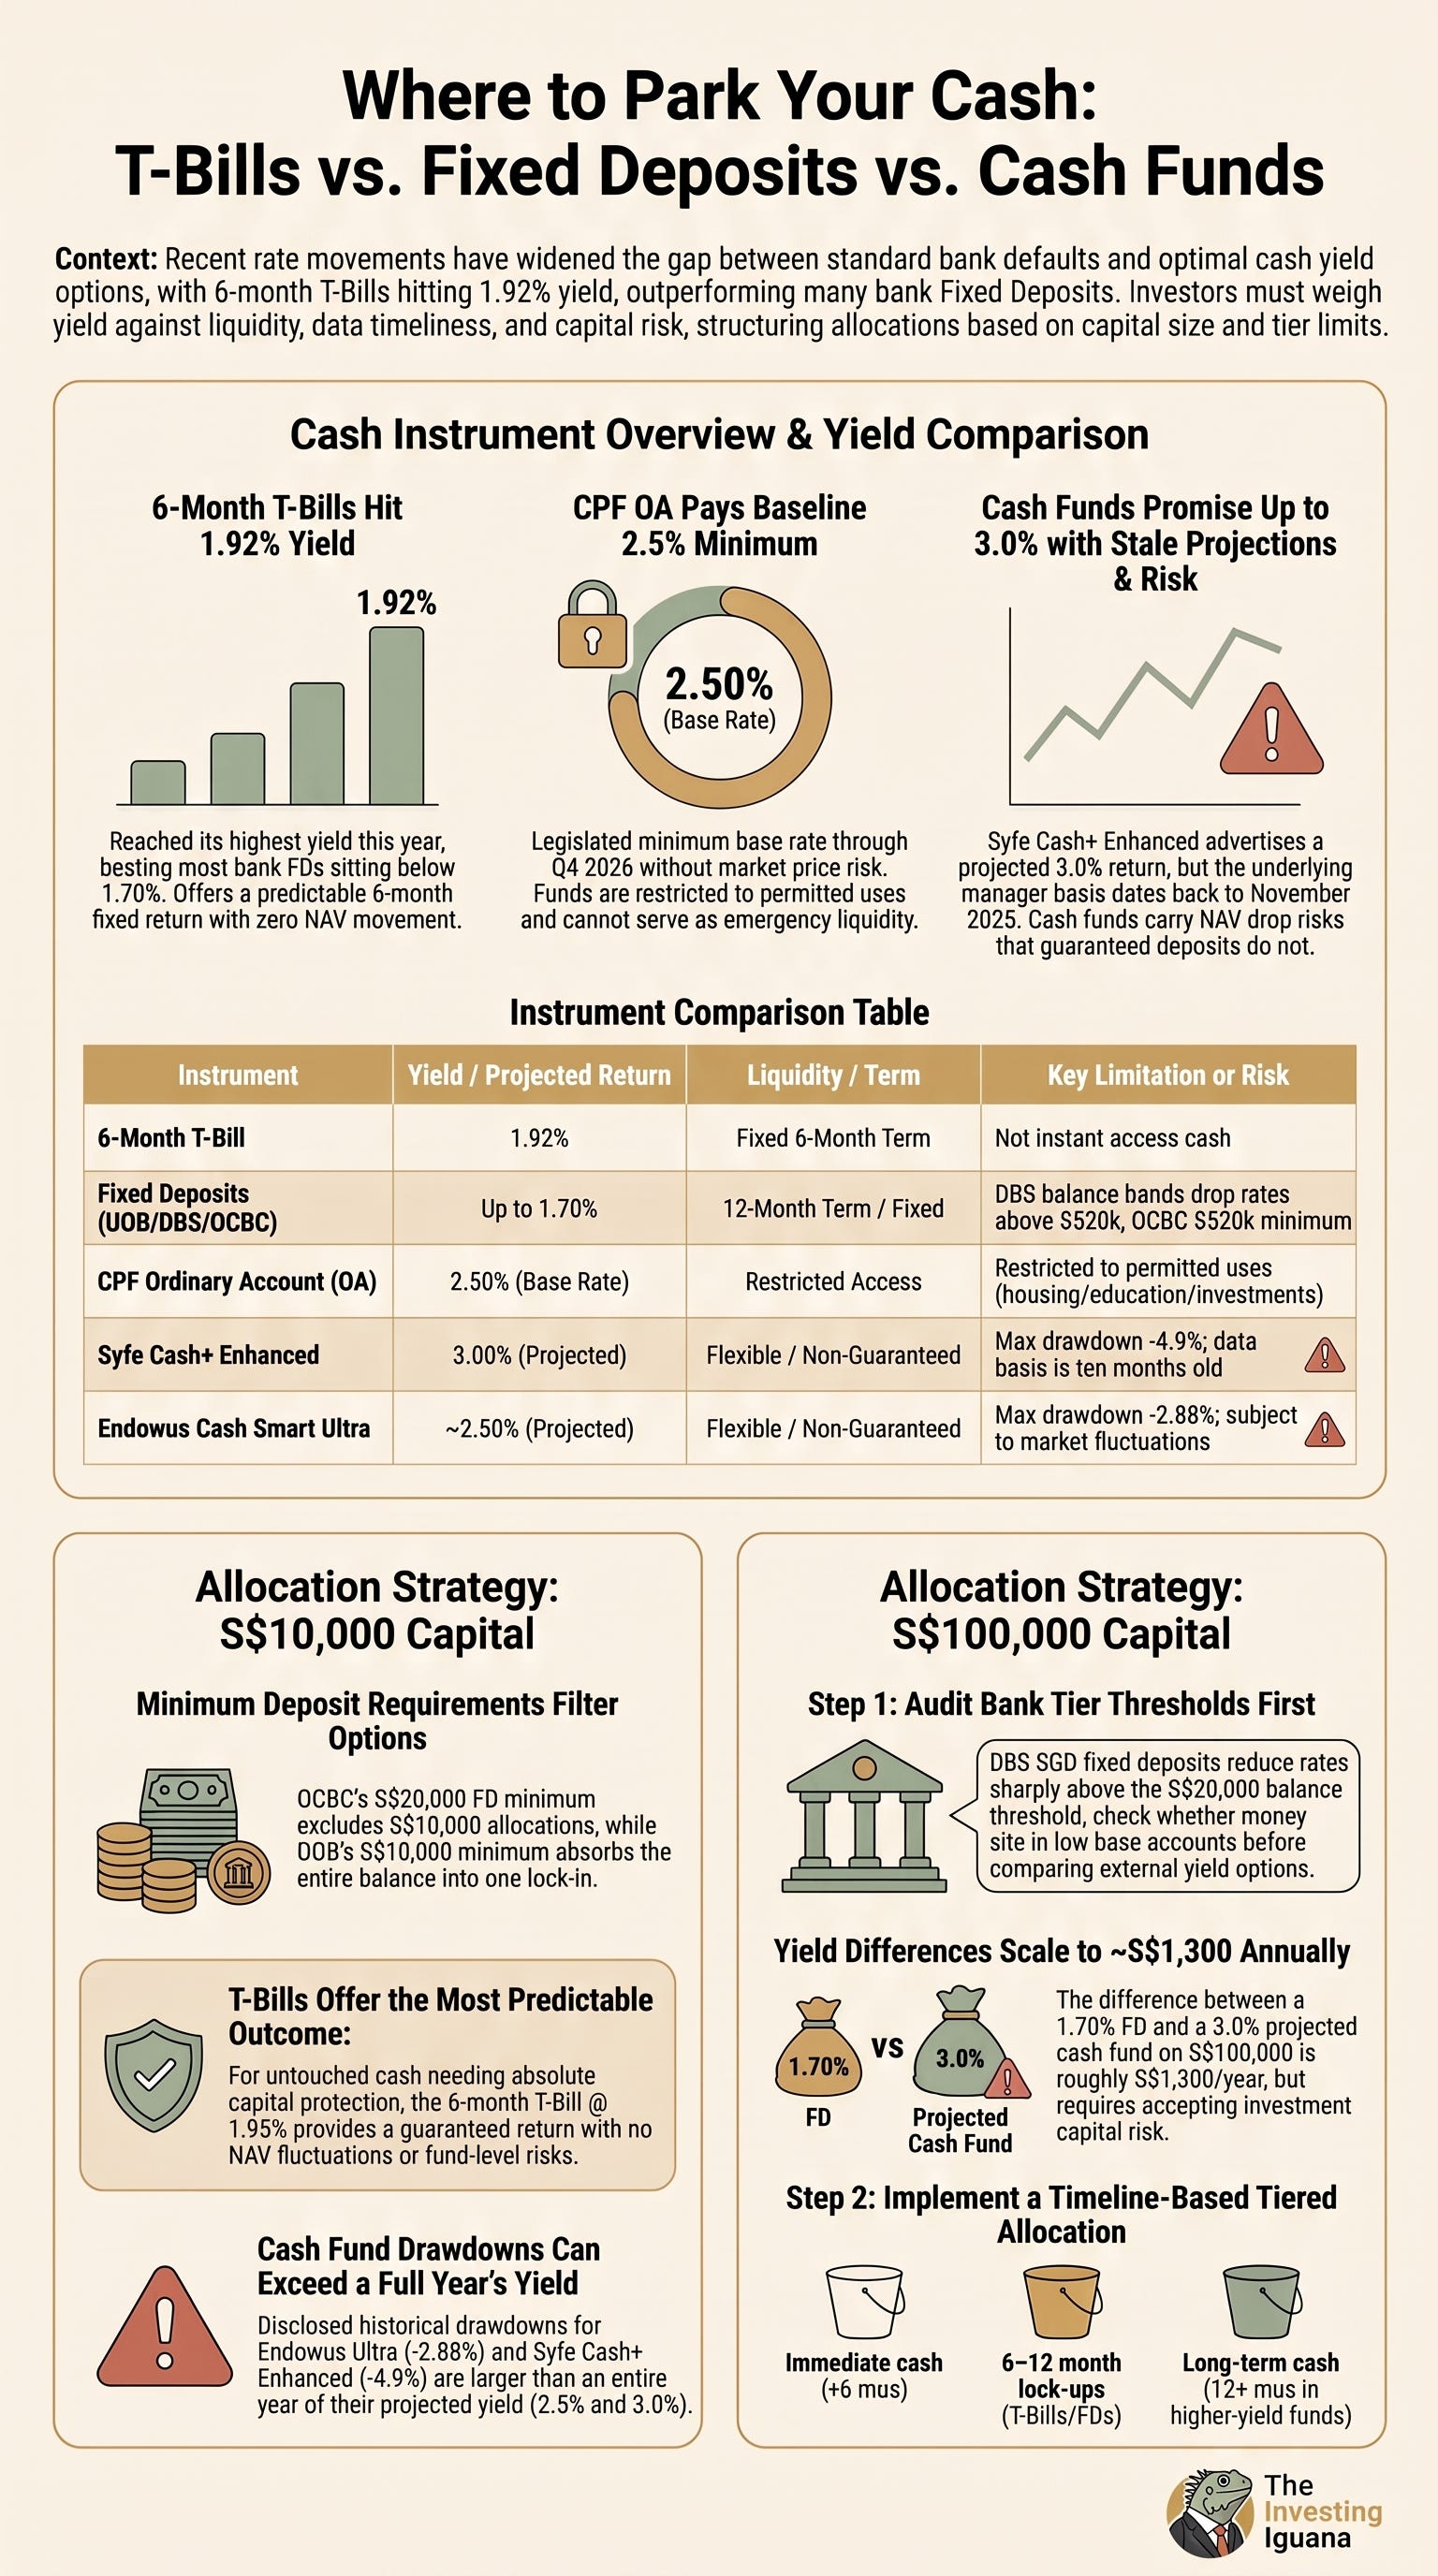
YOUR FORENSIC VERDICT, ONE PAGE.
The full audit is above. This is the Iggy Forensic Audit distilled to one A4 page — every number that matters, every flag that triggered, one clear verdict. Save it, print it, pull it out when this stock crosses your radar again, or when you need to refer to these data points for your retirement planning.

Iggy’s Forensic Disclaimer
This content is produced for educational and informational purposes only. I am not a financial advisor — I am a retail investor who applies forensic analysis to my own portfolio and shares that process publicly. Nothing here constitutes a recommendation to buy, sell, or hold any security, and no specific target prices or personalised financial advice are offered. Stocks assessed under Iggy’s Forensic Yield Standard are benchmarked against a 4.7% minimum yield hurdle; stocks flagged as Growth Watch fall below this threshold but demonstrate clean balance sheet metrics and an identifiable growth catalyst — these carry a materially different risk profile and are not suitable as yield replacements for income-dependent investors. All data is sourced from public filings and verified sources; where data is unverified it is explicitly flagged. All investments carry risk, including the potential loss of principal, and past performance is not indicative of future results. If you are making investment decisions involving CPF, SRS, or personal capital, please conduct your own due diligence or consult a MAS-licensed financial adviser before committing funds.