

Why Mapletree Logistics Trust’s Latest Results Matter to Your CPF Portfolio
Will MLT’s 10.5% DPU drop spell trouble for your retirement income, or is this just currency noise hiding a resilient logistics business underneath?

Mapletree Logistics Trust just released its 2Q FY25/26 results. The headline numbers look rough. Distribution per unit dropped 10.5% year-on-year. Gross revenue fell 3.2%. Net property income declined 3.3%. If you own MLT units in your CPF account or regular portfolio, these numbers might make you sweat.
But here’s the thing. Not all declines are created equal. Some come from broken business models. Others come from temporary headwinds that management can navigate. The question for Singaporean investors: which category does MLT fall into?
This deep dive walks you through all 10 slides of MLT’s financial presentation. We’ll break down what the numbers really mean, where the risks hide, and whether this REIT still deserves a spot in your dividend portfolio. By the end, you’ll know exactly what action to take.
In This Article:

• Who’s Writing This and Why You Should Care
• Slide-by-Slide Breakdown: What the Numbers Really Tell Us
• Slide 1: Key Highlights - The Good, Bad, and Currency-Ugly
• Slide 2: Financials - Year-on-Year Comparison Shows Currency Pain
• Slide 3: Half-Year Performance - Consistency in the Decline
• Slide 4: Quarter-on-Quarter Performance - Stability Emerges
• Slide 5: Balance Sheet and Capital Management - Fortress-Like Discipline
• Slide 6: Debt Maturity Profile - Well-Staggered and Manageable
• Slide 7: Interest Rate and Forex Risk Management - Multi-Year Hedging Strategy
• Slide 8: Distribution Details - When You Get Paid
• Slide 9: Geographical Diversification - Portfolio Spread Reduces Risk
• Slide 10: Tenant Trade Sectors and Operational Performance - Consumer-Focused Stability
• Active Portfolio Rejuvenation: Selling Old, Buying New
• Sustainability: Green Buildings and Solar Power
• Outlook: What Management Sees Ahead
• Market Context: How MLT Fits in the Broader REIT Landscape
• Risks: What Could Go Wrong
• China Continued Weakness
• Currency Volatility
• Interest Rate Surprises
• Trade War Escalation
• Oversupply in Key Markets
• Execution Risk on Divestments and Acquisitions
• Opportunities: What Could Go Right
• China Stabilization Accelerates
• Currency Reversal
• Lower Interest Rates Drive Cap Rate Compression
• E-Commerce Growth Continues
• Acquisitions from Sponsor Pipeline
• ESG Premium
• Valuation: Is MLT Cheap, Fair, or Expensive?
• Iggy’s Assessment: Hold with Conditional Buy on Further Weakness
• Next Steps: What You Should Do Now
• The Bottom Line
Who’s Writing This and Why You Should Care

I’m Iggy, host of The Investing Iguana. I focus on Singapore-listed stocks and REITs that make sense for CPF, SRS, and cash portfolios. I’ve tracked MLT through multiple quarters, analyzed its Asia-Pacific logistics portfolio, and compared it against peers like Ascendas REIT and Frasers Logistics Trust. My goal: help you make smarter decisions with your hard-earned savings.
This analysis pulls data straight from MLT’s official investor presentation dated 28 October 2025. We’ll examine financial performance, capital management, portfolio metrics, and management outlook. No fluff. No guessing. Just facts and what they mean for your wallet.
Slide-by-Slide Breakdown: What the Numbers Really Tell Us
Slide 1: Key Highlights - The Good, Bad, and Currency-Ugly
2Q FY25/26 Key Highlights
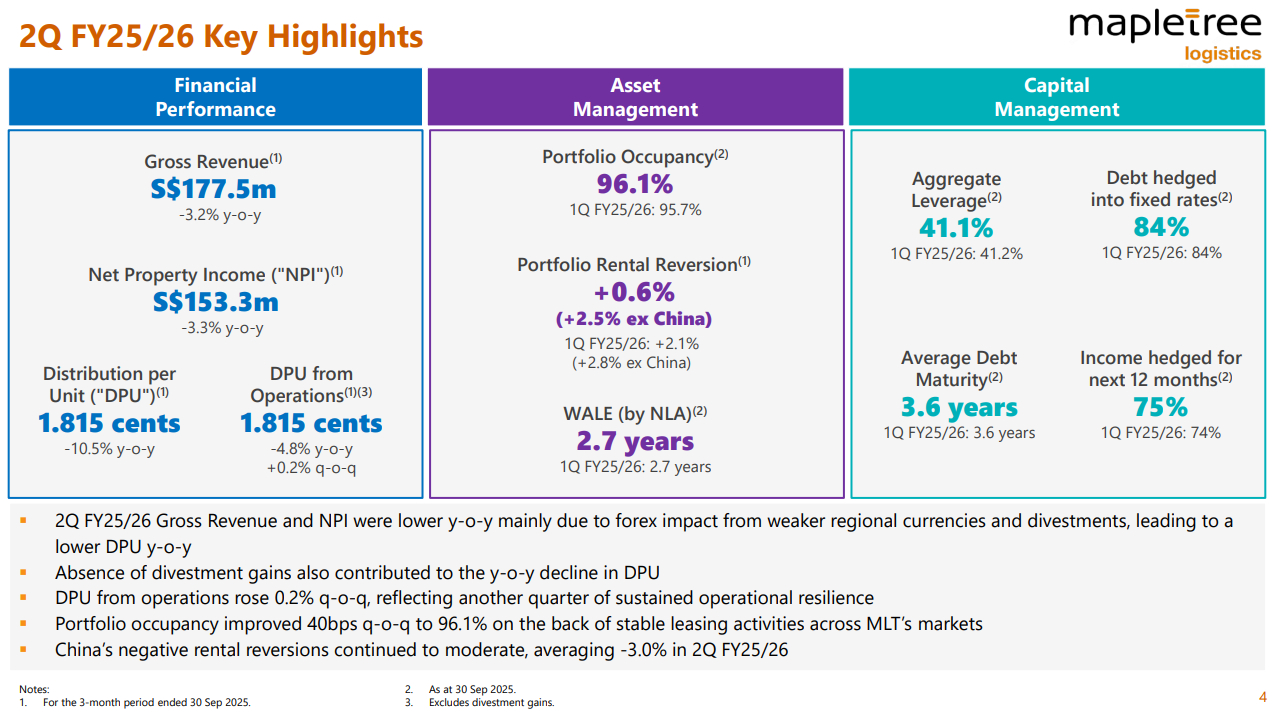
Let’s start with the performance scorecard. MLT’s 2Q FY25/26 ended 30 September 2025 with 175 properties, down from 178 at the start of the quarter.
What This Means for You
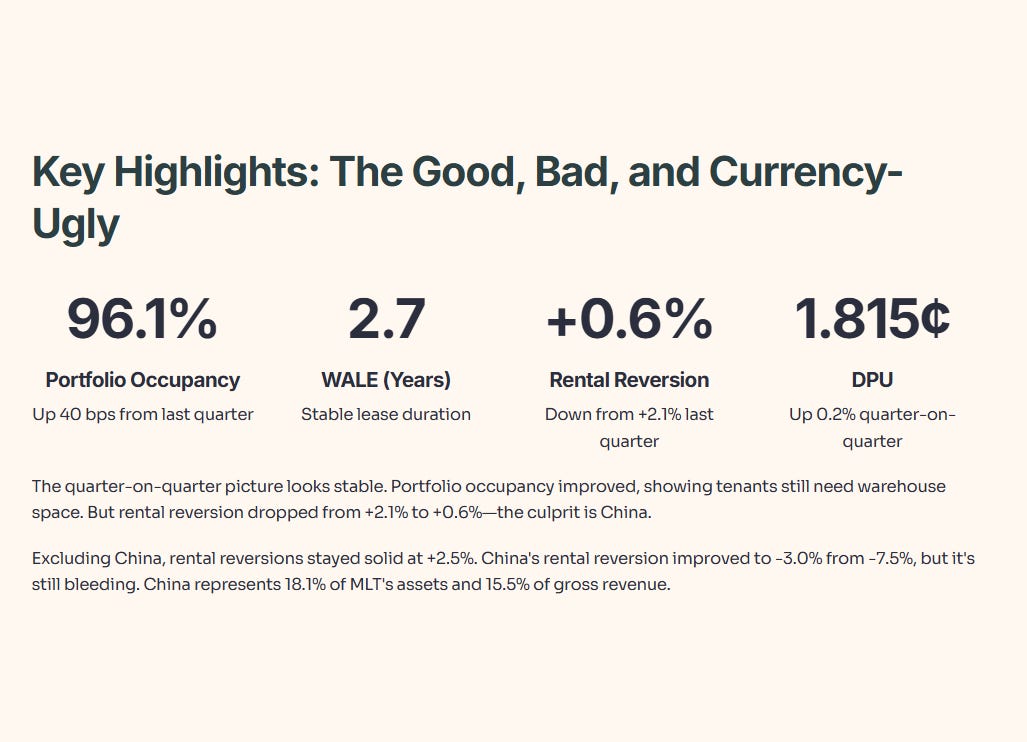
The quarter-on-quarter picture looks stable. DPU edged up 0.2% from last quarter. Portfolio occupancy improved by 40 basis points to 96.1%, showing tenants still need warehouse space. That’s reassuring in an environment where China-US trade tensions could hurt logistics demand.
But rental reversion tells a more complex story. The portfolio-wide figure dropped from +2.1% to +0.6%. That means when leases renew, MLT is getting less rent growth than before. The culprit: China. Excluding China, rental reversions stayed solid at +2.5%.
China’s rental reversion improved to -3.0% from -7.5% last quarter. That’s progress. The bleeding is slowing. But it’s still bleeding. China represents 18.1% of MLT’s assets and 15.5% of gross revenue. When your second-largest market keeps posting negative rent growth for seven consecutive quarters, that weighs on overall performance.
The capital management metrics stayed disciplined. Aggregate leverage sat at 41.1%, barely changed from 41.2% last quarter. Debt hedged into fixed rates remained at 84%. Average debt maturity held steady at 3.6 years. Income hedged for the next 12 months ticked up from 74% to 75%.
Slide 2: Financials - Year-on-Year Comparison Shows Currency Pain
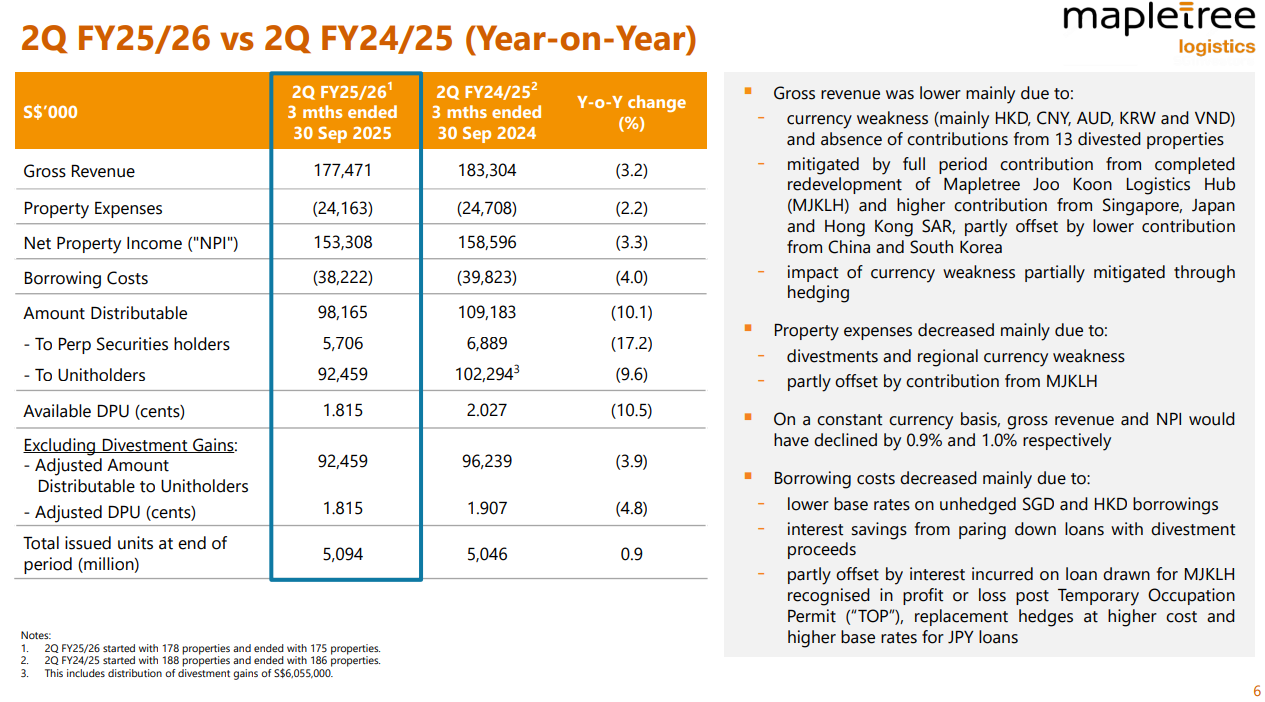
2Q FY25/26 vs 2Q FY24/25 Financial Performance
Now let’s compare this quarter against the same period last year. This is where the pain shows up.
Breaking Down the Decline
Gross revenue fell 3.2% year-on-year to S$177.5 million. Management blamed three factors:
Currency weakness hit hard. The Hong Kong Dollar, Chinese Yuan, Australian Dollar, Korean Won, and Vietnamese Dong all weakened against the Singapore Dollar. Since MLT reports in SGD but earns rent in local currencies, weaker foreign currencies translate to lower SGD revenue. Even though MLT hedges 75% of income for the next 12 months, the remaining 25% gets whacked by forex swings.
Divestments removed revenue streams. MLT divested 13 properties between 2Q FY24/25 and 2Q FY25/26. Selling assets boosts your balance sheet short-term but removes future rental income. That’s the trade-off of portfolio recycling.
Lower contributions from China and South Korea offset gains elsewhere. Singapore, Japan, and Hong Kong SAR contributed more revenue this quarter. But China and South Korea dragged down the total.
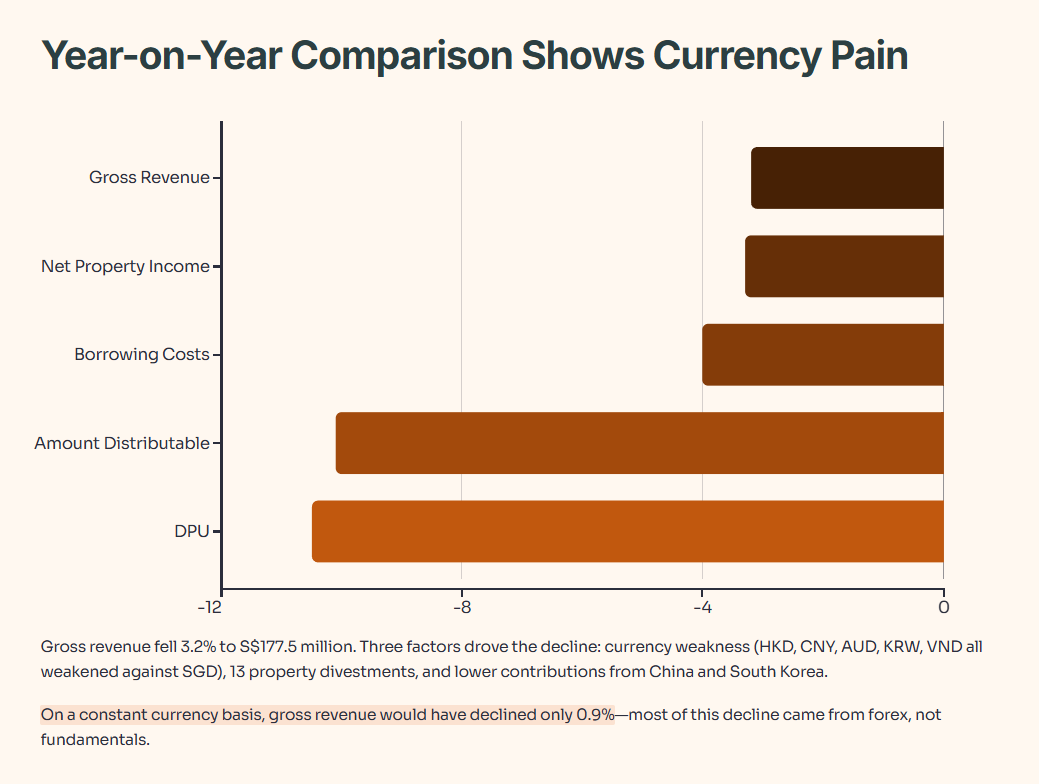
On a constant currency basis, gross revenue would have declined only 0.9%, and NPI would have fallen 1.0%. That tells you most of this decline came from forex, not fundamentals.
Property expenses decreased 2.2% to S$24.2 million. That’s good. Lower expenses mean higher profit margins. The decline came from divestments and currency effects, partly offset by the newly completed Mapletree Joo Koon Logistics Hub.
Borrowing costs fell 4.0% to S$38.2 million. Three factors drove this:
Lower base rates on unhedged SGD and HKD borrowings helped. Singapore’s SORA and Hong Kong’s HIBOR both declined in recent months. Since MLT has 16% of debt unhedged, lower floating rates directly reduce interest payments.
Interest savings from paying down loans with divestment proceeds added up. When you sell properties and use cash to reduce debt, you stop paying interest on that debt. That’s cash flow straight to unitholders.
But replacement hedges at higher costs and rising JPY loan rates partially offset these gains. MLT’s weighted average interest rate dipped from 2.7% to 2.6% per annum.
Amount distributable to unitholders dropped 9.6% to S$92.5 million. Last year’s 2Q included S$6.1 million in divestment gains. This quarter had zero divestment gains. Remove that one-time boost, and the adjusted decline was 3.9%. Still painful, but less dramatic.
DPU from operations fell 4.8% to 1.815 cents. That’s the number to watch. It strips out divestment gains and shows you the underlying business performance. A 4.8% decline hurts, but it’s manageable if the trend stabilizes.
Slide 3: Half-Year Performance - Consistency in the Decline
1H FY25/26 vs 1H FY24/25 Financial Performance
Let’s zoom out to the full half-year picture.
What Changed Over Six Months
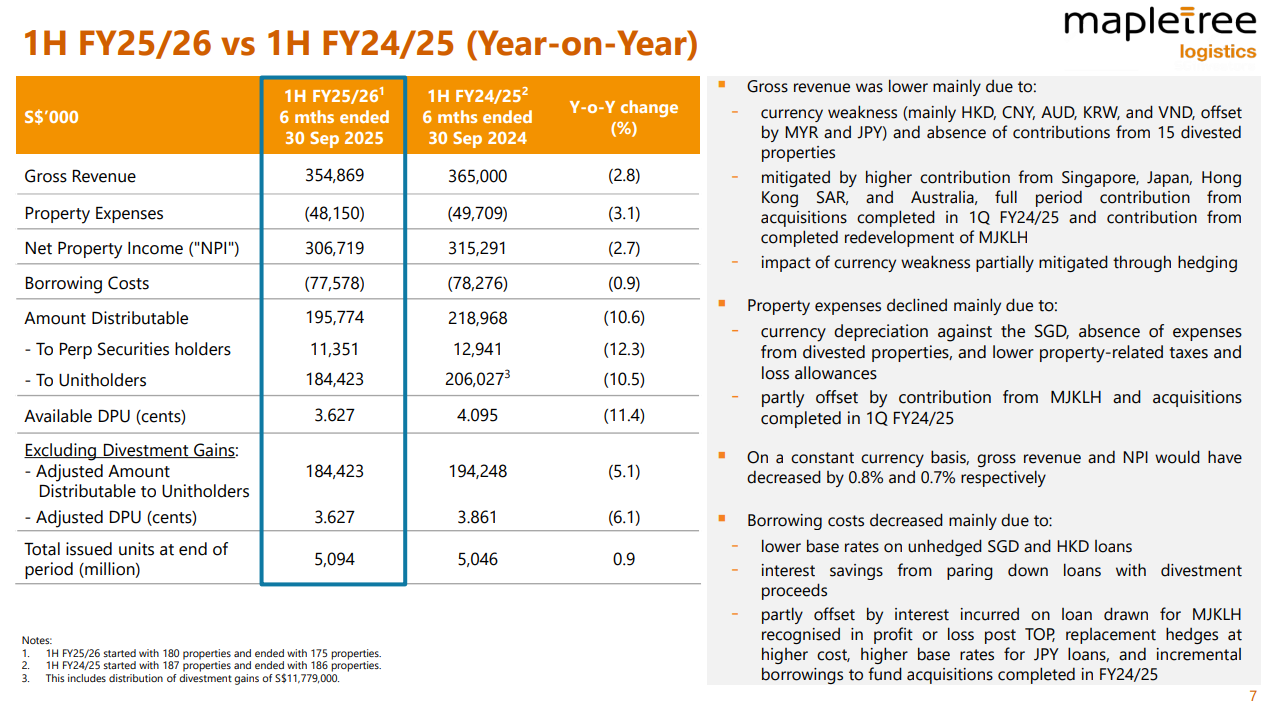
The half-year numbers mirror the quarterly trends. Gross revenue declined 2.8% to S$354.9 million. Currency effects dominated again. HKD, CNY, AUD, KRW, and VND all weakened against SGD, offset partly by MYR and JPY strength.
Fifteen divested properties removed revenue streams over the six-month period. But higher contributions from Singapore, Japan, Hong Kong SAR, and Australia helped. Full-period contributions from acquisitions completed in 1Q FY24/25 and the completed MJKLH redevelopment also added revenue.
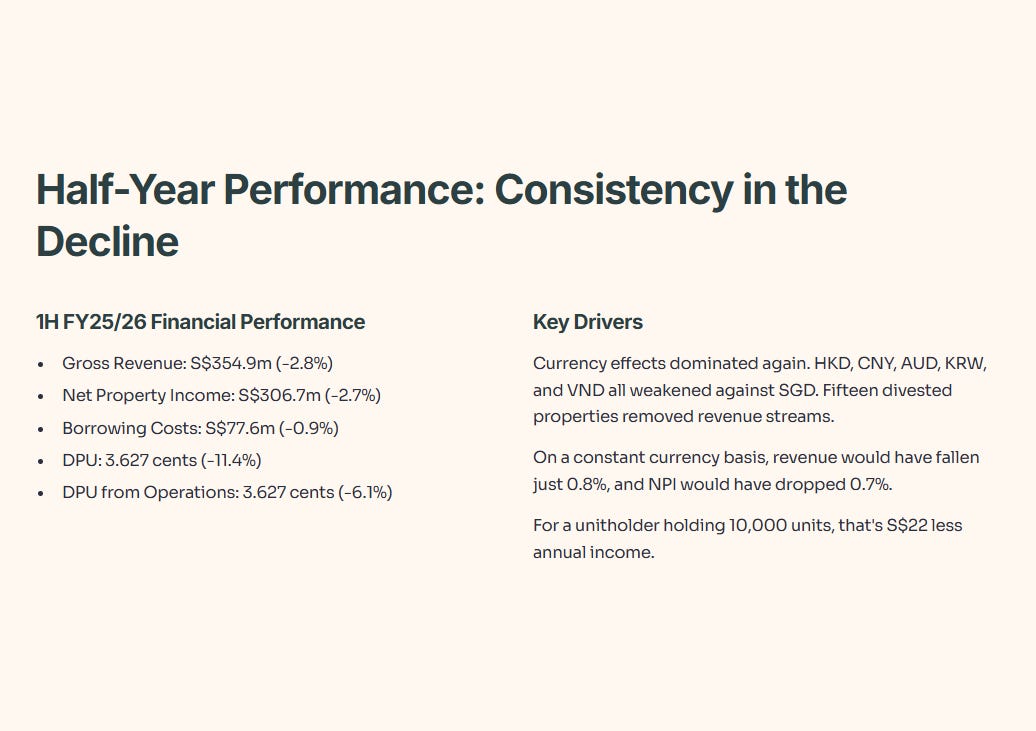
On a constant currency basis, revenue would have fallen just 0.8%, and NPI would have dropped 0.7%. Again, forex drives most of the reported decline.
Property expenses declined 3.1% to S$48.2 million. Currency depreciation against SGD, absence of expenses from divested properties, and lower property-related taxes all helped. MJKLH and recent acquisitions added some expenses.
Borrowing costs fell 0.9% to S$77.6 million. Lower unhedged SGD and HKD base rates plus interest savings from debt repayment helped. But MJKLH’s new loans, replacement hedges at higher costs, and rising JPY rates partially offset the gains.
DPU from operations dropped 6.1% to 3.627 cents for the half-year. That’s about S$0.22 decline per year if the trend continues. For a unitholder holding 10,000 units, that’s S$22 less annual income. Not catastrophic, but not great either.
Slide 4: Quarter-on-Quarter Performance - Stability Emerges
2Q FY25/26 vs 1Q FY25/26 Financial Performance
The sequential quarter comparison shows more stability.
Signs of Stabilization
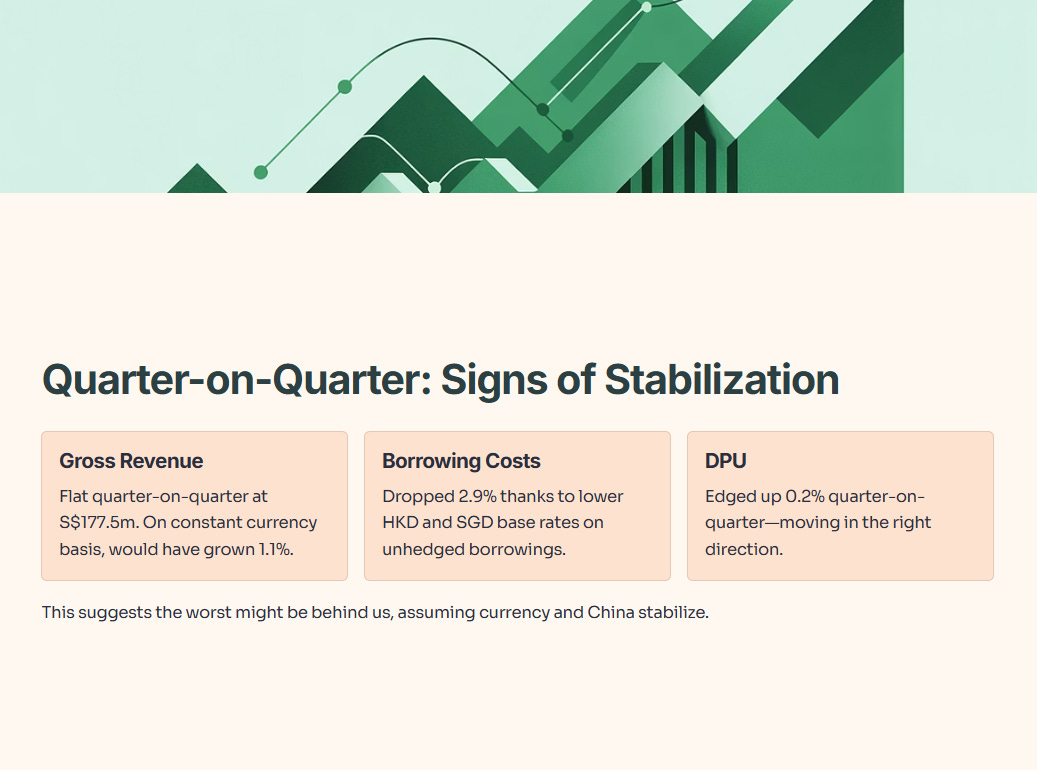
Gross revenue stayed flat quarter-on-quarter. MJKLH’s full contribution and higher Singapore revenue offset JPY and HKD depreciation and five more divestments. On a constant currency basis, revenue would have grown 1.1% and NPI would have increased 1.0%.
Property expenses ticked up 0.7% due to MJKLH and higher maintenance costs. But absent divested properties and loss allowance reversals kept the increase modest.
Borrowing costs dropped 2.9% thanks to lower HKD and SGD base rates on unhedged borrowings. MJKLH’s interest costs and replacement hedges at higher costs offset some of the savings.
DPU edged up 0.2% quarter-on-quarter. Not much, but at least it’s moving in the right direction. This suggests the worst might be behind us, assuming currency and China stabilize.
Slide 5: Balance Sheet and Capital Management - Fortress-Like Discipline
Healthy Balance Sheet and Prudent Capital Management
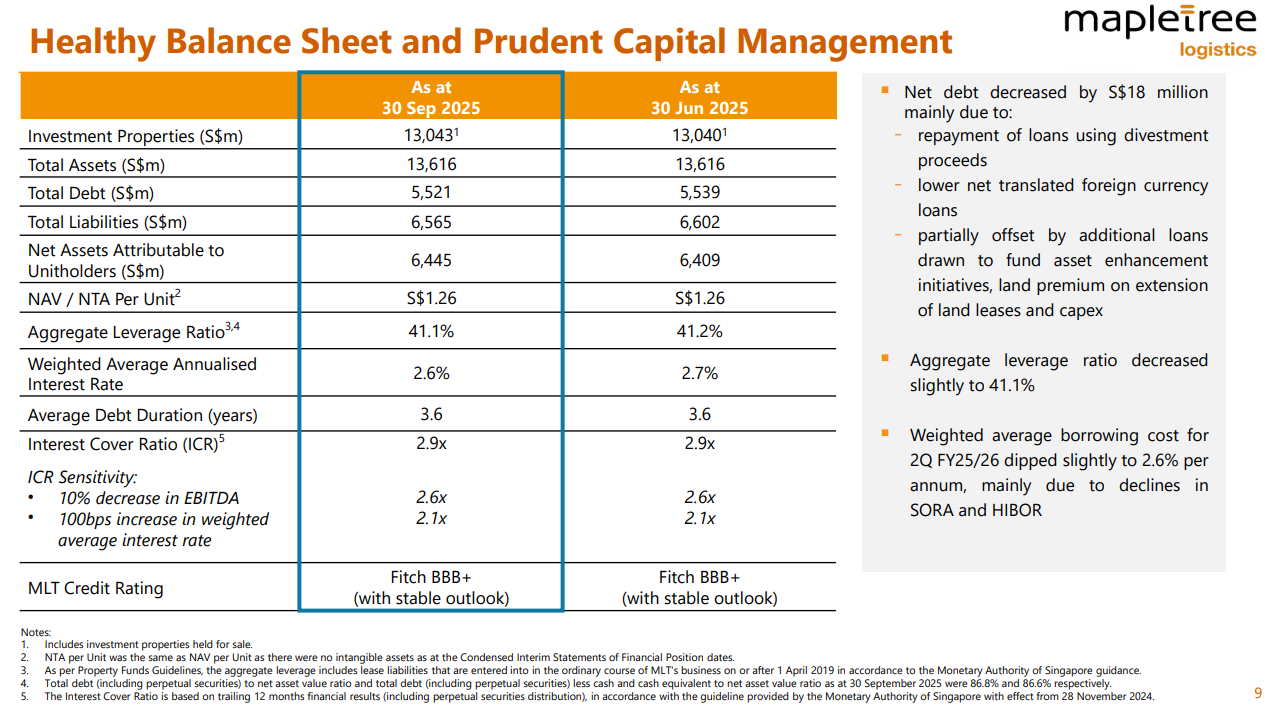
MLT’s balance sheet remains rock-solid. As of 30 September 2025:
What This Means
Net debt decreased by S$18 million quarter-on-quarter. MLT used divestment proceeds to repay loans, reducing debt load. Lower net translated foreign currency loans also helped. But new loans for asset enhancements, land lease extensions, and capex partially offset the decline.
Aggregate leverage ratio dipped from 41.2% to 41.1%. That’s well below the regulatory limit of 50%. MLT has plenty of borrowing headroom if acquisition opportunities emerge.
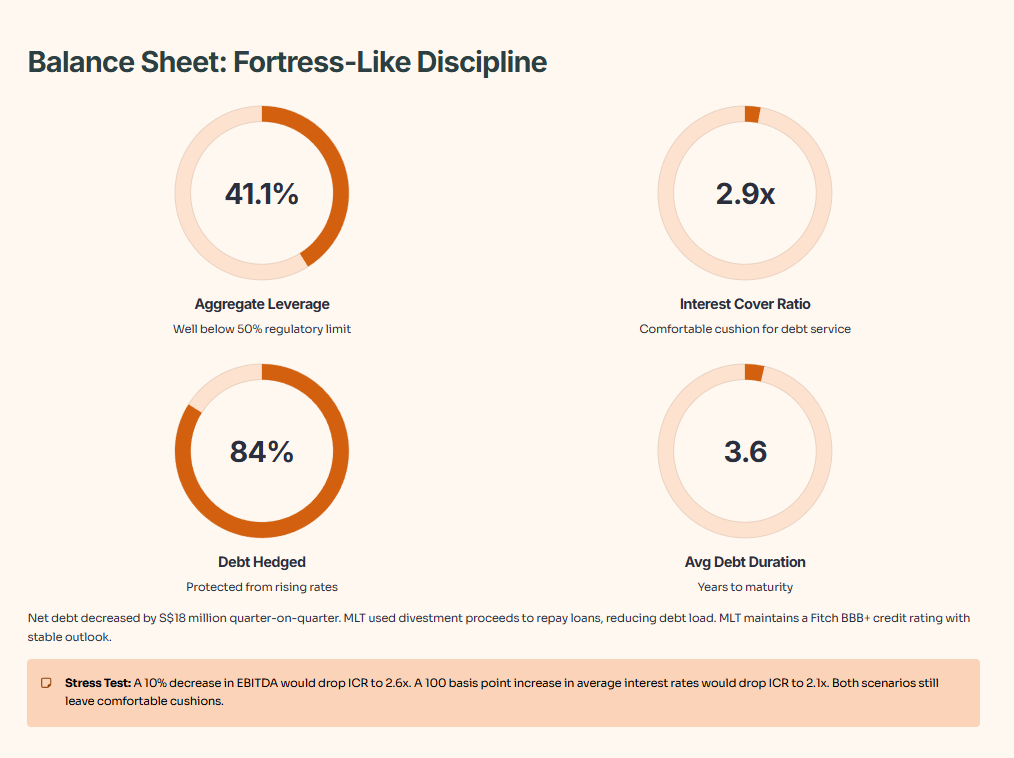
The Interest Cover Ratio stayed at 2.9x. That means MLT’s earnings before interest, tax, depreciation, and amortization cover its interest expenses 2.9 times over. A 10% decrease in EBITDA would drop ICR to 2.6x. A 100 basis point increase in average interest rates would drop ICR to 2.1x. Both scenarios still leave comfortable cushions.
MLT maintains a Fitch BBB+ credit rating with stable outlook. That reflects strong financial discipline and low default risk.
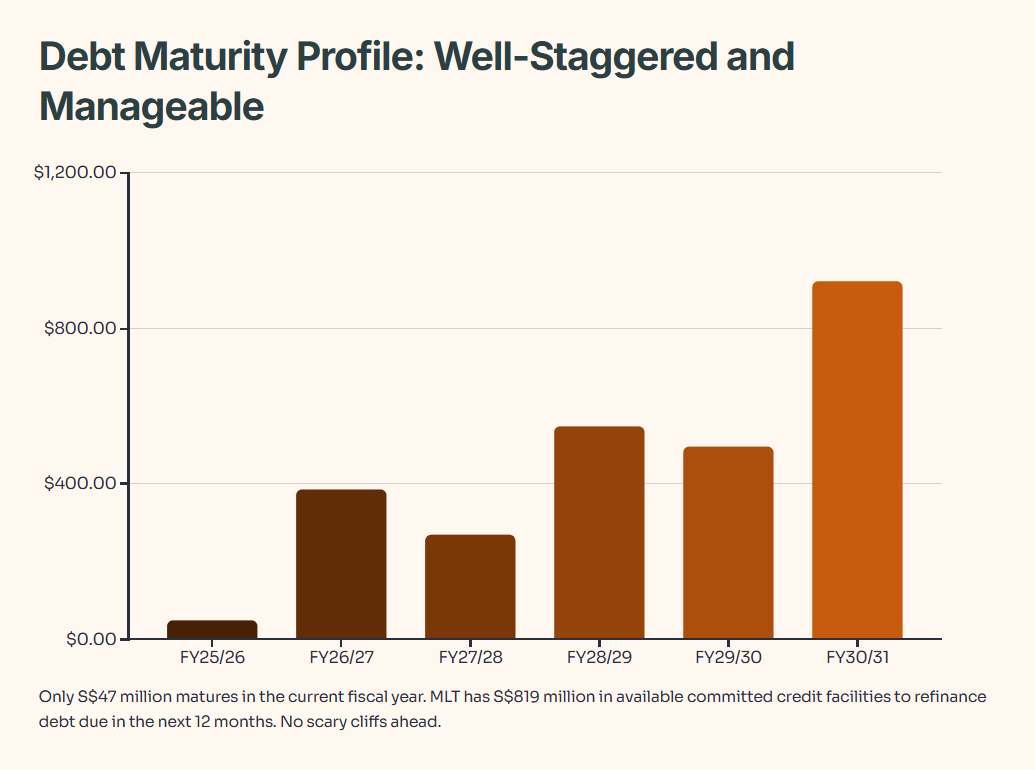
Slide 6: Debt Maturity Profile - Well-Staggered and Manageable
Well-Staggered Debt Maturity Profile
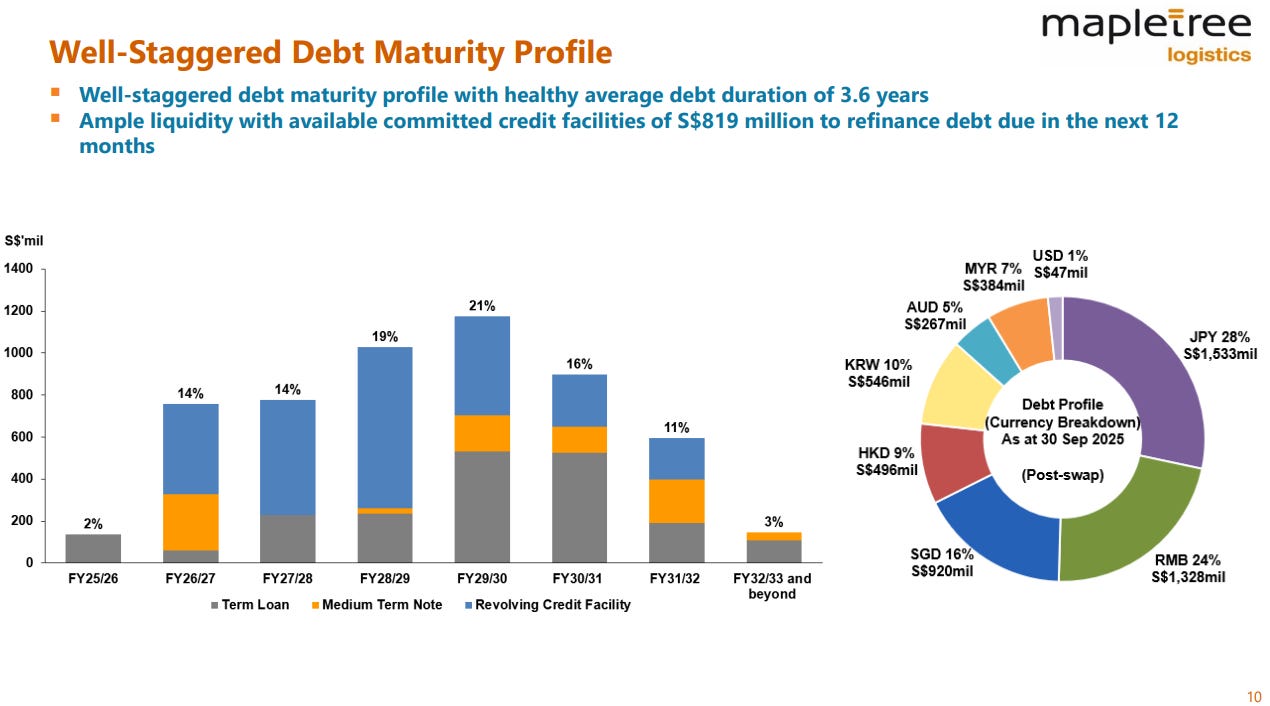
MLT’s debt maturity profile shows no scary cliffs ahead. As of 30 September 2025:
Breaking Down the Debt Structure
Only S$47 million matures in the current fiscal year. That’s pocket change for a REIT with S$13 billion in assets. MLT has S$819 million in available committed credit facilities to refinance debt due in the next 12 months.
The largest maturity comes in FY28/29 at S$546 million. But that’s still three years away. Plenty of time to refinance at favorable rates, especially with global interest rates trending downward.
Average debt duration sits at 3.6 years. That’s healthy. Too short and you face constant refinancing risk. Too long and you lock in high rates if markets drop. MLT strikes a good balance.
By currency post-swap: SGD 16%, JPY 28%, RMB 24%, HKD 9%, KRW 10%, AUD 5%, MYR 7%, USD 1%. This diversification matches MLT’s revenue streams and provides natural hedging.
Slide 7: Interest Rate and Forex Risk Management - Multi-Year Hedging Strategy
Proactive Interest Rate and Forex Risk Management
MLT’s hedging strategy reduces volatility in unpredictable markets.
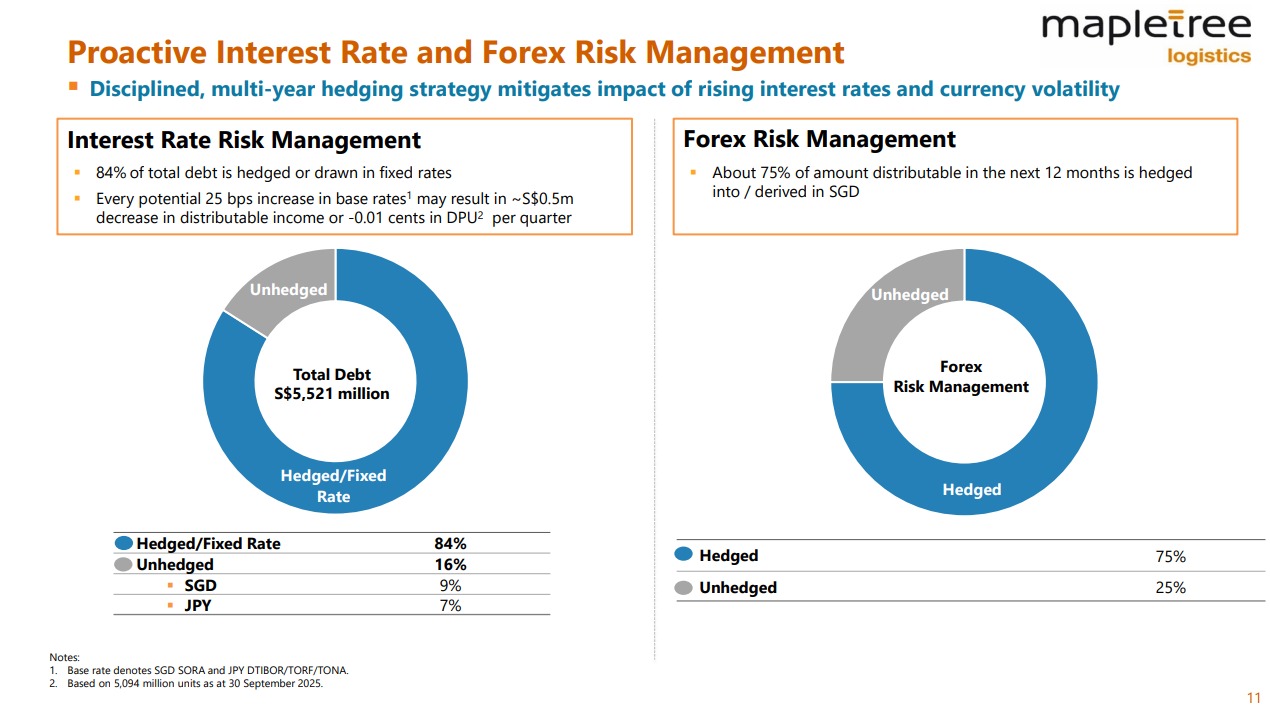
Interest Rate Management
84% of total debt is hedged or drawn in fixed rates. That protects MLT from rising rates. Every potential 25 basis point increase in base rates may decrease distributable income by approximately S$0.5 million or 0.01 cents in DPU per quarter. Based on 5,094 million units outstanding, that’s minimal impact.
The remaining 16% unhedged debt benefits from falling rates. Singapore’s SORA has declined in recent months. Lower floating rates directly reduce interest costs.
Forex Management
About 75% of distributable income in the next 12 months is hedged into or derived in SGD. That shields MLT from further currency weakness. The remaining 25% provides upside if currencies strengthen.
This disciplined multi-year hedging strategy mitigates the impact of rising interest rates and currency volatility. It’s one of MLT’s competitive advantages versus smaller REITs with less sophisticated treasury management.
Slide 8: Distribution Details - When You Get Paid
2Q FY25/26 Distribution
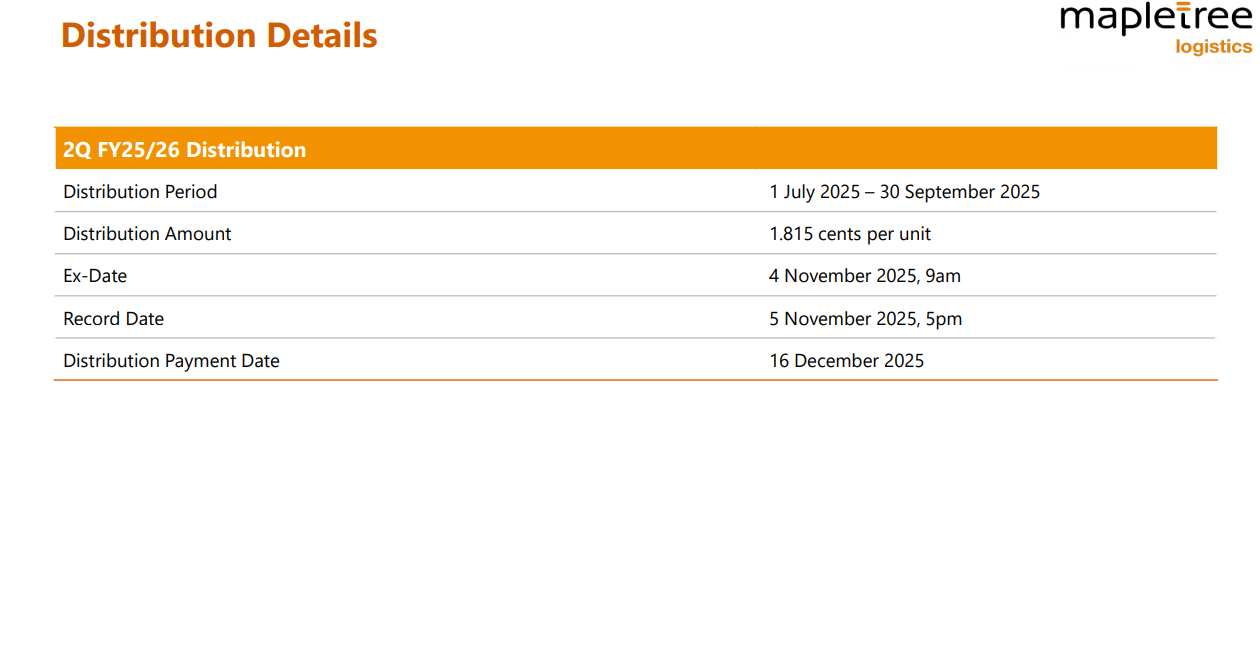
DetailInformationDistribution Period1 July 2025 – 30 September 2025Distribution Amount1.815 cents per unitEx-Date4 November 2025, 9amRecord Date5 November 2025, 5pmDistribution Payment Date16 December 2025
What to Expect
If you hold MLT units on 5 November 2025 at 5pm, you’ll receive 1.815 cents per unit on 16 December 2025. For a 10,000-unit holding, that’s S$181.50 before tax. Annualized, MLT’s trailing distribution yield sits around 5.6% based on the current unit price of approximately S$1.30.
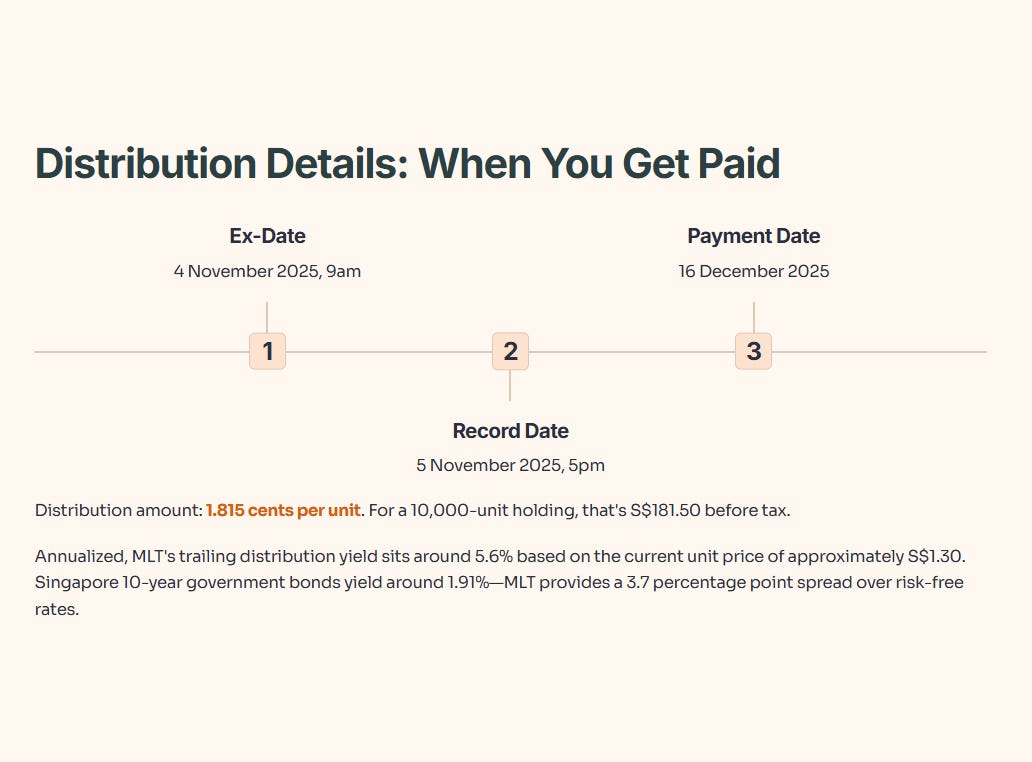
That’s attractive in a low-rate environment. Singapore 10-year government bonds yield around 1.91%. Corporate investment-grade bonds yield 3-4%. MLT’s 5.6% yield provides a decent spread over risk-free rates, compensating investors for real estate and operational risks.
Slide 9: Geographical Diversification - Portfolio Spread Reduces Risk
Geographically Diversified Portfolio Enhances Stability
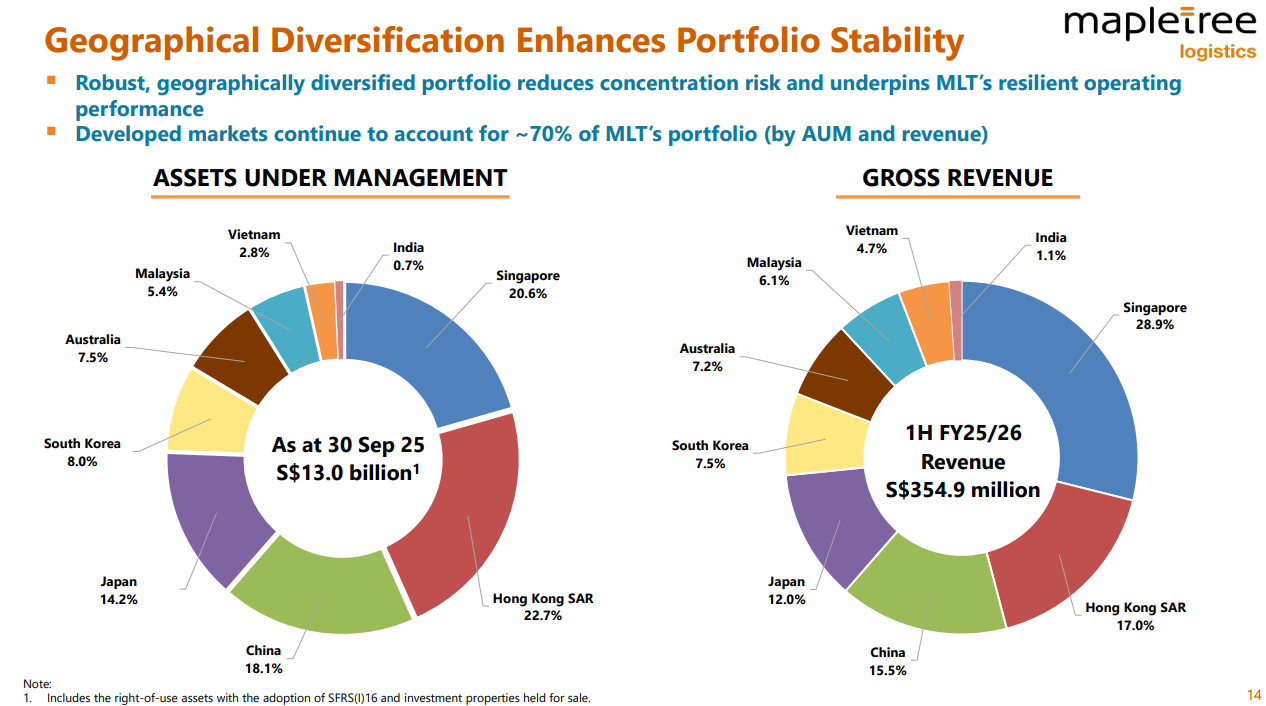
MLT’s geographic diversification reduces concentration risk.
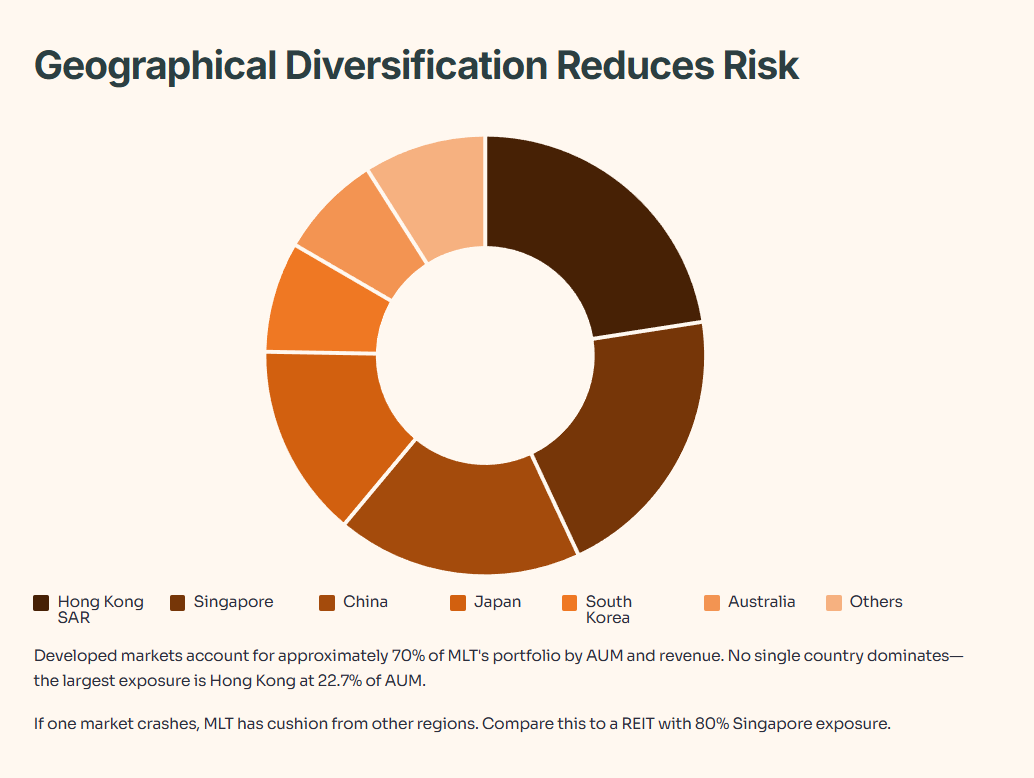
What This Tells You
Developed markets account for approximately 70% of MLT’s portfolio by AUM and revenue. That provides stability. Singapore, Hong Kong, Japan, and Australia have mature logistics markets with established tenant bases.
Emerging markets comprise the remaining 30%. China, South Korea, Vietnam, Malaysia, and India offer higher growth potential but come with more volatility. China’s current struggles illustrate this trade-off.
No single country dominates. The largest exposure is Hong Kong at 22.7% of AUM. If one market crashes, MLT has cushion from other regions. Compare this to a REIT with 80% Singapore exposure. If Singapore logistics softens, that REIT gets hammered. MLT spreads risk.
Slide 10: Tenant Trade Sectors and Operational Performance - Consumer-Focused Stability
Diversified Tenant Trade Sectors
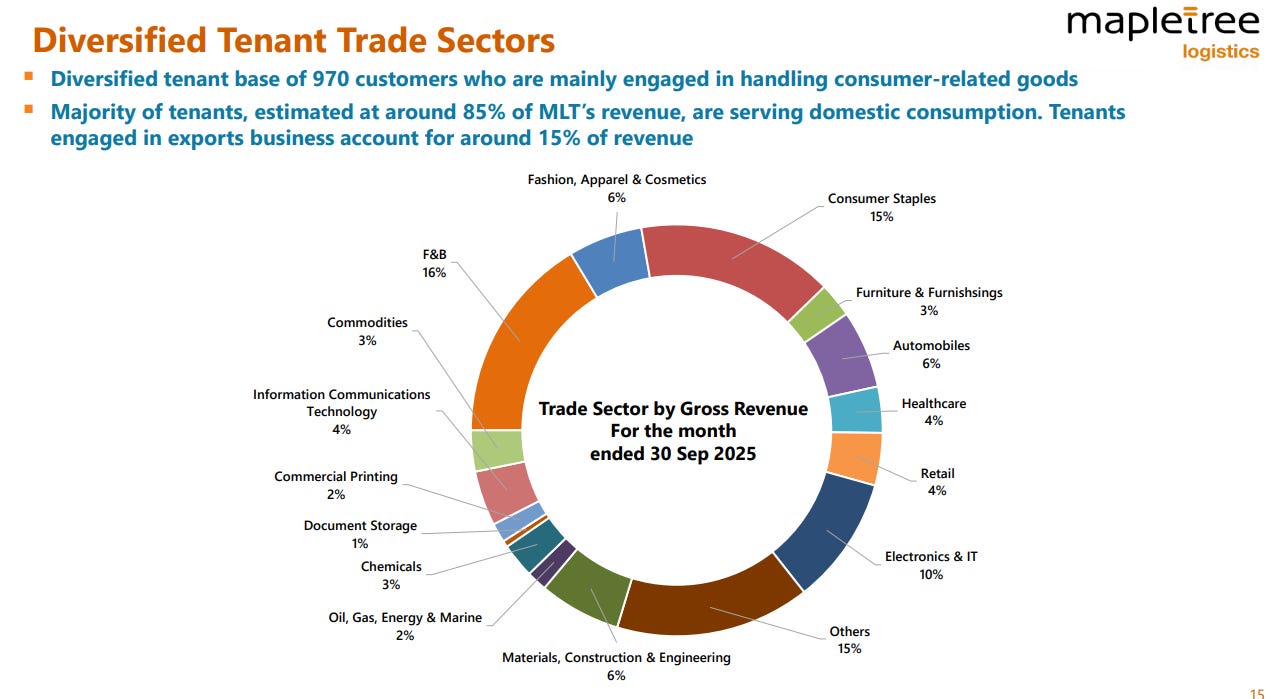
MLT’s 970 customers span multiple sectors:
Consumer-Related Exposure Dominates
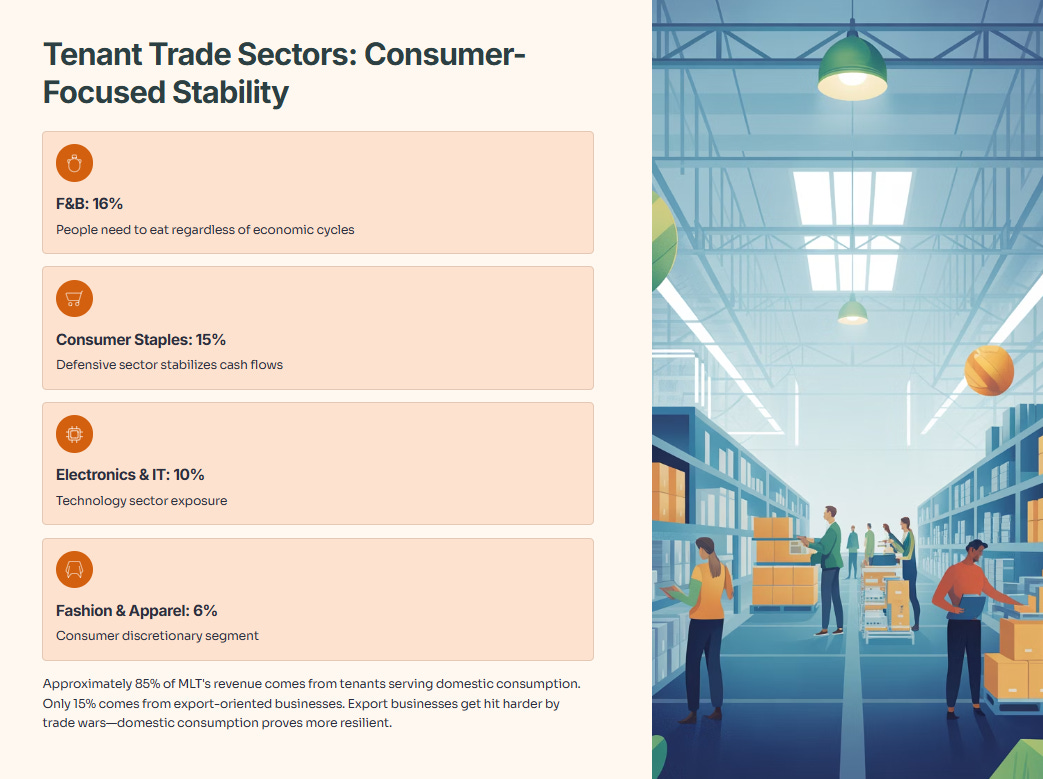
Approximately 85% of MLT’s revenue comes from tenants serving domestic consumption. Only 15% comes from export-oriented businesses. That’s crucial. Export businesses get hit harder by trade wars and tariffs. Domestic consumption proves more resilient.
Food and beverage tenants contribute 16% of revenue. People need to eat regardless of economic cycles. Consumer staples add another 15%. These defensive sectors stabilize cash flows during downturns.
Resilient Operational Performance
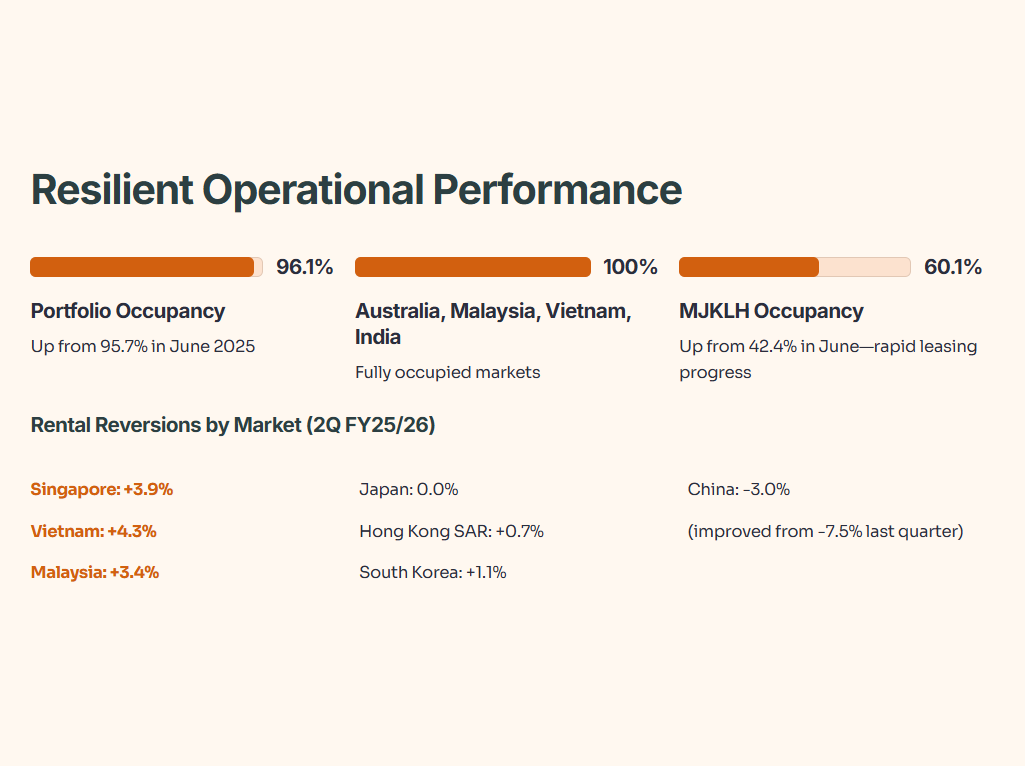
Portfolio occupancy improved to 96.1% in September 2025, up from 95.7% in June 2025.
Singapore, China, South Korea, and Malaysia all saw occupancy improvements. Japan’s occupancy dipped from 99.4% to 97.5% due to transitional downtime at Kuwana Centre. Management is negotiating with prospective tenants to backfill the vacancy.
MJKLH recorded 60.1% occupancy as at 30 September 2025, up from 42.4% in June 2025. That’s rapid leasing progress for a newly completed redevelopment project. As MJKLH reaches stabilized occupancy, it should contribute more meaningful revenue.
Rental Reversions by Market
Most markets posted positive rental reversions. Singapore achieved +3.9% despite moderating from last quarter’s +5.2%. Vietnam delivered +4.3%. Malaysia improved from +2.9% to +3.4%.
China remains the exception. But -3.0% beats last quarter’s -7.5%. That’s substantial improvement. The trend from worse declines to smaller declines suggests the China logistics market is stabilizing.
Active Portfolio Rejuvenation: Selling Old, Buying New
MLT completed three divestments in 2Q FY25/26 and a fourth post-quarter-end:
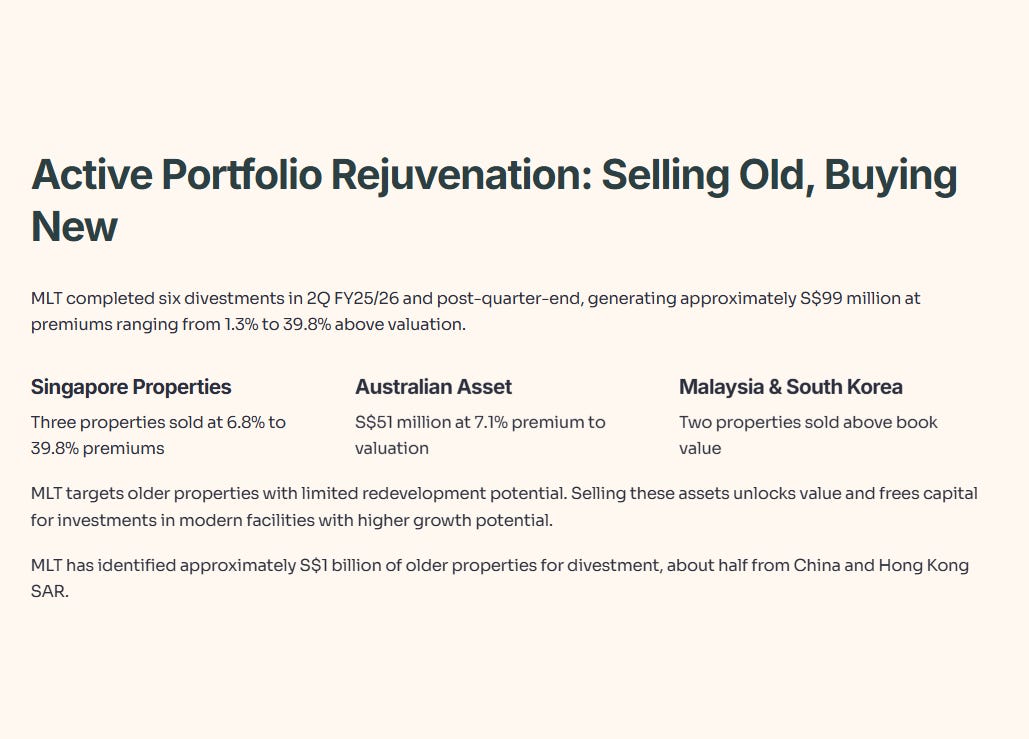
Strategy and Rationale
MLT targets older properties with limited redevelopment potential. Selling these assets unlocks value and frees capital for investments in modern facilities with higher growth potential.
The Australian divestment alone generated S$51 million at a 7.1% premium to valuation. The Singapore and Malaysia properties sold at premiums ranging from 6.8% to 39.8%. These above-valuation sales boost unitholder returns.
MLT has identified approximately S$1 billion of older properties for divestment, about half from China and Hong Kong SAR. Management targets S$100-150 million in divestments for FY25/26. With S$58 million completed year-to-date, MLT is on track.
Sustainability: Green Buildings and Solar Power
MLT continues advancing its green agenda. As of 30 September 2025:
Self-funded solar generating capacity increased 19% year-on-year to 56.4 MWp. Total solar capacity rose 52% to 108.1 MWp. MLT met its FY25/26 target and is on track toward its 2030 target of 100 MWp of self-funded solar capacity.
Green certified space reached 69% of MLT’s portfolio by gross floor area. That’s up from 56% last year and exceeds the FY25/26 target. MLT aims for over 80% green certification by 2030. Another 15 properties attained green certifications across China, South Korea, and Australia in this period.
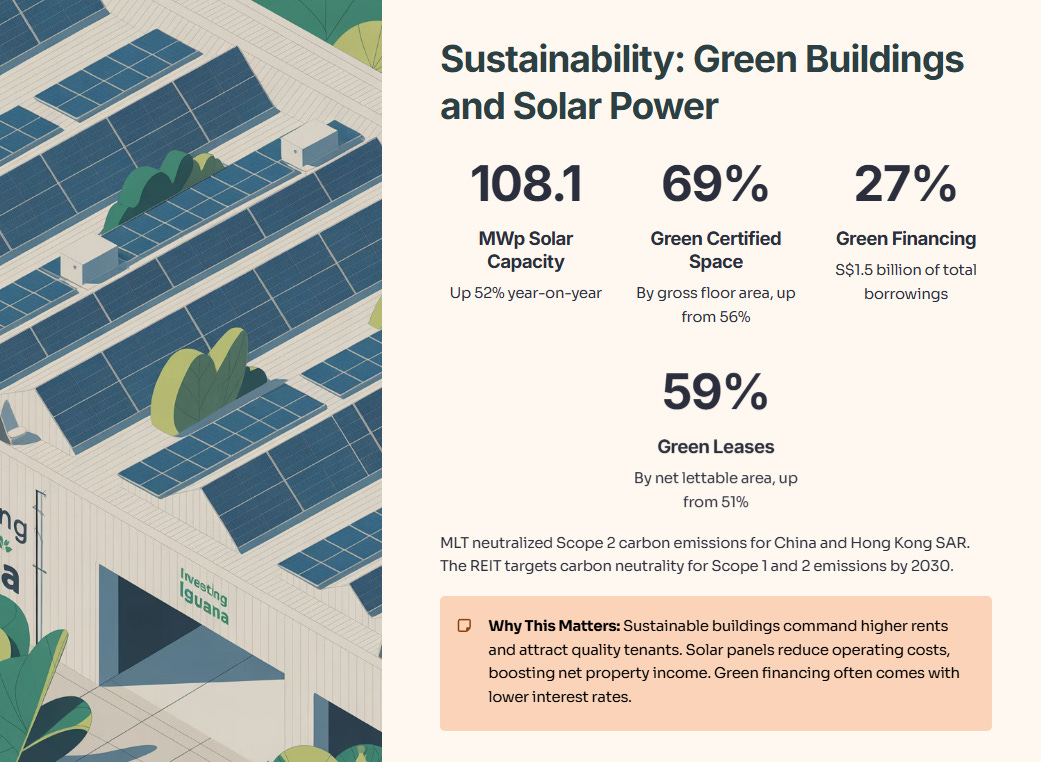
MLT neutralized Scope 2 carbon emissions for China and Hong Kong SAR as a combined market. The REIT targets carbon neutrality for Scope 1 and 2 emissions by 2030, aligned with Mapletree Group’s net zero emissions goal by 2050.
Green and sustainable financing increased to S$1.5 billion, about 27% of total borrowings. MLT secured S$300 million of new green financing year-to-date.
Green leases now account for 59% of portfolio by net lettable area, up from 51% a year ago.
Why This Matters
Sustainable buildings command higher rents and attract quality tenants. Companies with ESG mandates prefer green-certified warehouses. Solar panels reduce operating costs, boosting net property income. Green financing often comes with lower interest rates than conventional loans.
MLT’s sustainability leadership positions it well for the transition to a lower-carbon economy. This isn’t greenwashing. It’s smart business.
Outlook: What Management Sees Ahead
Management’s outlook statement provides crucial context:
The world economy has proven more resilient than expected, according to the International Monetary Fund. But renewed US-China trade tensions continue clouding the outlook, keeping business and consumer sentiment cautious.
Overall leasing demand for MLT’s logistics facilities has held steady to date, supporting a high 96.1% portfolio occupancy rate and resilient operational performance. China’s market appears to be stabilizing, with negative rent reversions continuing to moderate.
