



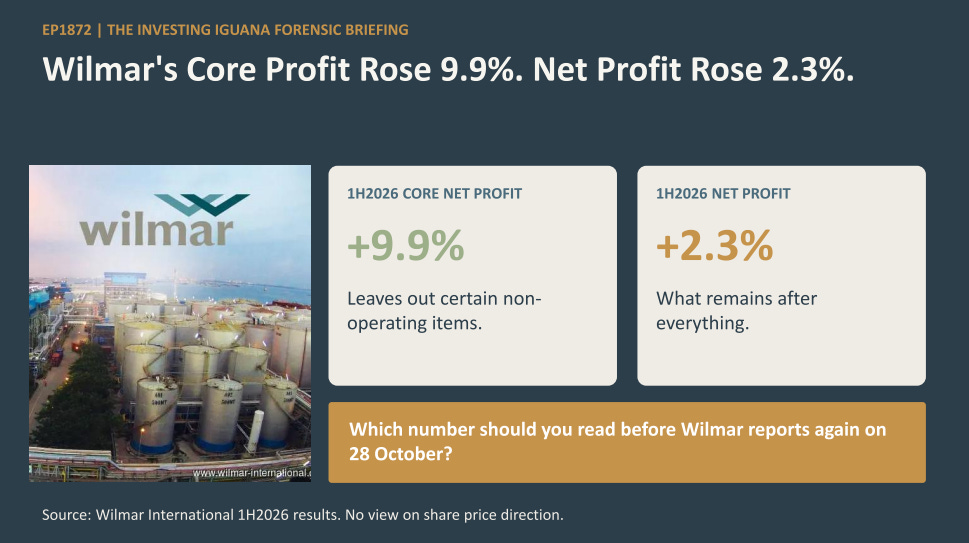
Wilmar’s Core Profit Rose 9.9%. Its Net Profit Rose 2.3%. Which Number Should You Read Before 28 October?
The same six months, two profit numbers, and a debt and interest bill that decide how far the dividend can stretch.
Wilmar’s own results show two profit numbers for the same six months. One grew by almost 10%. The other grew by about 2%. Before the company reports again on 28 October, it helps to know which one you have been reading.
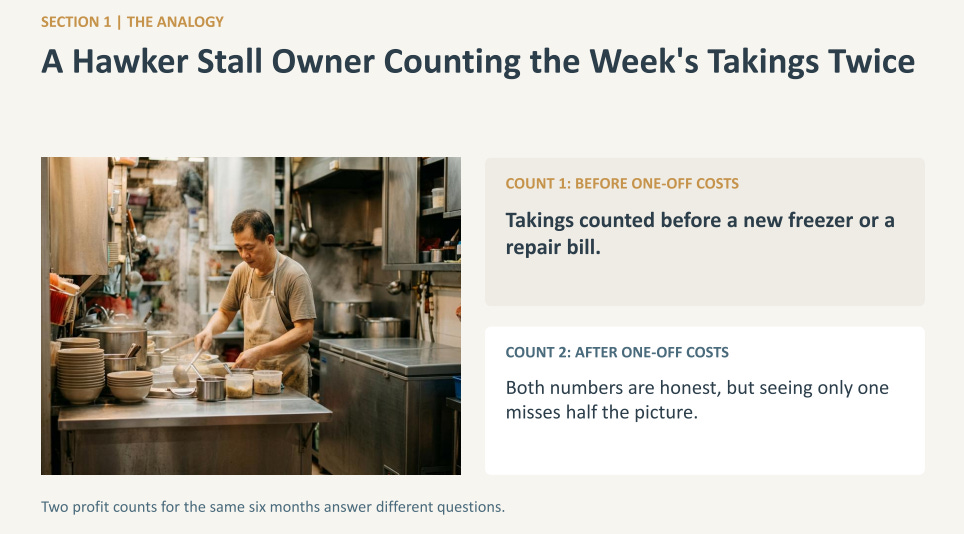
Think of a hawker stall owner who counts the week’s takings twice. The first count is before the one-off costs, such as a new freezer or a repair bill. The second count is after them. Both numbers are honest, but they answer different questions, and a shareholder who only ever sees one of them is missing half the picture.
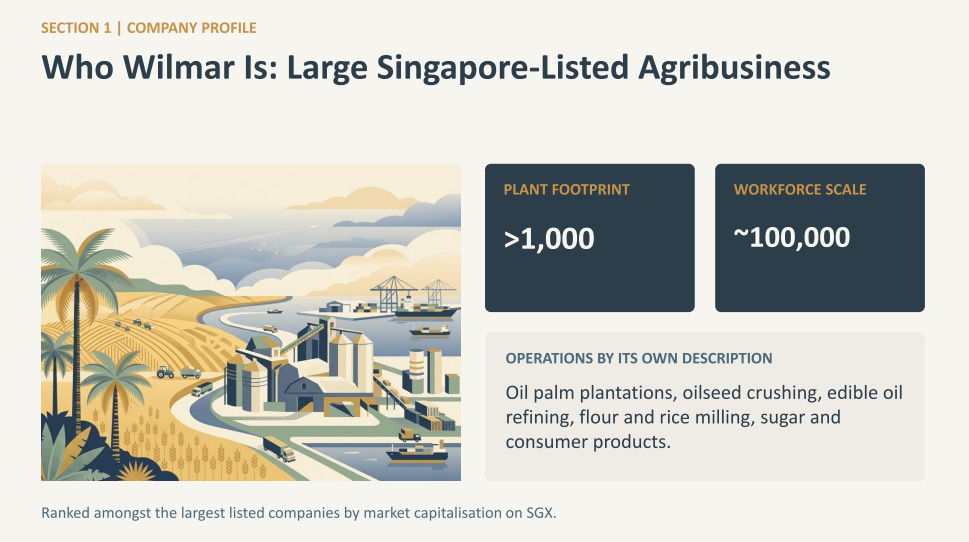
Wilmar is a large Singapore-listed agribusiness. By its own description it runs oil palm plantations, oilseed crushing, edible oil refining, flour and rice milling, sugar and consumer products, and it says it operates over 1,000 manufacturing plants with about 100,000 people. It describes itself as ranked amongst the largest listed companies by market capitalisation on the Singapore Exchange.
What This Piece Does
It shows the two profit numbers in Wilmar’s first-half 2026 results, and what separates them.
It shows where the growth came from, and where it did not.
It shows how the debt, the interest bill and the dividend fit together, how Wilmar tests against my thresholds, and what to compare when the next report arrives on 28 October.
No view on share price direction. Nothing here is a recommendation.

The Two Numbers
Iggy’s Insights
One Strong Quarter Carried the Half
Where the Growth Came From
The Part That Went the Other Way
Where Wilmar Sits on My Framework
Gearing Has Two Answers
Iggy’s Insights
Most of the Debt Is Short-Term
The Dividend Side
Where the Tests Land
Iggy’s Forensic Read
What I Would Compare on 28 October
The Two Numbers
For the six months to 30 June 2026, Wilmar reported core net profit of USD 641.5 million, up 9.9% from USD 583.7 million a year earlier. Over the same period, net profit was USD 608.9 million, up only 2.3% from USD 594.9 million.
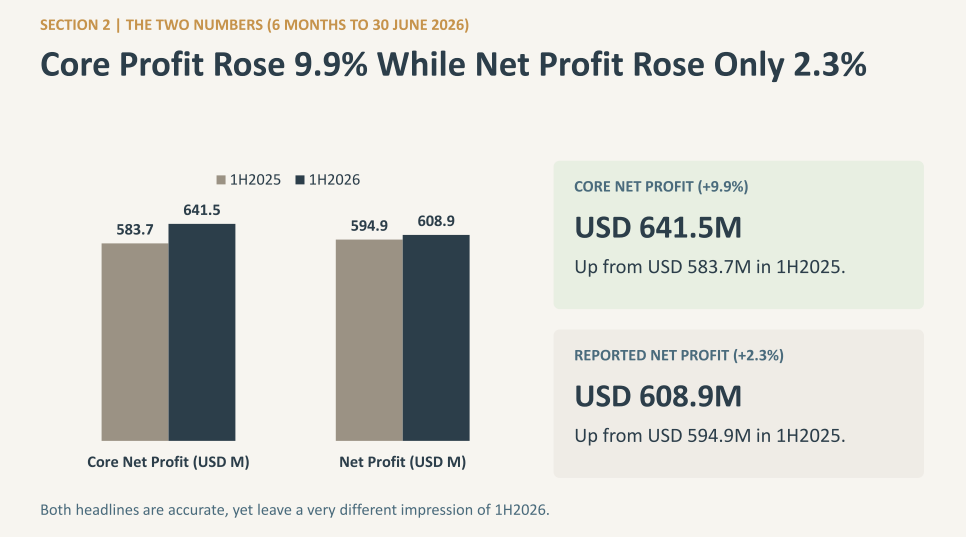
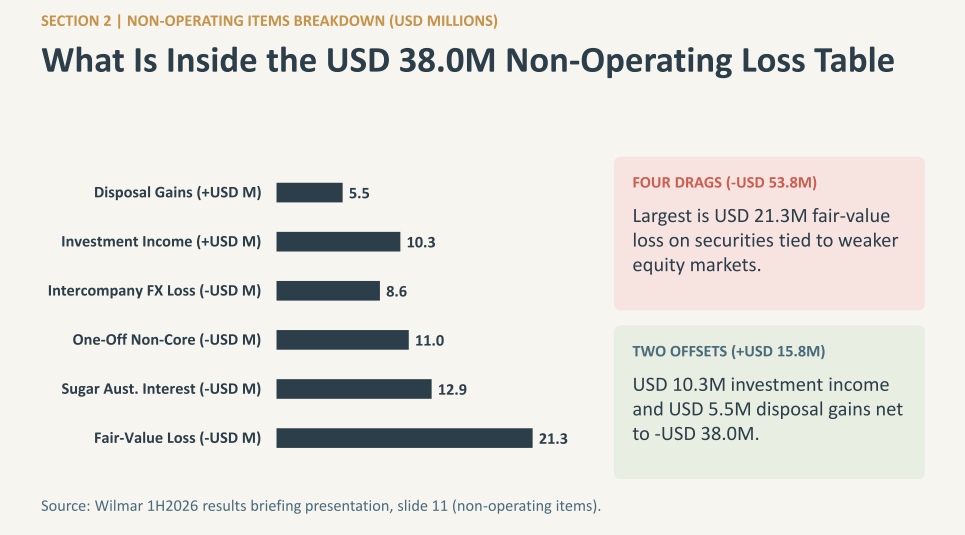
Core profit is the company’s own measure that leaves out certain items. Net profit is what remains after everything. The gap between them in this half is USD 32.6 million, which is my subtraction of the two reported figures. Wilmar’s results presentation lists non-operating items totalling a loss of USD 38.0 million. The largest is a USD 21.3 million fair-value loss on investment securities, which the company ties to weaker equity markets. The list also includes a foreign exchange loss of USD 8.6 million on intercompany loans, USD 12.9 million of interest on the funding for the Sugar Australia acquisition, and USD 11.0 million of one-off non-core adjustments. Gains of USD 5.5 million on disposals and USD 10.3 million of investment income offset part of it. In the first half of 2025 the same table showed a gain of USD 12.8 million.
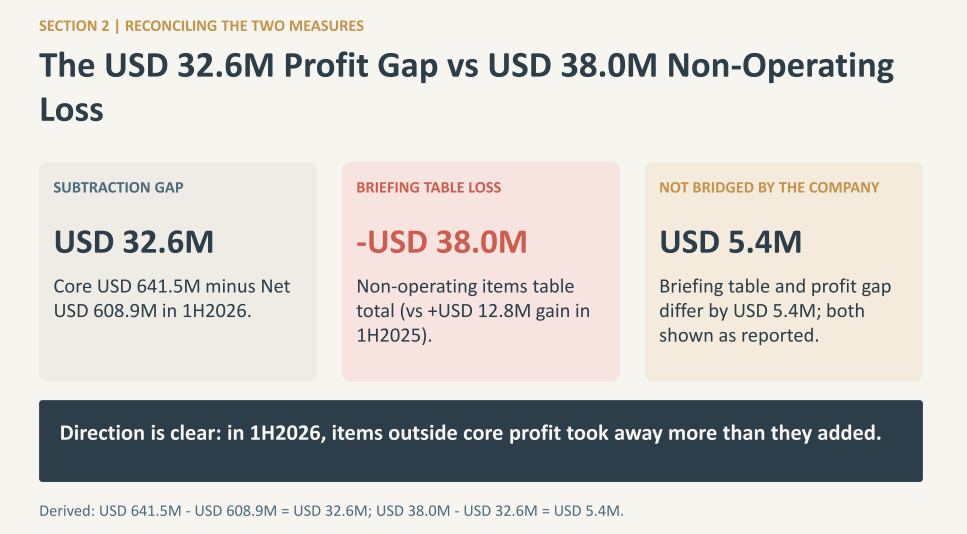
Notice that 32.6 and 38.0 are not the same number. They differ by USD 5.4 million, and the presentation does not set out the steps between its table and the core-to-net-profit gap, so I give both figures as reported. The direction is clear: in this half, the items outside core profit took away more than they added.
Why does this matter to an ordinary shareholder? Because a headline that says “core profit up 10%” and a headline that says “net profit up 2%” can both be accurate, and they leave a very different impression of the same business. If you are reading only one, you should know which one it is.
One Strong Quarter Carried the Half
The half-year growth is not spread evenly across the six months. The company reports that second-quarter core profit was USD 377.3 million, up 56.8% from USD 240.7 million a year earlier. It also describes the first quarter as softer.
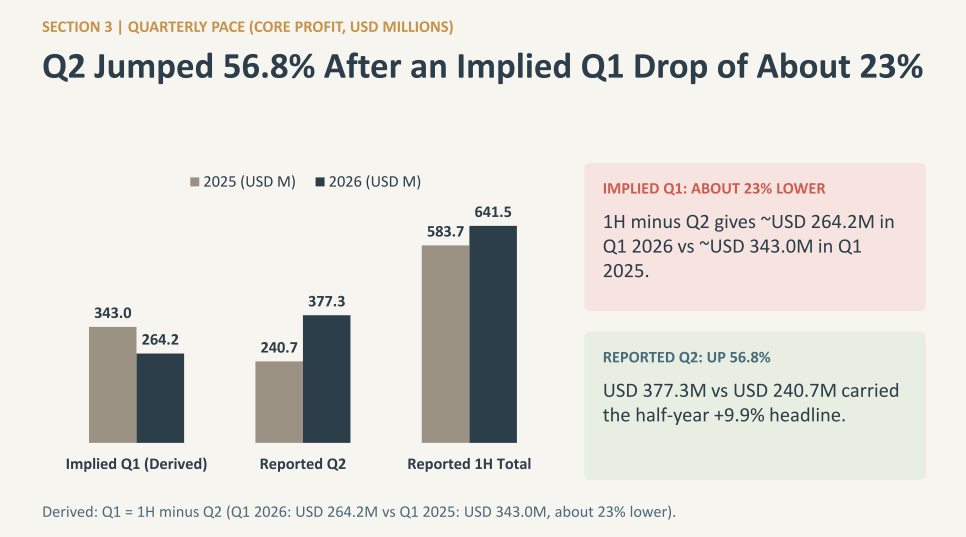
Take the half-year core profit of USD 641.5 million and subtract the second quarter, and the first quarter comes to about USD 264.2 million. Do the same for last year, and the first quarter of 2025 comes to about USD 343.0 million. By my calculation, that makes the first quarter of 2026 about 23% lower than a year earlier. These two quarterly figures are my own derivations from the company’s half-year and second-quarter numbers, not figures Wilmar published directly.
So the 9.9% for the half is a strong second quarter set against a weaker first one. A reader who sees only the half-year number would not know that. When the third-quarter summary arrives, the question is whether the stronger pace of the second quarter continued.
Where the Growth Came From
Revenue rose 17.2% to USD 38.56 billion. The company attributes most of that to consolidating AWL Agri Business since December 2025, with higher selling prices on most products adding to it.
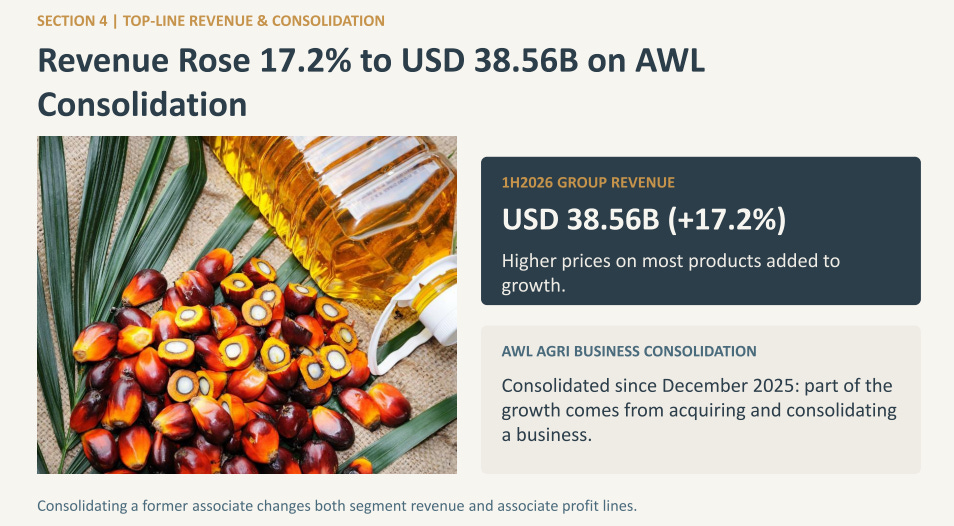
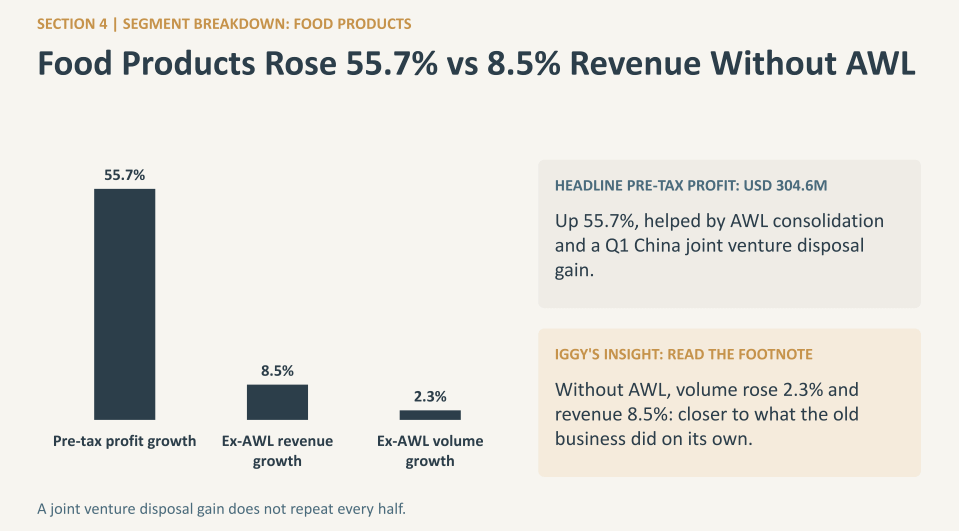
That consolidation matters when you read the segment numbers. Pre-tax profit in the Food Products segment rose 55.7% to USD 304.6 million. The company says the segment was helped by the AWL consolidation and by a gain on disposal of joint ventures in China in the first quarter. Stripping out the effect of AWL, the company says Food Products volume would have risen 2.3% and revenue 8.5%.
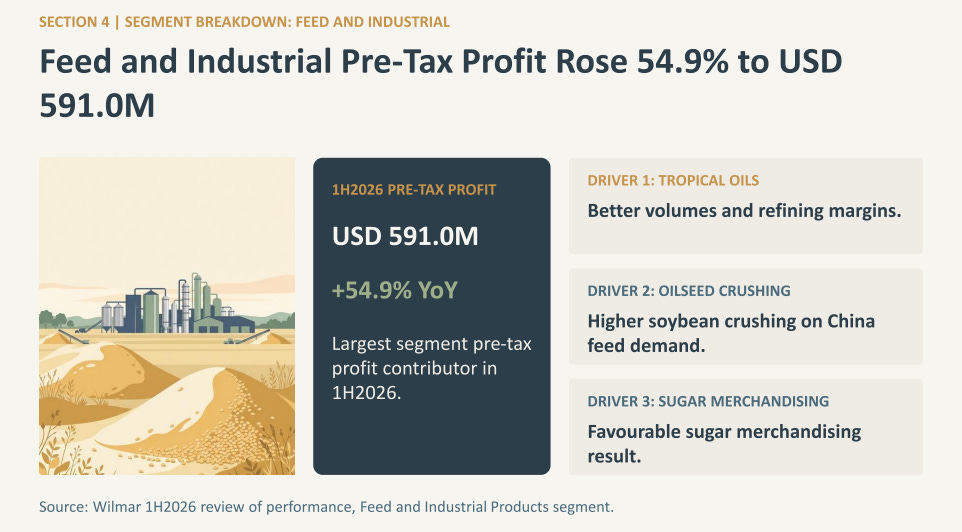
Pre-tax profit in Feed and Industrial Products rose 54.9% to USD 591.0 million. The company credits better volumes and refining margins in tropical oils, higher soybean crushing on feed demand in China, and a favourable result from sugar merchandising.
Two things follow from this. First, part of the growth is the result of buying and consolidating a business, not only of the existing business growing. Second, a gain on selling joint ventures is the kind of item that does not repeat every half. Neither point is a criticism. Both are the reason to read the segment lines and not only the headline.
🦖 Iggy’s Insights
When a company grows partly by consolidating a business it did not fully own before, the growth rate flatters the underlying business. Wilmar gives its own adjusted view for Food Products: volume up 2.3% and revenue up 8.5% without AWL. That is a healthy number, but it is a different number from 55.7%. Whenever a report shows you both, the smaller one is usually the closer to what the old business did on its own. Read the footnote before you read the headline.
The Part That Went the Other Way
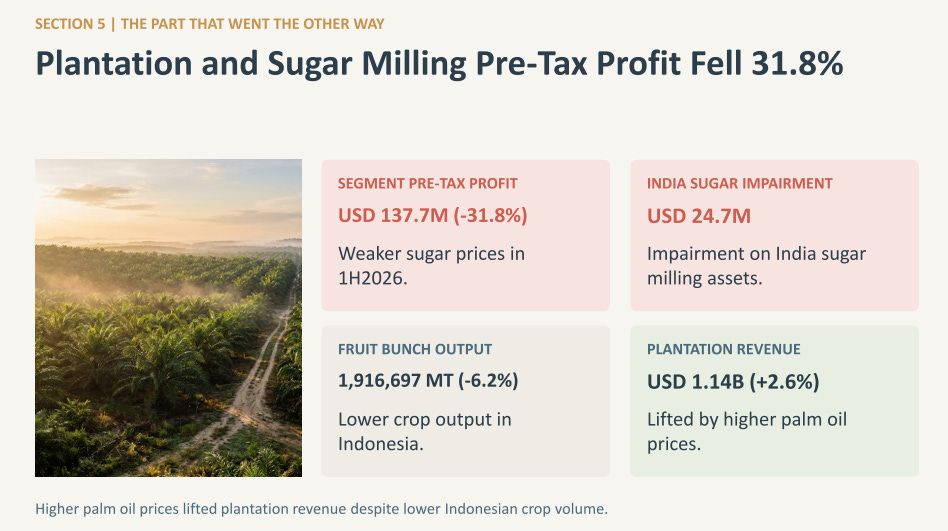
Not every line improved. Pre-tax profit in the Plantation and Sugar Milling segment fell 31.8% to USD 137.7 million. The company points to weaker sugar prices and a USD 24.7 million impairment on its sugar milling assets in India.
The palm plantation business also produced less. Fresh fruit bunch output fell 6.2% to 1,916,697 metric tonnes, which the company attributes to lower crop production in Indonesia. Revenue from oil palm plantations still rose 2.6% to USD 1.14 billion, because the company says palm oil prices were higher.
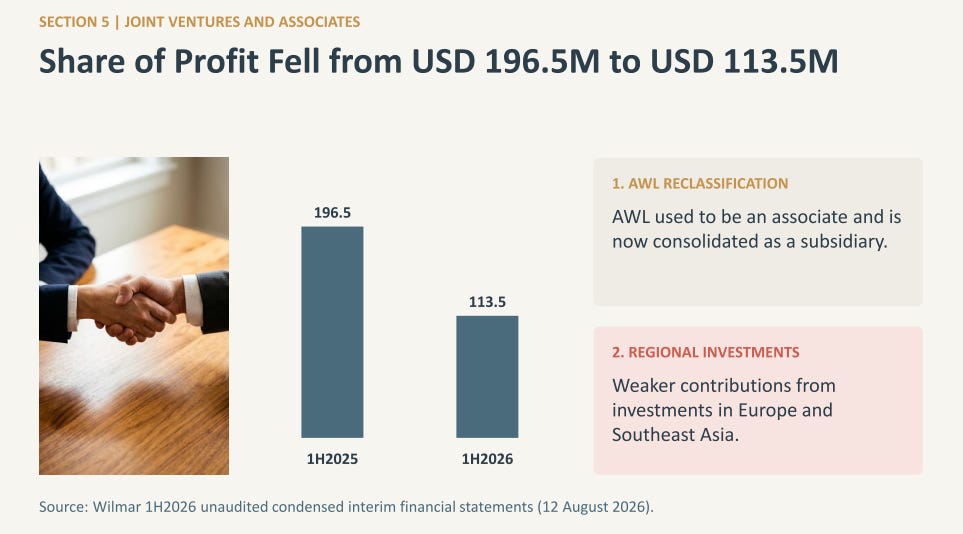
Share of profit from joint ventures and associates fell to USD 113.5 million from USD 196.5 million. The company says part of the fall is simply that AWL, which used to be an associate, is now a subsidiary. Weaker contributions from its investments in Europe and Southeast Asia also played a part.
This piece does not look at haze news or any single headline about palm oil in the same week. Nothing in Wilmar’s own half-year filing links the two, and a headline that lands in the same week as a result is a coincidence in time until someone shows a connection.
No One Pays Him To Be Right
Every finance channel says “unbiased.” Most of them also have a sponsor, an affiliate link, or a subscriber count to protect deciding what gets softened. Iggy doesn’t. This channel started as, and still is, a passion project, not an income source.
That’s not a slogan, it’s the actual reason a Zone 4 verdict stays a Zone 4 verdict even when it’s the stock in every uncle’s portfolio.

YouTube/Substack Combo members aren’t paying for faster access to opinions that were always going to be diplomatic anyway. You’re paying for the version of this analysis that exists because it doesn’t need to please anyone: full-length videos, the complete Red Zone watchlist, and institutional-grade cheatsheets built without a single sponsor’s name attached to the verdict.
For S$12/month, you’re not just getting the report first. You’re the reason it’s still honest.
Where Wilmar Sits on My Framework
Iggy’s Forensic Zone: Zone 4, Caution - (Growth Read: a scaled agribusiness with real profits and thin trading margins, interest cover is the primary constraint)
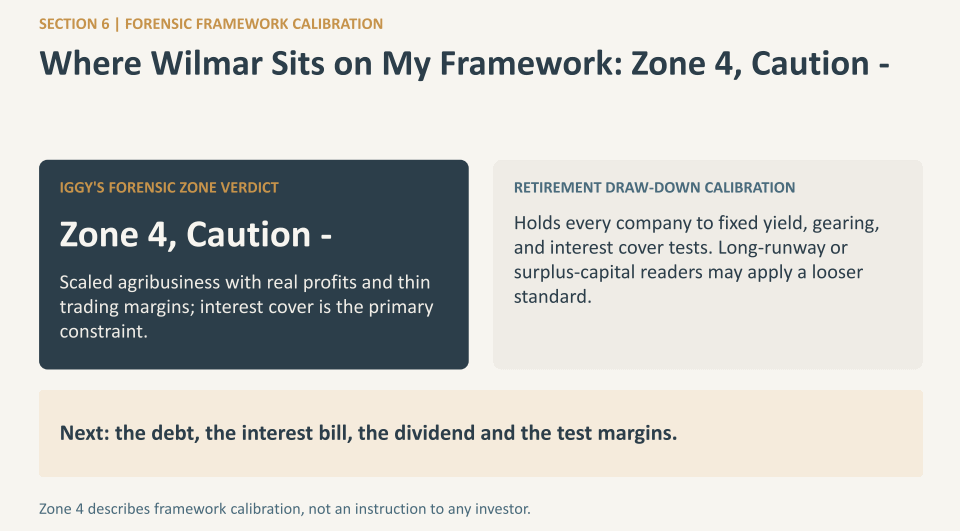
Zone 4 describes how my framework is calibrated. It is not an instruction to anyone. The framework is built around a reader drawing income in retirement, so it holds every company to fixed yield, gearing and interest cover tests. Two kinds of reader may reasonably apply a looser standard: someone with a long runway before drawdown, who can sit through the volatility the framework is built to flag, and someone holding capital beyond what retirement drawdown needs. The paid section shows which tests Wilmar misses and by how much.
🔒 What’s Next: Wilmar’s finance costs were about USD 539 million in six months, and the company says they are mostly trade related. The paid section sets that bill, the debt behind it, the dividend and the yield side by side, then shows each test and the margin by which it is missed.
